

Abstract
The understanding of the interplay between crystal structure and electronic structure in semiconductor materials is of great importance due to their potential technological applications. Pressure is an ideal external control parameter to tune the crystal structures of semiconductor materials in order to investigate their emergent piezo-electrical and optical properties. Accordingly, we investigate here the high-pressure behavior of the semiconducting antiferromagnetic material β-Cu2V2O7, finding it undergoes a pressure-induced phase transition to γ-Cu2V2O7 below 4000 atm. The pressure-induced structural and electronic evolutions are investigated by single-crystal X-ray diffraction, absorption spectroscopy and ab initio density functional theory calculations. β-Cu2V2O7 has previously been suggested as a promising photocatalyst for water splitting. Now, these new results suggest that β-Cu2V2O7 could also be of interest with regards to barocaloric effects, due to the low phase -transition pressure, in particular because it is a multiferroic material. Moreover, the phase transition involves an electronic band gap decrease of approximately 0.2 eV (from 1.93 to 1.75 eV) and a large structural volume collapse of approximately 7%.
Short abstract
The semiconducting antiferromagnetic material β-Cu2V2O7 is found to exhibit a pressure-induced phase transition to γ-Cu2V2O7 below 4000 atm. The pressure-induced structural and electronic evolutions are investigated by single-crystal X-ray diffraction, absorption spectroscopy, and ab initio density functional theory calculations. The phase transition is characterized by an electronic band gap decrease of approximately 0.2 eV (from 1.93 to 1.75 eV) and a large structural volume collapse of approximately 7%.
1. Introduction
1.1. Introduction
Copper vanadate materials constitute an important class of semiconducting inorganic compounds which exhibit a wide variety of chemical compositions: CuV2O6, Cu2V2O7, Cu3V2O8, Cu4V2O9, and Cu5V2O10. Of these, copper(II) pyrovanadate, Cu2V2O7, has been highlighted as a favorable material for the photocatalytic splitting of water into hydrogen and oxygen due to its band gap energy.1−3 Therefore, copper vanadate materials may play an essential role in the global shift toward renewable energy sources. Cu2V2O7 exhibits three known polymorphs, known as α, β, and γ, all of which are formed at elevated temperatures, either naturally occurring (α and β) or synthesized in the laboratory (γ), and all of which are (meta)stable at ambient conditions.4−9
The present work investigates β-Cu2V2O7 under high-pressure conditions at ambient temperature to explore the effect of pressure on the crystal and electronic structures. β-Cu2V2O7 has a number of interesting and useful properties; for example, β-Cu2V2O7 is a semiconducting antiferromagnetic material which has an (indirect) electronic band gap energy of ∼2 eV, which is optimal for absorbing energy within the solar range.10 β-Cu2V2O7 also exhibits interesting magnetic properties, due to its spin-1/2 honeycomb lattice of Cu2+ [3d9] ions, including quasi-1D antiferromagnetism.11−13 Finally, β-Cu2V2O7 is also known to exhibit a negative thermal expansion at ambient pressure.14,15 None of the Cu2V2O7 phases has previously been studied at high pressure; therefore, an additional motivation for this high-pressure investigation is to study mechanical similarities between the negative thermal expansion and pressure-induced volume decrease.
Herein, we report an experimental high-pressure single-crystal synchrotron X-ray diffraction (XRD) study of β-Cu2V2O7 under compression up to 4 GPa at ambient temperature. We present unambiguous evidence of a pressure-induced first-order phase transition from the monoclinic β-phase to the triclinic γ-phase between 0.14 and 0.40 GPa. We also investigate the electronic structure via absorption spectroscopy and ab initio density functional theory calculations, in particular the optical band gap and sub-band d–d transitions associated with Cu2+ coordination complexes, finding the phase transition to be characterized by a 0.2 eV band gap decrease and a decrease in the average crystal field strength. We also report a detailed study of the pressure evolution of both of the crystal structures, associated crystallographic parameters and physical properties, including the bulk moduli (via a pressure–volume equation of state (EoS)) and isothermal compressibility tensors of both β- and γ-phases.
2. Methods
2.1. Sample Preparation
Single crystals of β-Cu2V2O7 were grown by a flux method using SrV2O6 as a flux according to ref (16). A mixture of high-purity CuO, V2O5, and SrCO3 was ground fully and evenly with ethanol (99%) in an agate mortar. The mixture was packed into a platinum crucible (40 × 40 × 45 mm3) which was then placed in a homemade electric furnace. The furnace was heated up to 950 °C and kept at this peak temperature for 20 h. The furnace was then cooled slowly to 750 °C at a rate of 0.5 °C/h. The furnace was finally cooled down to room temperature at a rate of 100 °C/h. With the above growth procedure, single crystals of β-Cu2V2O7 with a size of 3 × 3 × 5 mm3 were obtained by mechanical separation from the crucible. Alternative synthesis methods for β-Cu2V2O7 also exist.2,17
2.2. Measurements
Angle-dispersive single-crystal XRD data were acquired in two ways. First, data were acquired at ALBA Synchrotron18 (Barcelona, Spain) on the BL04 - MSPD beamline using a monochromatic beam λ = 0.4246 Å focused to a spot size of 20 × 20 μm2. A SX165 Rayonix Mar CCD detector was used to record the data. Second, single-crystal XRD data were collected in-house at the University of La Laguna. CrysAlisPro19 was used to collect, index, scale, and apply numerical absorption corrections to the data. Single-crystal diffraction measurements (SC-XRD) were carried out at room temperature using a Rigaku SuperNOVA diffractometer equipped with an EOS CCD detector and a Mo radiation microsource (λ = 0.71073 Å). All measurements were processed with the CrysAlis software version 1.171.40.71.20 Numerical absorption correction based on Gaussian integration over a multifaceted crystal model was applied using the ABSORB7 program.21 For HP measurements we used a Mini-Bragg DAC from Almax-EasyLab, with an opening angle of 85° and anvil culets of 500 μm diameter, fitted with a stainless-steel gasket containing a hole of 200 μm diameter and 75 μm depth. A 4:1 methanol–ethanol mixture (ME) was used as a pressure-transmitting medium.22 The sample was placed on one of the diamonds anvils (diffracted side) together with a small ruby sphere as a pressure sensor.23 The structure was refined, for each pressure, using previous results as starting points, on F2 by full-matrix least-squares refinement using the SHELXL program.24
The optical absorption spectra were acquired using the sample-in sample-out method on the in-house optical setup at the University of Valencia, consisting of a visible–near-IR spectrometer (Ocean Optics Maya2000 Pro), a tungsten filament lamp, fused silica lenses, and reflecting optical objectives. The intensity of the light transmitted through the sample (I(ω)) was normalized against the intensity of the light transmitted through the 16:3:1 methanol–ethanol–water PTM (I0(ω)). Single crystals of β-Cu2V2O7, approximately 100 × 100 × 40 μm3 in size, were loaded into membrane-driven DACs with culet sizes of 500 μm. Tungsten gaskets were preindented to 50 μm thickness, and then sample chambers 250 μm in diameter were drilled prior to loading the crystals. Ruby crystals were included in the sample chamber for use as a pressure gauge.
Equations of state (EoS) were fitted to the volume-pressure data using EosFit7-GUI25 whereby the EoS were constrained to second-order (B0′ = 4) Birch–Murnaghan equations.26 The validity of the EoS fits was checked via the associated FE versus fE plots.27
2.3. Ab Initio Density Functional Theory Calculations
The ab initio simulations were carried out within the framework of density functional theory, DFT,28 with the Vienna ab initio Simulation Package, VASP.29,30 The projector augmented-wave, PAW, and pseudopotentials31,32 were employed and the plane-wave kinetic cutoff was extended up to 540 eV to ensure highly converged results. The integrations over the Brillouin zone, BZ, were carried out with k-points special samplings (4 × 4 × 3 and 5 × 4 × 3 grids, for the low and high-pressure phases, respectively). The exchange-correlation energy was described by means of the generalized gradient approximation, GGA, with the Armiento and Mattsson, AM05, prescription.33,34 To treat the strongly correlated states properly, the DFT+U method of Duradev et al.35 was employed. This method utilizes a single parameter, Ueff = U – J, where U and J are the effective on-site Coulomb and exchange parameters, respectively. The value used for Ueff was 6.5 eV for the Cu atoms.36,37 In the present study, the antiferromagnetic configuration was found to be the lower one in energy.
The unit cell parameters and the atomic positions were fully optimized to obtain, at selected volumes, the relaxed structure. The criteria imposed for the optimization were that the forces on the atoms were less than 0.003 eV/Å, and the deviations of the stress tensors from a diagonal hydrostatic form were lower than 0.1 GPa. In this way, the simulations provide a data set of volumes, energies, and pressures (from the stress tensor) that are fitted with a Birch–Murnaghan equation of state26 to obtain the theoretical equilibrium volume, the Bulk modulus, and the pressure derivatives.
The k-path for the electronic band structure calculations was chosen with the SeeK-path tool.38 The band structure analysis was carried out with the sumo package.39
3. Results and Discussion
3.1. Visual Observations
The pressure-induced β → γ phase transition is unambiguously confirmed by single-crystal XRD and ab initio density functional theory calculations (see the next section). Here, we begin by presenting two visual observations of the β → γ phase transition in the sample. First, the ∼2 eV band gap, which transmits light in the lower energy part of the visible spectrum (red/orange), is sensitive to pressure. In Figure 1 it is clear that the color of the Cu2V2O7 crystal becomes darker across the β → γ phase transition, which is associated with a band gap closure of ∼0.2 eV (see “Electronic Structure” section for further details). Second, as indicated by the arrow in Figure 1b, crystal fractures were observed on transition to the γ-phase. Neither crystal fracture nor color change necessarily indicates the existence of a phase transition; however, at such low pressures (<0.5 GPa), the fractures can indicate a large volume collapse associated with a first-order phase transitions. The transition is irreversible on sample decompression.
Figure 1.

Micrographs of a Cu2V2O7 crystal (orange) in the sample chamber of a DAC. (a) β-Cu2V2O7 crystal at 0.11 GPa. (b) γ-Cu2V2O7 crystal at 0.43 GPa.
3.2. Structural Analysis and Phase Transition
The crystal structures of β- and γ-Cu2V2O7 are shown in Figure 2, and basic crystallographic information is presented in Table 1. Comprehensive crystallographic information is provided in Tables S1–S3. The crystal structures have previously been described elsewhere, determined from ambient pressure XRD measurements;9 however, for the sake of discussion, the structures of β- and γ-Cu2V2O7, as determined in the current work, are briefly described here.
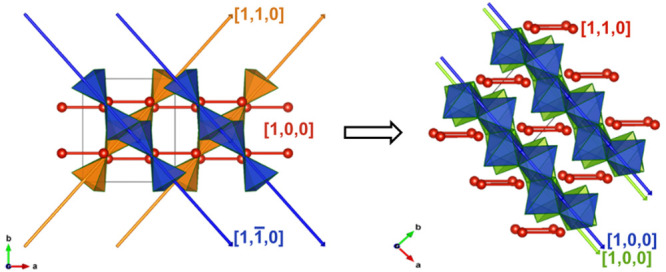
Figure 2.

Crystal structures of β- and γ-Cu2V2O7. (a) and (b) β- and γ-Cu2V2O7 structures, respectively, projected along their c-axes, oriented so that the V–V vectors (red lines) of both structures are mutually parallel on the page. (c) and (d) β- and γ-Cu2V2O7 structures, respectively, projected along their ab-planes. Blue (and orange) polyhedra correspond to penta-coordinated CuO5 units. Green polyhedra correspond to hexa-coordinated CuO6 units. Red spheres represent vanadium atoms. For the sake of clarity, the VO4 tetrahedra and the oxygen atoms, which correspond to the vertices of all coordination complexes, are not shown. Blue, orange, and green vectors show the crystallographic direction of the chains. The black axes represent the principal compression axes (discussed in the compressibility section). The crystal structures were rendered in Vesta.40 Supplementary crystallographic data for both β- and γ-Cu2V2O7 structures can be obtained free of charge from the Cambridge Crystallographic Data Centre (CCDC) under deposition numbers 2123194–2123205.
Table 1. Basic Crystal Data for β- and γ-Cu2V2O7a.
| phase | β-Cu2V2O7 |
γ-Cu2V2O7 |
||
|---|---|---|---|---|
| data | experiment | DFT | experiment | DFT |
| pressure (GPa) | 0.02 | 0.00 | 0.40 | 0.00 |
| crystal system | monoclinic | monoclinic | triclinic | triclinic |
| space group | C2/c | C2/c | P̅1 | P̅1 |
| a (Å) | 7.6858(11) | 7.7660 | 5.080(5) | 5.0540 |
| b (Å) | 8.0341(9) | 7.9205 | 5.8098(16) | 5.8041 |
| c (Å) | 10.121(3) | 10.0631 | 9.380(4) | 9.4689 |
| α (deg) | 90 | 90 | 100.00(3) | 99.80 |
| β (deg) | 110.39(2) | 109.36 | 97.20(6) | 97.88 |
| γ (deg) | 90 | 90 | 97.18(5) | 97.15 |
| V (Å3) | 585.8(2) | 584.0 | 267.4(3) | 268.0 |
| Z | 4 | 4 | 2 | 2 |
Comprehensive experimental crystallographic information is provided in Tables S1–S3.
The structure of β-Cu2V2O7 is shown in Figures 2a,c. In β-Cu2V2O7, all of the Cu2+ cations are crystallographically equivalent, and all of them are penta-coordinated by oxygen atoms, thereby forming CuO5 coordination complexes with a square-based-pyramidal configuration. (For clarity, the CuO5 units are shown in blue and orange in Figure 2a,c.) All CuO5 units share edges to form continuous 1D chains which point along the ab-plane diagonals. The chains are also organized into layers, which follow the stacking sequence (ABAB...), where chains in layer A point in the [1,1,0] direction (orange), while chains in layer B point in the [1,®1,0] direction (blue). These A and B layers are interconnected by layers of V2O7 dimers, which are each formed by two corner-sharing VO4 tetrahedra. The V–V vectors, defined by the vanadium atoms in the V2O7 units, are all mutually parallel and point along the a-axis (i.e., in the [1,0,0] direction).
The structure of the γ-Cu2V2O7 phase is shown in Figure 2b,d. The γ-Cu2V2O7 structure has two symmetrically independent Cu2+ cations. Half of the Cu2+ cations are penta-coordinated in the same way as those in β-Cu2V2O7; however, the other half are hexa-coordinated, thereby forming CuO6 units with octahedral coordination configuration (shown in green in Figure 2b,d). All CuO5 (CuO6) units, share edges to form continuous 1D chains, shown in blue (green). All CuO5 and CuO6 chains point along the a-axis, or in the [1,0,0] direction. The chains are also organized into layers, which follow the stacking sequence (ABAB...), where chains in layer A contain only CuO5 units (blue), while chains in layer B contain only CuO6 units (green). These A and B layers are again interconnected by layers of V2O7 dimers. The V–V vectors are all mutually parallel and point along the ab-plane diagonal (i.e., in the [1,1,0] direction).
It is clear from Figure 2 that the crystal structures of β- and γ-Cu2V2O7 are closely related. Both structures are characterized by alternating layers of chains of CuOx units, whereby the layers are interconnected by mutually parallel V2O7 units. The orientation of the V–V vectors (red) relative to the CuO5 chains (blue) is the same in both structures (shown in Figure 1). Therefore, the β → γ phase transition can be qualitatively described by two factors: (1) an increase of coordination number, from 5 to 6, of all CuO5 units in alternating layers and (2) a transformation of those layers (approximately by a reflection in the ac-plane) so that all CuO6 chains become parallel to the CuO5 chains.
Cu2V2O7 has not been studied previously under high-pressure conditions; therefore, this is the first time that the β → γ phase transition has been observed to be induced by pressure. Bearing in mind that β-Cu2V2O7 has been found to occur naturally in fumarloic areas and that the low pressure required to induce the β → γ phase transition (<0.4 GPa) occurs naturally in the earth’s crust, the present work shows that γ-Cu2V2O7 may also occur naturally although it has not yet been discovered. The β → γ phase transition has previously been observed to be induced by high temperatures (∼700 °C) at ambient pressures.7,8 Therefore, the β → γ phase boundary must have a steep negative slope in pressure–temperature space because it can be crossed by increasing either temperature (∼700 °C) or pressure (<0.4 GPa) from ambient conditions. Ab initio density functional theory (DFT) calculations of enthalpy, for the beta and gamma phases, found that the triclinic phase becomes the more stable phase at 0.1 GPa and 0 K (see Figure S1).
3.3. Electronic Structure
The optical properties, and thus the piezo- and thermochromic properties, exhibited by β- and γ-Cu2V2O7 can be explained by the optical transmission window defined by the interband charge transfer transitions (optical band gaps) and the sub-band absorption of Cu2+ d-levels (see Figure 3). The relative variations in transition energies and oscillator strength (absorption coefficient) with temperature and/or pressure determine these properties. Therefore, understanding these properties requires a precise knowledge of how structural variations (determined via XRD) affect the electronic structure.
Figure 3.

Absorption spectra and schematic energy level diagrams. (a) Experimental absorption spectra. Black lines correspond to β-Cu2V2O7 at 0.11 GPa. Red lines correspond to γ-Cu2V2O7 at 0.43 GPa. Dashed and dotted lines correspond to the linear fits determining the band gap energy. The band gap energies of β- and γ-Cu2V2O7 were experimentally determined to be 1.91 and 1.73 eV respectively. Dashed lines correspond to Gaussian fits determining the d-d transition energy. Inset: the experimental band gap as a function of pressure. The individual fitted spectra are shown in Figure S2. (b) Schematic energy level diagrams of the elongated octahedral CuO6 (nearly D4h) and elongated pyramidal CuO5 (nearly C4v) complexes.
The electronic structures of β- and γ-Cu2V2O7 were investigated via absorption spectroscopy measurements and ab initio simulations. There are two regions of interest in the adsorption spectra in Figure 3: first, on the right-hand side (above 1.8 eV), the optical band gap edges; second, on the left-hand side (below 1.8 eV), the absorption associated with d–d electronic transitions of Cu2+.
3.3.1. Band Structure
We first discuss the optical band gap energies. The band gap energies of β- and γ-Cu2V2O7 were experimentally determined to be 1.91 and 1.73 eV, respectively, thereby corresponding to a band gap collapse of 0.18 eV (∼9%) across the β → γ phase transition (as shown by arrow 1 in Figure 3). The β-phase band gap energy of 1.91 eV is in good agreement with the previously reported experimental values of 1.78 eV (ref (37)), 1.91 eV (ref (3)), and 2.21 eV (ref (41)) and the theoretically calculated value of 2.00 eV.10 The band gap of γ-Cu2V2O7 has not previously been reported. Density functional calculations were also carried out to obtain the full electronic band structures, as indicated in Figure 4, revealing both band gaps to be indirect. The calculated (experimental) band gap energies of β- and γ-Cu2V2O7 are 1.93 eV (1.91 eV) and 1.76 eV (1.73 eV) respectively, thereby showing excellent agreement between experiment and theory. The pressure evolution of the calculated band gaps up to 10 GPa is shown in Figure S3. The experimental band gaps as a function of pressure up to 2.4 GPa are shown in the inset in Figure 3. Additionally, the DOS (total density of states) and the projected density of states (Figure S4) are very similar for both phases. The upper level of the valence band is contributed to mainly by Cu-3d and O-2p states, while the O 2s states are located in the lower part of the valence band. As for the conduction band, the major contribution comes from the V 3d states.
Figure 4.

Calculated electronic band structures of β- and γ-Cu2V2O7. (a) β-Cu2V2O7 at 0.0 GPa. (b) γ-Cu2V2O7 at 0.9 GPa.
3.3.2. Sub-Band Absorption
We now discuss the sub-band absorption (below 1.8 eV) associated with d–d electronic transitions of Cu2+. The broad Gaussian-shaped absorbing regions observed in the sub-band gap energy region below 1.8 eV (see Figure 3) are due to d–d electronic transitions of Cu2+ and the transition energies can be thoroughly explained by crystal-field (CFM) and angular overlap (AOM) models.42,43 The maxima, bandwidth, and oscillator strength of these bands strongly depend on the Cu2+ local symmetry of the CuO5 or CuO6 coordination complexes.44Figure 3b shows schematic energy level diagrams of the elongated octahedral CuO6 (nearly D4h) and elongated pyramidal CuO5 (nearly C4v) complexes, and the corresponding energies as a function of the σ and π bonding AOM parameters eσ and eπ for the equatorial (eq) and axial (ax) ligands.42 The crystal-field strength scales with the bond distance in oxides as a power of 5:10Dq(R) = C/(R5), where R is the bond length. This R-dependence is found from basic CF theory,43,45,46 and it has also been observed experimentally in several high-pressure experiments in transition metal oxides and fluorides involving Cr3+ (ref (47)), Fe3+ (refs (48−50)), or Co2+(ref (51)) within an experimental accuracy of 5.0 ± 0.5. Therefore, the ratio of the transition energies in the β- and γ-phases is given by
| 1 |
The derivation of eq 1 is provided in the Supporting Information. Taking the average Reqβ = 1.95 Å and Reqγ = 2.01 Å from the experimental XRD data, the reduction in E(e → b1) along the β → γ phase transition should be 0.86 according to the model. The experimental energy ratio between 1.41 eV (β) and 1.18 (γ) gives a ratio of 0.84 in excellent agreement with the model.
It must be noted that although Reqβ and Reqγ are derived as an average of the four short Cu–O distances obtained from XRD for CuO5 the standard deviation of such distances is below σ = 0.012 Å in the β-phase and 0.07 Å in the γ-phase. In fact, the slight double-humped band observed in both phases (Figure 3a) may be due to low-symmetry local distortion of CuO5 beyond C4v. This symmetry lowering would additionally split the doubly degenerate e levels into two singlets (xz, yz) yielding additional broadened bands.
In Figure 3, both sub-band absorption spectra are completely determined by the CuO5 polyhedra because d–d transitions are, in the first approximation, parity-forbidden in centrosymmetric compounds like CuO6 (Laporte rule), although they can occur via electron–phonon coupling, thereby contributing only weakly to the observed spectrum. An additional simplification is that the e(dxz,dyz) → b1(dx2–y2) electric-dipole transition, which is allowed in CuO5, has an oscillator strength which is an order of magnitude higher than any of the other d–d transitions in CuO5 (involving the b2(dxy) and a1(d3z2–r2) levels), or in the nearly D4h elongated CuO6 (eg, b2g, a1g → b1).45,52 Therefore, only one transition is needed to explain the sub-band absorption peaks.
The sub-band absorption maxima are found at 1.41 and 1.18 eV for β- and γ-Cu2V2O7, respectively, thereby corresponding to a decrease in the transition energy of approximately 0.23 eV across the phase transition (as indicated by arrow 2 in Figure 3). The transition energy (or d-level splitting) in CuO5 is determined by the strength of the crystal field, which is in turn determined by the Cu–O bond lengths. The decrease in transition energy across the phase transition implies a decrease in crystal field strength and therefore an increase in Cu–O bond length. This is consistent with the Cu–O bond lengths determined from our XRD data (see Figure S5). For example, the average CuO5 equatorial (axial) Cu–O distance increases from 1.95 (2.25) Å to 2.01 (2.33) Å across the phase transition. For comparison, these values are in agreement with those found in α-CuMoO4, wherein the e → b1 absorption energy is identified as 1.49 eV in CuO5 units which have an average equatorial Cu–O distance of 1.93 Å (ref (52)). A similar energy of 1.7 eV was also reported in YBa2Cu3Oy in ref (53).
The observed oscillator strength (absorption coefficient) largely depends on the orientation of the transition dipole, which in this case is in the basal plane of the CuO5 polyhedra, and the electric field vector of the incident light used in the experiment. Because the γ-phase has exactly half the number of CuO5 polyhedra of the β-phase, a drop in oscillator strength would be expected across the phase transition, however the opposite is observed (as shown by arrow 3 in Figure 3). This can be attributed to the spatial orientation of the single crystal sample relative to the incident light. It is not possible to comment on the crystallographic orientation in the absorption spectra because the XRD measurements were carried out independently on different single crystal samples.
3.4. Bulk Modulus
The β → γ phase transition is unambiguously categorized as first-order according to the plot of the normalized unit cell volume (V/Z) as a function of pressure, as shown in Figure 5a. A volume collapse of approximately 7% is observed across the phase transition in both experimental and calculated data. The normalized ambient pressure volumes, V0, and bulk moduli, B0, were determined by fitting Birch–Murnaghan (BM) equations of state (EoS) truncated to second-order in energy (B0′ = 4) to the data. Due to the low phase transition pressure, only four experimental data points were obtained for β-Cu2V2O7. Therefore, the theoretical data (black dashed line in Figure 5a) are used for the discussion. The excellent reliability of the calculated data is clearly shown in Figure 5 (dashed lines) by the close agreement with the experimentally determined lattice parameters.
Figure 5.

Equation of state and pressure-response of crystal lattice parameters in β- and γ-Cu2V2O7 to 4 GPa. (a) Normalized unit cell volume as a function of increasing pressure up to 4 GPa. (b) Normalized stress as a function of Eulerian strain for the experimental data. (c) Lattice constants a, b, and c, and (d) unit cell angles, α, β, and γ, as functions of pressure. Data corresponding to β-Cu2V2O7 (γ-Cu2V2O7) are shown in black (blue). (a, c, d) Solid (dashed) lines correspond to second-order Birch–Murnaghan equations of state (BM EoS) fitted to the experimental (calculated) data. Vertical dashed gray lines show the approximate phase transition pressure. The labels “ULL” and “ALBA” respectively signify data collected in-house at the University of La Laguna and at ALBA Synchrotron. ICSD refers to the ambient condition (atmospheric pressure and room temperature) γ-Cu2V2O7 structure of ref (9) taken from the Inorganic Crystal Structure Database.
The normalized volume at ambient pressure, V0, and bulk modulus, B0, for both β- and γ-Cu2V2O7 (summarized in Figure 5a) are as follows: For the low-pressure phase, β-Cu2V2O7, the DFT data are fitted with V0,DFT = 146.3 Å3 and B0,DFT = 64.7 GPa. For the high-pressure phase, γ-Cu2V2O7, the parameters are V0,DFT = 134.2(9) Å3 and B0,DFT = 67.8 GPa, which are in excellent agreement with those determined from the experimental data: V0,exp = 134.7(9) Å3 and B0,exp. = 67(8) GPa. Numbers in parentheses are the estimated standard error in the least significant digit. These bulk moduli are comparable to some of the lowest observed in other vanadate materials, for example Cu3V2O8 and Zn2V2O7, at 52(2) and 58(9) GPa, respectively.54,55
Figure 5b shows the normalized stress, FE, as a function of Eulerian strain, fE. The FE versus fE plot provides assessment of the quality of the fitted EoS, whereby a zero-gradient fit to the data indicates that a second-order truncation of the BM EOS is suitable (see ref (27) for more details). as is the case for γ-Cu2V2O7 (see Figure 5b).
3.5. Isothermal Compressibility
The isothermal compressibility tensor describes the principal axes of compression which, for any crystal system, constitute a unique set of orthogonal axes along which compressibility is described by a linear function of pressure.57 The magnitudes (compressibilities, K) and directions of the principal axes of compression (X1, X2, and X3) for β- and γ-Cu2V2O7 are presented in Table 2.
Table 2. Compressibility Data for β- and γ-Cu2V2O7a.
| β-Cu2V2O7 | |||
|---|---|---|---|
| axis | compressibility, K (GPa–1) | direction [u, v, w] | approx. direction [x, y, z] |
| X1 | 31.8 × 10⁻³ | 0.8031, 0.0000, 0.5959 | 4, 0, 3 |
| X2 | 5.2 × 10⁻³ | 0.0000, 1.0000, 0.0000 | 0, 1, 0 |
| X3 | 32.1 × 10⁻³ | 0.7818, 0.0000, −0.6236 | 4, 0, −3 |
| γ-Cu2V2O7 | |||
|---|---|---|---|
| axis | compressibility, K (GPa–1) | direction [u, v, w] | approx. direction [x, y, z] |
| X1 | 5.75 × 10⁻³ | –0.6089, 0.3500, 0.7118 | –12, 7, 14 |
| X2 | 4.59 × 10⁻³ | –0.0136, 0.9924, −0.1222 | 0, 1, 0 |
| X3 | 2.28 × 10⁻³ | 0.9262, 0.2496, 0.2826 | 4, 1, 1 |
The principal compression axes (X1, X2, and X3) are represented by black arrows in Figures 2 and 6. The data in the table were calculated using the lattice parameters from the single crystal XRD analysis (Tables S1–S3) and the PASCal principal axis strain calculator.56.
The principal axes of compression of β-Cu2V2O7 reveal a pronounced anisotropic compressibility (see Figures 2 and 6) which is herein rationalized in terms of the underlying crystal structure. The principal axis of minimal compression, in this case X2, points in the [0,1,0] direction and has a compressibility of 5.2 × 10⁻³ GPa–1. Therefore, the least compressible direction in β-Cu2V2O7 exactly corresponds to the crystallographic b-axis and points exactly between the layers of chains of edge-sharing CuO5 units (which lie in the ab-plane). Additionally, X2 dissects the smallest angle between the two different types of chains (see Figure 2a) thereby pinpointing the direction of maximum strength.
Figure 6.

Crystal structures of β- and γ-Cu2V2O7 showing the lone electron pair (LEP) vectors. (a, c) β-Cu2V2O7 and (b, d) γ-Cu2V2O7. Blue arrows show the direction of the LEP on each CuO5 unit (blue polyhedra). Black arrows represent the compressibility axes. The arrow length shown in the figure is proportional to the magnitude of compressibility for the corresponding axis.
In contrast, the intermediate and major principal compression axes (X1 and X3) in β-Cu2V2O7 are approximately 6 times more compressible than X2, with mutually comparable compressibilities of 31.8 × 10⁻³ and 32.1 × 10⁻³ GPa–1 respectively. Both X1 and X3 lie in ac-plane, and as per the definition of the principal axes of compression, they are related by a rotation of 90° since their directions are [4,0,3] and [4,0,–3], respectively. It is important that both of X1 and X3 lie in the ac-plane because they share this description with all of the CuO5 lone electron pairs (LEPs) (see Figure 6a,c). Specifically, each penta-coordinated CuO5 units possesses an axial LEP, opposite the axial oxygen atom, which points toward the location where a sixth oxygen would make a complete octahedron. The directions of the LEPs are indicted by blue arrows in Figure 6. The LEPs are exactly perpendicular to the principal axis of minimal compression, X2 (equivalently, the b-axis); therefore, it is clear that the LEPs are responsible for the highly anisotropic compressibility of β-Cu2V2O7. A similar phenomenon has also been observed in iodates.58
The principal axes of compression of γ-Cu2V2O7 reveal a much less pronounced anisotropic compressibility in contrast to that of β-Cu2V2O7. Where the principal axes of major and minor compression in the β-phase respectively had compressibilities of 32.1 × 10⁻³ and 5.2 × 10⁻³ GPa–1 (a difference of a factor of approximately 6), in the γ-phase, they have compressibilities of 5.75 × 10⁻³ and 2.28 × 10⁻³ GPa–1 (a difference of a factor of approximately 2). Interestingly, the most compressible axis in the γ-phase phase is roughly equivalent to the least compressible axis in the β-phase in terms of compressibility.
3.6. Pressure-Induced Structural Evolution/Relation to Nonlinear Thermal Expansion
The β-Cu2V2O7 structure exhibits negative thermal expansion (NTE) at ambient pressures. The primary mechanism for the NTE is believed to relate primarily to a transverse vibrational mode associated with the oxygen atom which bridges the VO4 tetrahedra in the V2O7 units (O3V–O–VO3). The V2O7 units interlink the chains of edge-sharing CuOx units; therefore, a vibrational mode perpendicular to the V–O–V bridge causes a reduction in the time-averaged distance between the vanadium atoms, thereby pulling the layers closer together and reducing the unit volume.14,15
Since the layers lie in the ab-plane, a reduction in the lattice constant c corresponds to a decrease in the interlayer distance. As shown in Figure 5c, all lattice constants for both phases decrease monotonically with increasing pressure. In the present work, the interlayer spacing abruptly decreases from 4.7429 to 4.5294 Å across the β → γ phase transition, thereby corresponding to a change in interlayer spacing of −0.2135 Å. Because only the time-averaged atomic positions can be observed in XRD measurements, the vibrational modes cannot be observed directly. However, the time-averaged V2O7 unit provides insight regarding the pressure-induced structural behavior. For example, Figure 7a shows the intervanadium (V–V) distance as a function of pressure. The V–V distance decreases with pressure in both phases; however, it jumps by +0.1 Å across the β → γ phase transition. The normalized unit cell volume decreases across the transition, therefore the V–V distance is clearly not the dominating factor in the volume decrease. Additionally, as shown in Figure 7b, the V–O–V angle, formed by the bridging oxygen atom, appears to remain constant in the β-phase, whereas it decreases with pressure in the γ-phase and exhibits no clear jump across the phase transition. Therefore, the V–O–V angle is also not responsible for the large volume collapse. The Cu–O bond distances also remain roughly constant over the full pressure range (see Figure S5), and in fact, the volume of the CuOx coordination complexes appears to increase (see Figure S6). The key to the volume collapse of ΔV ≈ 7% therefore likely lies with the mutual rotation of the VO4 units. According to the XRD data, when viewed along the V–V direction (as shown in Figure 7c) the O3V–O–VO3 configuration goes from staggered in the β-phase to slightly eclipsed in the γ-phase. In a perfectly staggered configuration all of the O–V–(O)–V–O dihedral angles, θ, would be equal to 60°. All V2O7 dihedral angles are plotted as a function of pressure in Figure 7d, whereby it is clear that the dihedral angles in the γ-phase exhibit a larger deviation from 60° than those in the β-phase. This is important because it suggests that the relative rotation of the VO4 units (which comprise the V2O7 dimers) is an important characteristic of the volume collapse. This supports previous ambient pressure investigations which suggest that mutual rotation of the VO4 molecular units, suggested by vibrational spectroscopy measurements, underpin the negative thermal expansion mechanism.14,15
Figure 7.

Pressure evolution of the V2O7 dimers in β- and γ-Cu2V2O7. (a) Interatomic distance between vanadium atoms. (b) Angle between the V–O bonds, forming the V–O–V angle. (c) V2O7 molecules viewed along the axis defined by the vanadium atoms before (top) and after (bottom) the phase transition. (d) Pressure evolution of the O–V–(O)–V–O dihedral angles, θ.
4. Conclusions
We report an experimental high-pressure single-crystal synchrotron XRD study of Cu2V2O7 under compression to 4 GPa at ambient temperature. The results unambiguously reveal a previously unknown first-order pressure-induced phase transition from monoclinic β-Cu2V2O7 to triclinic γ-Cu2V2O7 below 0.40 GPa. The β → γ phase transition is associated with a volume collapse of approximately 7%, an increase in oxygen coordination (from 5 → 6) of half of the Cu2+ coordination complexes, and a reorientation of 1-dimensional chains composed of edge sharing CuO6 units. The phase transition is also characterized by an indirect → indirect electronic band gap decrease of approximately 0.2 eV as measured by absorption spectroscopy (1.93 → 1.75 eV) and calculated via density functional calculations (1.93 → 1.76 eV). The band gap of γ-Cu2V2O7 has been measured here for the first time, indicating that γ-Cu2V2O7 has better potential as a photocatalyst for water splitting than does β-Cu2V2O7 due to its lower band gap and therefore greater absorption of visible light. The pressure evolution of the crystal lattice parameters and isothermal compressibility tensor are also reported here for the first time. The compressibility of β-Cu2V2O7 is found to be highly anisotropic, with the axis of minimal compression being approximately six times less compressible than the other two axes. The anisotropic compressibility is rationalized in terms of the underlying crystal structures and the presence and spatial orientation of lone-electron pairs on the constituent CuO5 units. Due to the low transition pressure at ambient temperature, large volume collapse, and the fact that Cu2V2O7 is a multiferroic material, this combined experimental and theoretical investigation into the high-pressure structural and electronic evolution of Cu2V2O7 suggests that in addition to the previously suggested uses in photocatalytic water splitting Cu2V2O7 could also be a very relevant material for exploring solid state barocaloric effects, such as solid-state refrigeration technologies based on crystals which are environmentally friendly. For a material to be promising in terms of barocaloric effects it needs to exhibit, among other qualities, a first-order like phase transition involving large structural changes (e.g., volume change) near room temperature induced by small pressure drifts (i.e., of the order of 0.1 GPa). As shown in the current work, Cu2V2O7 appears to meet these specifications.
Acknowledgments
The authors acknowledge financial support from the Spanish Research Agency (AEI) and Spanish Ministry of Science and Investigation (MCIN) under projects PID2019106383GB-C41/C43/C44 (DOI: 10.13039/501100011033), and projects PGC2018-101464–B-I00 and PGC2018-097520-A-I00 (cofinanced by EU FEDER funds). The authors acknowledge financial support from the MALTA Consolider Team network, under project RED2018-102612-T. R.T. acknowledges funding from the Spanish Ministry of economy and competitiveness (MINECO) via the Juan de la Cierva Formación program (FJC2018-036185-I). J.G.P. thanks the Servicios Generales de Apoyo a la Investigación (SEGAI) at the University of La Laguna. A.L. and D.E. would like to thank the Generalitat Valenciana for the Ph.D. fellowship GRISOLIAP/2019/025, and the authors would also like to thank them for funding under the Grant Prometeo/2018/123 (EFIMAT). The authors also thank ALBA synchrotron light source for funded experiment under proposal numbers 2020074389 and 2020074398 at the MSPD-BL04 beamline.
Supporting Information Available
The Supporting Information is available free of charge at https://pubs.acs.org/doi/10.1021/acs.inorgchem.1c03878.
Detailed crystallographic tables; calculated relative enthalpy; absorption spectra; calculated band gap energies; density of states and projected density of states; derivation of the ratio of sub-band transition energies; pressure evolution of the Cu–O bonds in CuO5 and CuO6 polyhedra; and CuOx and VO4 polyhedral volumes as functions of pressure (PDF)
Accession Codes
CCDC 2123194–2123205 contain the supplementary crystallographic data for this paper. These data can be obtained free of charge via www.ccdc.cam.ac.uk/data_request/cif, or by emailing data_request@ccdc.cam.ac.uk, or by contacting The Cambridge Crystallographic Data Centre, 12 Union Road, Cambridge CB2 1EZ, UK; fax: +44 1223 336033.
All relevant data are available from the corresponding author upon reasonable request.
The authors declare no competing financial interest.
Supplementary Material
References
- Hassan A.; Iqbal T.; Tahir M. B.; Afsheen S. A review on copper vanadate-based nanostructures for photocatalysis energy production. Int. J. Energy Res. 2019, 43, 9–28. 10.1002/er.4195. [DOI] [Google Scholar]
- Guo W.; Chemelewski W. D.; Mabayoje O.; Xiao P.; Zhang Y.; Mullins C. B. Synthesis and characterization of CuV2O6 and Cu2V2O7: Two photoanode candidates for photoelectrochemical water oxidation. J. Phys. Chem. C 2015, 119, 27220–27227. 10.1021/acs.jpcc.5b07219. [DOI] [Google Scholar]
- Song A.; Chemseddine A.; Ahmet I. Y.; Bogdanoff P.; Friedrich D.; Abdi F. F.; Berglund S. P.; van de Krol R. Evaluation of copper vanadate (β-Cu2V2O7) as a photoanode material for photoelectrochemical water oxidation. Chem. Mater. 2020, 32, 2408–2419. 10.1021/acs.chemmater.9b04909. [DOI] [Google Scholar]
- Mercurio-Lavaud D.; Frit B. Structure cristalline de la variété basse température du pyrovanadate de cuivre: Cu2V2O7α. Acta Crystallogr. B 1973, 29, 2737–2741. 10.1107/S0567740873007478. [DOI] [Google Scholar]
- Calvo C.; Faggiani R. α Cupric divanadate. Acta Crystallogr. B 1975, 31, 603–605. 10.1107/S0567740875003354. [DOI] [Google Scholar]
- Hughes J. M.; Birnie R. W. Ziesite, β-Cu2V2O7, a new copper vanadate and fumarole temperature indicator. Am. Mineral. 1980, 65, 1146–1149. [Google Scholar]
- Clark G. M.; Garlick R. Formation and properties of copper (II) divanadate (V). J. Inorg. Nucl. Chem. 1978, 40, 1347–1349. 10.1016/0022-1902(78)80048-7. [DOI] [Google Scholar]
- Rao N. S.; Palanna O. G. Phase transition in copper (II) pyrovanadate. Bull. Mater. Sci. 1993, 16, 37–43. 10.1007/BF02745305. [DOI] [Google Scholar]
- Krivovichev S. V.; Filatov S. K.; Cherepansky P. N.; Armbruster T.; Pankratova O. Y. Crystal structure of γ-Cu2V2O7 and its comparison to blossite (α–Cu2V2O7) and ziesite (β-Cu2V2O7). Canad. Mineral. 2005, 43, 671–677. 10.2113/gscanmin.43.2.671. [DOI] [Google Scholar]
- Yashima M.; Suzuki R. O. Electronic structure and magnetic properties of monoclinic β-Cu2V2O7: A GGA+ U study. Phys. Rev. B 2009, 79, 125201. 10.1103/PhysRevB.79.125201. [DOI] [Google Scholar]
- He Z.; Ueda Y. Paramagnetic anisotropy and spin-flop transition in single crystals of the quasi-one-dimensional system β-Cu2V2O7. Phys. Rev. B 2008, 77, 052402. 10.1103/PhysRevB.77.052402. [DOI] [Google Scholar]
- Banerjee A.; Sannigrahi J.; Bhowal S.; Dasgupta I.; Majumdar S.; Walker H. C.; Bhattacharyya A.; Adroja D. T. Spin wave excitations in the pyrovanadate α–Cu2V2O7. Phys. Rev. B 2016, 94, 144426. 10.1103/PhysRevB.94.144426. [DOI] [Google Scholar]
- Tsirlin A. A.; Janson O.; Rosner H. β-Cu2V2O7: A spin-1/2 honeycomb lattice system. Phys. Rev. B 2010, 82, 144416. 10.1103/PhysRevB.82.144416. [DOI] [Google Scholar]
- Zhang N.; Li L.; Wu M.; Li Y.; Feng D.; Liu C.; Mao Y.; Guo J.; Chao M.; Liang E. Negative thermal expansion and electrical properties of α–Cu2V2O7. J. Eur. Ceram. Soc. 2016, 36, 2761–2766. 10.1016/j.jeurceramsoc.2016.04.030. [DOI] [Google Scholar]
- Wang H.; Yang M.; Chao M.; Guo J.; Gao Q.; Jiao Y.; Tang X.; Liang E. Negative thermal expansion property of β-Cu2V2O7). Solid State Ion. 2019, 343, 115086. 10.1016/j.ssi.2019.115086. [DOI] [Google Scholar]
- He Z.; Ueda Y. Flux growth of β-Cu2V2O7 single crystals in a closed crucible. Cryst. Growth Des. 2008, 8, 2223–2226. 10.1021/cg7007478. [DOI] [Google Scholar]
- Sato M.; Warne-Lang V.; Kadowaki Y.; Katayama N.; Okamoto Y.; Takenaka K. Sol–gel synthesis of doped Cu2V2O7 fine particles showing giant negative thermal expansion. AIP Adv. 2020, 10, 075207. 10.1063/5.0010631. [DOI] [Google Scholar]
- Fauth F.; Peral I.; Popescu C.; Knapp M. The new material science powder diffraction beamline at ALBA synchrotron. Powder Diffr. 2013, 28, S360–S370. 10.1017/S0885715613000900. [DOI] [Google Scholar]
- CrysAlis PRO; Agilent Technologies: Yarnton, England, 2010.
- Rigaku Oxford Diffraction - CrysAlisPro Software system, version 1.171.41.99a; Rigaku Corporation: Oxford, U.K., 2021. [Google Scholar]
- Angel R.; Gonzalez-Platas J. Absorp-7 and Adsorb-GUI for single-crystal absorption corrections. J. Appl. Crystallogr. 2013, 46, 252–254. 10.1107/S0021889812048431. [DOI] [Google Scholar]
- Klotz S.; Chervin J. C.; Munsch P.; Le Marchand G. Hydrostatic limits of 11 pressure transmitting media. J. Phys. D 2009, 42, 075413. 10.1088/0022-3727/42/7/075413. [DOI] [Google Scholar]
- Shen G.; Wang Y.; Dewaele A.; Wu C.; Fratanduono D. E.; Eggert J.; Klotz S.; Dziubek K. F.; Loubeyre P.; Fat’yanov O. V.; et al. Toward an international practical pressure scale: A proposal for an IPPS ruby gauge (IPPS-Ruby2020). High Press. Res. 2020, 40, 299–314. 10.1080/08957959.2020.1791107. [DOI] [Google Scholar]
- Sheldrick G. M. Crystal structure refinement with SHELXL. Acta Crystallogr. C: Struct. Chem. 2015, 71, 3–8. 10.1107/S2053229614024218. [DOI] [PMC free article] [PubMed] [Google Scholar]
- Gonzalez-Platas J.; Alvaro M.; Nestola F.; Angel R. EosFit7-GUI: a new graphical user interface for equation of state calculations, analyses and teaching. J. Appl. Crystallogr. 2016, 49, 1377. 10.1107/S1600576716008050. [DOI] [Google Scholar]
- Birch F. Finite Elastic Strain of Cubic Crystals. Phys. Rev. 1947, 71, 809–824. 10.1103/PhysRev.71.809. [DOI] [Google Scholar]
- Angel R. J. Equations of state. Rev. Mineral. Geochem. 2000, 41, 35. 10.2138/rmg.2000.41.2. [DOI] [Google Scholar]
- Hohenberg P.; Kohn W. Inhomogeneous electron gas. Phys. Rev. B 1964, 136, B864. 10.1103/PhysRev.136.B864. [DOI] [Google Scholar]
- Kresse G.; Furthmüller J. Efficiency of ab-initio total energy calculations for metals and semiconductors using a plane-wave basis set. Comput. Mater. Sci. 1996, 6, 15–50. 10.1016/0927-0256(96)00008-0. [DOI] [PubMed] [Google Scholar]
- Kresse G.; Furthmüller J. Efficient iterative schemes for ab initio total-energy calculations using a plane-wave basis set. Phys. Rev. B 1996, 54, 11169. 10.1103/PhysRevB.54.11169. [DOI] [PubMed] [Google Scholar]
- Blöchl P. E. Projector augmented-wave method. Phys. Rev. B 1994, 50, 17953–17979. 10.1103/PhysRevB.50.17953. [DOI] [PubMed] [Google Scholar]
- Kresse G.; Joubert D. From ultrasoft pseudopotentials to the projector augmented-wave method. Phys. Rev. B 1999, 59, 1758. 10.1103/PhysRevB.59.1758. [DOI] [Google Scholar]
- Armiento R.; Mattsson A. E. Functional designed to include surface effects in selfconsistent density functional theory. Phys. Rev. B 2005, 72, 085108. 10.1103/PhysRevB.72.085108. [DOI] [Google Scholar]
- Mattsson A. E.; Armiento R.; Paier J.; Kresse G.; Wills J. M.; Mattsson T. R. The AM05 density functional applied to solids. J. Chem. Phys. 2008, 128, 084714. 10.1063/1.2835596. [DOI] [PubMed] [Google Scholar]
- Dudarev S. L.; Botton G. A.; Savrasov S. Y.; Humphreys C. J.; Sutton A. P. Electron-energyloss spectra and the structural stability of nickel oxide: An LSDA+ U study. Phys. Rev. B 1998, 57, 1505. 10.1103/PhysRevB.57.1505. [DOI] [Google Scholar]
- Anisimov V. I.; Zaanen J.; Andersen O. K. Band theory and Mott insulators: Hubbard U instead of Stoner I. Phys. Rev. B 1991, 44, 943. 10.1103/PhysRevB.44.943. [DOI] [PubMed] [Google Scholar]
- Bhowal S.; Sannigrahi J.; Majumdar S.; Dasgupta I. A comparative study of electronic, structural, and magnetic properties of α–, β-, and γ-Cu2V2O7. Phys. Rev. B 2017, 95, 075110. 10.1103/PhysRevB.95.075110. [DOI] [Google Scholar]
- Hinuma Y.; Pizzi G.; Kumagai Y.; Oba F.; Tanaka I. Band structure diagram paths based on crystallography. Comput. Mater. Sci. 2017, 128, 140–184. 10.1016/j.commatsci.2016.10.015. [DOI] [Google Scholar]
- Ganose A. M.; Jackson A. J.; Scanlon D. O. sumo: Command-line tools for plotting and analysis of periodic ab initio calculations. J. Open Source Softw. 2018, 3, 717. 10.21105/joss.00717. [DOI] [Google Scholar]
- Momma K.; Izumi F. VESTA: a three-dimensional visualization system for electronic and structural analysis. J. Appl. Crystallogr. 2008, 41, 653–658. 10.1107/S0021889808012016. [DOI] [Google Scholar]
- Vali A.; Sarker H. P.; Heredia Cervera B.; Rodríguez-Gutiérrez I.; Hossain M. K.; Huda M. N.; Oskam G.; Rajeshwar K. Optical, Electrochemical, and Photoelectrochemical Behavior of Copper Pyrovanadate: A Unified Theoretical and Experimental Study. J. Phys. Chem. 2021, 125, 19609–19620. 10.1021/acs.jpcc.1c04717. [DOI] [Google Scholar]
- Schönherr T.; Atanasov M.; Adamsky H. Angular overlap model. Comprehensive Coordination Chemistry II 2003, 2, 443–455. 10.1016/B0-08-043748-6/01052-5. [DOI] [Google Scholar]
- Sugano S.Multiplets of Transition-Metal Ions in Crystals; Elsevier, 2012. [Google Scholar]
- Ruiz-Fuertes J.; Segura A.; Rodríguez F.; Errandonea D.; Sanz-Ortiz M. N. Anomalous high-pressure Jahn-Teller behavior in CuWO4. Phys. Rev. Lett. 2012, 108, 166402. 10.1103/PhysRevLett.108.166402. [DOI] [PubMed] [Google Scholar]
- Burns R. G.Mineralogical Applications of Crystal Field Theory; Cambridge University Press, 1993. [Google Scholar]
- Lever A. P.Inorganic electronic spectroscopy. In Studies in Physical and Theoretical Chemistry; Elsevier, 1984. [Google Scholar]
- Drickamer H. G.; Frank C. W.. Electronic Transitions and the High Pressure Chemistry and Physics of Solids; Springer Science & Business Media, 2013. [Google Scholar]
- Li J.; Struzhkin V. V.; Mao H. K.; Shu J.; Hemley R. J.; Fei Y.; Mysen B.; Dera P.; Prakapenka V.; Shen G. Electronic spin state of iron in lower mantle perovskite. Proc. Natl. Acad. Sci. U. S. A. 2004, 101, 14027–14030. 10.1073/pnas.0405804101. [DOI] [PMC free article] [PubMed] [Google Scholar]
- Duclos S. J.; Vohra Y. K.; Ruoff A. L. Pressure dependence of the 4T2 and 4T1 absorption bands of ruby to 35 GPa. Phys. Rev. B 1990, 41, 5372. 10.1103/PhysRevB.41.5372. [DOI] [PubMed] [Google Scholar]
- Gómez-Salces S.; Aguado F.; Rodríguez F.; Valiente R.; González J.; Haumont R.; Kreisel J. Effect of pressure on the band gap and the local FeO6 environment in BiFeO3. Phys. Rev. B 2012, 85, 144109. 10.1103/PhysRevB.85.144109. [DOI] [Google Scholar]
- Barreda-Argüeso J. A.; Aguado F.; Gonzalez J.; Valiente R.; Nataf L.; Sanz-Ortiz M. N.; Rodríguez F. Crystal-Field Theory Validity Through Local (and Bulk) Compressibilities in CoF2 and KCoF3. J. Phys. Chem. C 2016, 120, 18788–18793. 10.1021/acs.jpcc.6b06132. [DOI] [Google Scholar]
- Rodríguez F.; Hernández D.; Garcia-Jaca J.; Ehrenberg H.; Weitzel H. Optical study of the piezochromic transition in CuMoO4 by pressure spectroscopy. Phys. Rev. B 2000, 61, 16497. 10.1103/PhysRevB.61.16497. [DOI] [Google Scholar]
- Yamamoto T.; Shinagawa K.; Saito T.; Tsushima T. A calculation of electronic states in YBa2Cu3Oy. Jpn. J. Appl. Phys. 1992, 31, L327–L330. 10.1143/JJAP.31.L327. [DOI] [Google Scholar]
- Diaz-Anichtchenko D.; Turnbull R.; Bandiello E.; Anzellini S.; Achary S. N.; Errandonea D. Pressure-induced chemical decomposition of copper orthovanadate (α–Cu3V2O8). J. Mater. Chem. C 2021, 9, 13402–13409. 10.1039/D1TC02901K. [DOI] [Google Scholar]
- Diaz-Anichtchenko D.; Santamaria-Perez D.; Marqueño T.; Pellicer-Porres J.; Ruiz-Fuertes J.; Ribes R.; Ibañez J.; Achary S. N.; Popescu C.; Errandonea D. Comparative study of the high-pressure behavior of ZnV2O6, Zn2V2O7, and Zn3V2O8. J. Alloys Compd. 2020, 837, 155505. 10.1016/j.jallcom.2020.155505. [DOI] [Google Scholar]
- Cliffe M. J.; Goodwin A. L. PASCal: a principal axis strain calculator for thermal expansion and compressibility determination. J. Appl. Crystallogr. 2012, 45, 1321–1329. 10.1107/S0021889812043026. [DOI] [Google Scholar]
- Knight K. S. Analytical expressions to determine the isothermal compressibility tensor and the isobaric thermal expansion tensor for monoclinic crystals: application to determine the direction of maximum compressibility in jadeite. Phys. Chem. Miner. 2010, 37, 529–533. 10.1007/s00269-009-0353-8. [DOI] [Google Scholar]
- Liang A.; Rahman S.; Saqib H.; Rodriguez-Hernandez P.; Munoz A.; Nénert G.; Yousef I.; Popescu C.; Errandonea D. First-Order Isostructural Phase Transition Induced by High Pressure in Fe(IO3)3. J. Phys. Chem. C 2020, 124, 8669–8679. 10.1021/acs.jpcc.0c02080. [DOI] [Google Scholar]
Associated Data
This section collects any data citations, data availability statements, or supplementary materials included in this article.