

Abstract
Background:
Understanding the economics of vaccination is essential to developing immunization strategies that can be employed successfully with limited resources, especially when vaccinating populations that are hard-to-reach.
Methods:
Based on the input from interviews with 24 global experts on immunization economics, we developed a systems map of the mechanisms (i.e., necessary steps or components) involved in vaccination, and associated costs and benefits, focused at the service delivery level. We used this to identify the mechanisms that may be different for hard-to-reach populations.
Results:
The systems map shows different mechanisms that determine whether a person may or may not get vaccinated and the potential health and economic impacts of doing so. The map is divided into two parts: 1) the costs of vaccination, representing each of the mechanisms involved in getting vaccinated (n=23 vaccination mechanisms), their associated direct vaccination costs (n=18 vaccination costs), and opportunity costs (n=5 opportunity costs), 2) the impact of vaccination, representing mechanisms after vaccine delivery (n=13 impact mechanisms), their associated health effects (n=10 health effects for beneficiary and others), and economic benefits (n=13 immediate and secondary economic benefits and costs). Mechanisms that, when interrupted or delayed, can result in populations becoming hard-to-reach include getting vaccines and key stakeholders (e.g., beneficiaries/caregivers, vaccinators) to a vaccination site, as well as vaccine administration at the site.
Conclusion:
Decision-makers can use this systems map to understand where steps in the vaccination process may be interrupted or weak and identify where gaps exist in the understanding of the economics of vaccination. With improved understanding of system-wide effects, this map can help decision-makers inform targeted interventions and policies to increase vaccination coverage in hard-to-reach populations.
Keywords: Vaccination Costs, Systems Map, Hard-To-Reach, Economic Benefits
Introduction
Understanding the economics of vaccination is essential to developing immunization strategies that can be employed successfully with limited resources, especially when vaccinating populations that are hard-to-reach (i.e., those facing supply-side barriers to vaccination, such as geographic barriers or inadequate vaccination systems) [1]. Hard-to-reach populations for vaccination, which include groups sometimes referred to as high-risk, marginalized, zero-dose, or last-mile populations, pose a major obstacle to achieving the goals of the Immunization Agenda 2030 [1, 2]. Decision-makers (e.g., policy makers, public health officials, funders, or healthcare workers) involved in designing vaccination programs or allocating resources to reach these populations need to know the potential costs and benefits of doing so [1–3]. Current economic evaluations of vaccination programs may not capture or quantify all of the types of costs and benefits of an immunization program, which could lead to an underestimation of a program’s total economic impact [1]. Additionally, as the costs and benefits of vaccinating hard-to-reach populations could be quite different from the general population, it is important to identify how these may differ, especially as these could affect program design and resource allocation [4]. A systematic way to identify all of the potential cost and benefit categories and how they are connected may help to fill current gaps and improve the quality of economic evaluations of vaccination.
To identify the potential types of costs and benefits of vaccinating hard-to-reach populations, we developed a systems map of the mechanisms (i.e., necessary steps or components) involved in vaccination, and associated costs and benefits focused at the service delivery level, and used this to identify mechanisms that may be different for hard-to-reach populations. A mechanism is a specific step, component, or factor in a system (e.g., a step in the cause-and-effect pathway). This is different from associations or correlations which suggest how factors may be related based on data, but do not necessarily demonstrate cause-and-effect. In this study, each mechanism represents a step in the process of vaccination. The complex vaccination system is comprised of numerous steps, relationships, resources, and results of interest. By using a systems approach and visualizing all of these, decision-makers can better understand the potential indirect effects and implications of interventions and policies before implementing them in the real world [3]. As there are currently no comprehensive vaccination systems maps applicable across income settings, our team constructed a map based on the input from interviews with immunization experts. This map served as the basis to identify the mechanisms and economic costs involved in vaccination and how these may be different for hard-to-reach populations, which is critical to designing and resourcing immunization programs for these key populations.
Methods
We developed a systems map of the steps involved in an individual or “beneficiary” getting vaccinated, the associated vaccination costs at the service delivery level, and the health and economic impacts of vaccination. To inform the development of the systems map and make the content globally applicable, we conducted interviews and incorporated feedback from a wide array of immunization experts.
Scope of the Systems Map
A systems map is a diagram, typically formed of shapes and words, that visually depicts the processes within a system and how they connect with each other through arrows and spatial orientation. Systems maps are a tool for thinking and communicating, and they illustrate a system of interest by employing a hierarchy of groupings [5]. The boundaries of this systems map focus on the service delivery level, excluding higher-level processes, such as human resources, finances, and policies needed within a health system, although these may impact service delivery. Additionally, this systems map is designed to be applicable across vaccines, vaccine-preventable diseases (VPDs), target populations, and countries. Drawing upon past work of modeling vaccination systems, as well as our preliminary work mapping efficiency metrics specific to vaccine supply chains [6], we identified an initial list of the various components and steps required for an individual to get vaccinated [1, 7–13]. For each mechanism, we included direct costs that are attributable to the vaccination step and the opportunity costs which are a type of indirect cost that represents the loss of potential gains from the next best alternative to taking the vaccination step. Table 1 outlines descriptions and examples of costs, health effects, and benefits of vaccination that we used in the systems map. These descriptions are derived from standard and validated sources in the literature, such as the World Health Organization’s (WHO) guide on economic evaluation of vaccines and the Broader Economic Impact on Vaccines (BEIV) framework [10, 14].
Table 1.
Description and example components of costs, health effects, and benefits of vaccination used in the systems map
| Category | Description and example components |
|---|---|
| Vaccination Costs | |
| Cost of transport for beneficiary/caregiver | Cost of public transport or cost of renting vehicles for beneficiary/caregiver[8] |
| Cost of social mobilization | Salary and/or per diem costs for labor of individuals who mobilize beneficiaries for vaccination (e.g., holding community meetings, events, other sensitization in the community)[8] |
| Cost of Communication Materials | Cost of developing, printing, and advertising materials to inform about vaccination[8, 14] |
| Productivity losses | Productivity losses incurred by beneficiary/caregiver taking time off productive work/chores/school for vaccination[10] |
| Cost of vaccination training | Program and salary costs for personnel who train vaccinators to administer vaccines. Training costs include the cost of venue, per diem for participants, cost of trainers, and reproduction of training materials[8, 14] |
| Cost of vaccinator | Salary costs for vaccinators’ labor[8] |
| Cost of provider incentives | Cost of incentive programs for vaccinators[2, 17] |
| Cost of transport for vaccinator | Cost of vehicle fuel, amortization, and maintenance of transport for vaccinators[57] |
| Cost of cold boxes/carriers | Cost of vaccine containers[8] |
| Cost of vaccines | Cost of purchasing vaccines in vials[8] |
| Cost of transport for vaccines | Cost of vehicle fuel, amortization, and maintenance of vaccines[2, 8] |
| Cost of transport for supplies | Cost of vehicle fuel, amortization, and maintenance of vaccines[2, 8] |
| Cost of supplies | Cost of syringes, vaccine injection and safety supplies[2, 8] |
| Cost of vaccines waste disposal | Cost of vaccine waste disposal systems, including the value of use of incinerators; transportation to and from the incinerator; and operating cost (fuel, maintenance, etc.)[2, 8] |
| Cost to beneficiary/caregiver of vaccination | Out of pocket costs of receiving vaccine incurred by beneficiary/caregiver[8] |
| Cost of vaccination site | Capital or rental cost of health facility or vaccination site, recurrent costs of maintaining the health facility or vaccination site, energy, water, and other utility costs of operating the vaccination site[8] |
| Cost of beneficiary/caregiver incentives | Cost of incentive programs for beneficiary/caregiver[2] |
| Cost of vaccination record-keeping | Salary costs for personnel keeping vaccination records, program/operational cost of vaccination record-keeping systems[8] |
| Opportunity Costs | |
| Travel time of beneficiary/caregiver | Travel time spent by beneficiary, caregiver or vaccinator for vaccination[8, 58] |
| Time of others caring for children/animals | Time spent by other individuals, other than beneficiary/caregiver, including hourly or volunteer labor[10] |
| Time away from productive work/chores/school | Time spent away from wage work, school, household chores, and other non-wage tasks/activities by beneficiaries/caregivers to obtain vaccinations[10] |
| Time of vaccinator to treat other patients | Time spent by vaccinator administering vaccinations instead of treating other patients/performing other duties |
| Opportunity cost of outreach | Opportunity cost of other activities forgone by health system to conduct outreach vaccination activities[8, 57] |
| Health Effects for Individual | |
| Adverse events from vaccination | Cost of adverse events, negative side effects from vaccination[14] |
| Beneficiary has longer lifespan | Beneficiary does not have premature death due to a VPD[14] |
| Beneficiary can develop adequate cognitive function | Beneficiary can develop adequate cognitive function due to averting morbidity or sequelae from a VPD[41] |
| Beneficiary can absorb nutrition | Beneficiary has improved nutrition absorption and cognitive outcomes due to averting morbidity or sequelae from a VPD[42–44] |
| Death averted | Beneficiary does not die from a VPD[10, 14] |
| Disability averted | Beneficiary does not become physically disabled due to a VPD[14, 47] |
| Illness averted | Beneficiary does not become sick from a VPD[47] |
| Health Effects for Others | |
| Distress averted from family illness | Averted costs of psychological impacts of family members having VPDs |
| Control of antimicrobial resistance | Societal benefits from vaccines that reduce the need for antibiotic use; hence, reducing the rate of development of antimicrobial resistance[45, 46] |
| Other people stay healthy | Herd-effect benefit associated with the other people who do not get sick with a VPD as a result of beneficiaries receiving vaccination[48] |
| Health Measures | |
| QALYS gained | Quality-adjusted life years (QALYs) gained from beneficiary not dying or becoming disabled due to VPDs[14] |
| DALYS averted | Disability-adjusted life years (DALYs) gained from beneficiary not dying or becoming disabled due to VPDs[14, 47] |
| Immediate Economic Benefits | |
| Cost of transport for beneficiary/caregiver averted | Averted transport costs from beneficiary/caregiver not having to travel to a health facility due to a VPD[8, 58] |
| Treatment costs averted | Averted treatment costs from beneficiary/caregiver not having to seek treatment for a VPD[14] |
| Hospitalization costs averted | Averted hospitalization costs from beneficiary/caregiver not having to incur hospitalization costs due to a VPD[59] |
| Time away from productive work/chores/school averted | Averted time away from productive work/chores/school by beneficiary/caregiver due to a VPD[14] |
| Time of others caring for children/animals averted | Averted time of others caring for children/animals due to a beneficiary having a VPD[10] |
| Travel time of beneficiary/caregiver averted | Averted travel time by beneficiary/caregiver due to a VPD[14] |
| Secondary Economic Benefits | |
| Demographic dividend | Caregiver and societal benefits from having fewer children due to averted child mortality from VPDs[52] |
| Economic growth | Increase in production of goods and services due to averted productivity losses due to VPDs[53] |
| Equity | Equity benefit of marginalized and vulnerable populations not being burdened by VPDs depending on vaccination strategy; More equal distribution of health outcomes[10] |
| Poverty averted | Beneficiary avoids financial loss and impoverishment from health costs related to a VPD[51] |
| Costs of caring for disabled averted | Averted costs to caregivers caring for individuals disabled due to a VPD[14] |
Selecting an Expert Panel
We contacted 64 experts on immunization economics to provide feedback and information for the systems map. They collectively represented academic institutions (n=35), government and non-governmental organizations, and industry (n=29). To identify experts, we conducted a PubMed search on September 18, 2018, searching the titles and abstracts of papers published from 2008 to 2018, using a combination of the following search terms: “vaccine*” or “immuniz*” or “immunis*” and “cost” or “cost-effectiveness” or “economic*”. We restricted our search to papers published in English and on human-related subjects, yielding 3,838 results. Then we extracted a list of all individual authors, regardless of author order, using a Python software script and ranked authors by their total number of publications. We excluded systematic reviews and commentaries from the overall count of each author’s publications by reviewing the titles and abstracts of publications. As our intent was to identify authors with experience in studying actual vaccination delivery costs to general and hard-to-reach populations, we also excluded studies on hypothetical vaccines, animal vaccination, cost of illness, and epidemiological studies from the overall count of author publications. This resulted in a refined list of 70 authors who had more than five publications on the economic or cost aspects of vaccination, which included two authors of this study. From the remaining 68 authors, we abstracted the institutional affiliations, contact information, and WHO regions represented in the authors’ publications. To ensure breadth of expertise and regional representation, we further excluded nine authors from academic institutions whose publications exclusively focused on a single high-income country. Based on the authors’ institutional affiliations as reported in the papers reviewed, we categorized authors as academic and non-academic experts. Our final sample of experts from our systematic search included 39 academic experts and 17 non-academic experts.
To ensure representation from non-academic organizations not otherwise captured through the systematic search, we augmented the expert sample using a framework of organizations derived from the Institute for Health Metrics and Evaluation (IHME) top 10 institutional channels of development assistance for health (DAH) for the 2008–2017 “vaccine” category [15]. We identified an expert at each of the organization types specified in this framework. Furthermore, expert input from our team members and recommendations from experts who declined to participate helped to identify additional economic experts on immunizations. This strategy yielded an additional 12 contacts for a total of 29 non-academic experts.
From the list of experts identified (39 academic, 29 non-academic), we randomly selected 15 experts each from the academic and non-academic lists (i.e., 30 total) and contacted them via email to request their participation. To account for individuals who did not respond or declined to participate, which was higher among academic experts, we subsequently contacted 34 additional experts (20 academic and 14 non-academic) from those originally identified as the project timeline allowed. In total, twenty-four experts agreed to participate (11 academic and 13 non-academic).
Engaging the Panel and Incorporating Feedback into the Systems Map
To build and verify the map, we attempted to conduct expert consultation interviews with all 24 experts by phone. Between January 31 and March 29, 2019, two interviewers successfully conducted 19 phone interviews and obtained written feedback from five experts who were unable to schedule a phone interview (four academics and one non-academic). Over the phone, one interviewer facilitated the interview by explaining the project and what a systems map is, showing the expert an initial mock-up systems map of the steps of vaccination developed by the study team, prompting feedback on the mechanisms involved in vaccination, and asking verification questions while the other interviewer documented the discussion by typing notes. Examples of verification questions were as follows. “Do you agree with the mapped factors and processes as accurately depicting those involved in vaccination?”, “Are there any mechanisms missing from the map?”, and “Do you have any other feedback on the map?”. When the expert was unable to schedule an interview, we accepted written feedback in lieu of a phone interview on the validation questions.
After compiling notes from the expert interviews and written responses, we organized the feedback into five main categories: costs, benefits, mechanisms, conceptual considerations, and structural considerations. The categories of costs, benefits, and mechanisms correspond directly to the main components of the revised systems map. Proposed changes in these categories involved adding, removing, renaming, or consolidating mechanisms, costs, and/or benefits. Conceptual considerations captured expert suggestions for improving the representation of the key concepts communicated through the map, while structural considerations captured proposed changes to the map design for improved comprehension and readability. Once we compiled and organized all the expert feedback in these categories, we assessed the content through a stepwise process and incorporated the changes (e.g., adding new mechanisms, restructuring) based on our team consensus on conflicting feedback. We shared a revised draft of the systems map at the 2019 International Health Economics Association Congress in Basel, Switzerland [16], and incorporated additional feedback from conference attendees.
Map Analysis: Identifying Mechanisms that Make Populations Hard-to-Reach
After developing the initial map structure and obtaining expert feedback, we identified mechanisms that contribute to individuals being hard-to-reach for vaccination. We referenced the definition of hard-to-reach populations based on our previous literature review, considering the populations who face supply-side barriers to vaccination (e.g., those that are geographically remote, transient, or nomadic), lack healthcare provider recommendations, or those who experience healthcare provider discrimination, inadequate vaccination systems, war and conflict, limited mobility, or legal restrictions [1]. We did not focus on mechanisms that make populations hard-to-vaccinate (e.g., distrust, religious beliefs, lack of awareness of vaccine benefits and recommendations, poverty or low socioeconomic status, lack of time to access available vaccination services, or gender-based discrimination). We then reviewed each mechanism to assess how being disrupted (i.e., broken or not achieved due to bottlenecks, such as high costs) would make an individual or population hard-to-reach according to our definition; thereby, affecting pathways across the broader system.
Results
1. Map Overview
Figure 1 shows the systems map, consisting of two key parts: (1) the costs of vaccination on the left, representing each of the mechanisms involved in getting vaccinated and their associated costs, and (2) the impact of vaccination on the right, representing mechanisms after vaccine delivery and administration and their associated health effects and economic benefits. Since, decision-makers must balance the impact and economic return with costs amidst limited resources, the costs and impacts of vaccination are the two key components used in economic evaluations of vaccinations. While the mechanisms involved in getting people vaccinated and the impact of vaccination are separated in the map, these distinctions do not necessarily fully hold since process on both sides can affect each other. For example, vaccination can reduce the incidence of disease which can reduce stress on the health system and increase time and availability of healthcare personnel to provide vaccinations.
Figure 1.
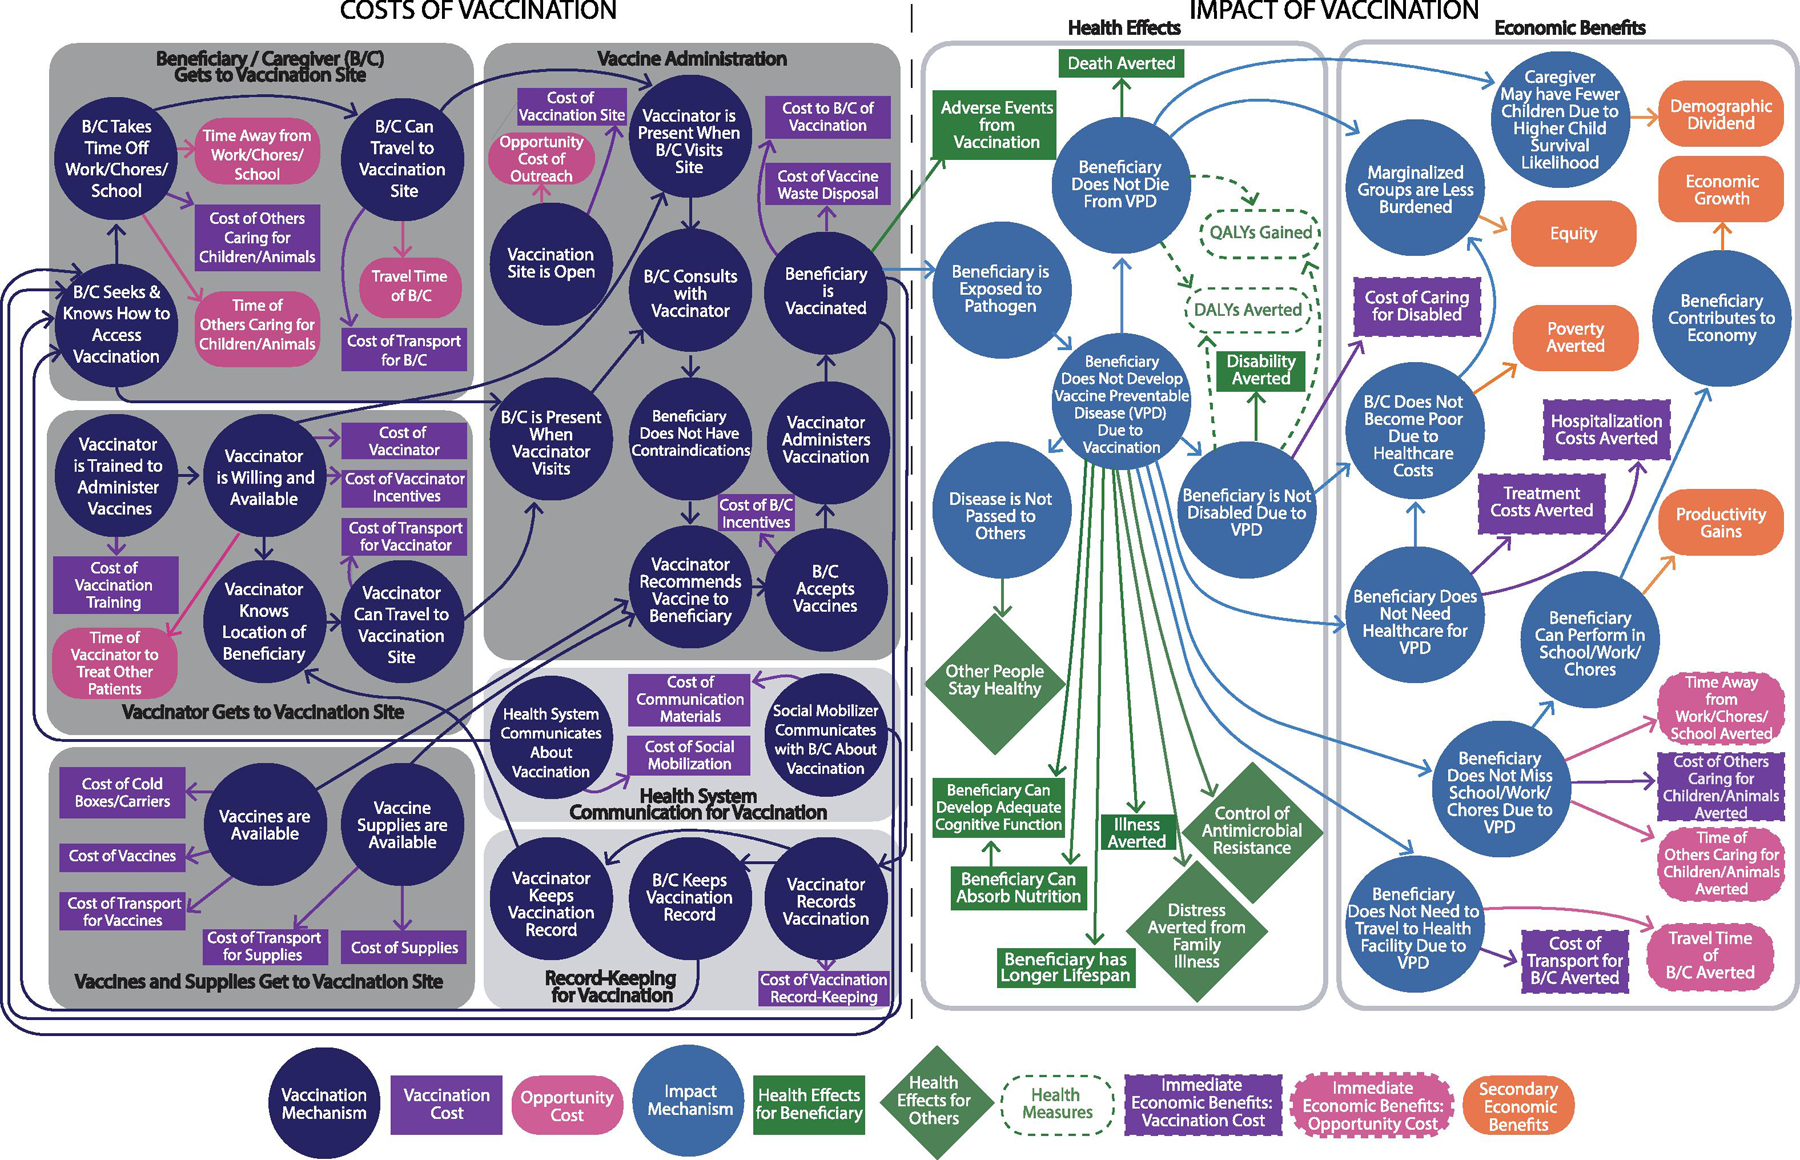
Systems map of vaccination costs and economic impact
The map starts on the left side where it is sub-divided into six sections, delineated by gray boxes, each representing a different aspect for an individual to get vaccinated. The four required steps (represented by dark gray boxes) are that: (1) beneficiaries/caregivers, (2) vaccinators, and (3) vaccines and supplies are all present, and (4) a vaccination location is open and functioning to allow for vaccine administration. Further, two light gray boxes represent supporting aspects of this process: (5) health system communication for vaccination, and (6) record-keeping for vaccination. Within these sections, each dark blue circle represents a specific mechanism, or step on the pathway, for an individual to get vaccinated. Stemming from each dark blue circle, purple and pink boxes indicate the cost of vaccination and the opportunity costs that can be associated with each mechanism, respectively. Table 2 provides examples of how disrupting these mechanisms may make an individual or population hard-to-reach.
Table 2.
Examples of How Disrupting Vaccination Mechanisms Can Make Populations Hard-to-Reach
| Vaccination Mechanism | Examples of Potential Disruptions |
|---|---|
| 2.1 Beneficiary/Caregiver (B/C) Gets to Vaccination Site | |
| B/C Seeks & Knows How to Access Vaccination | • Transient or displaced populations may not be aware of where vaccination sites are located [1]. • Certain populations may be dissuaded from seeking vaccination due to discrimination or ill-treatment. |
| B/C Takes Time Off Work/Chores/School | • Geographically remote populations or those in areas with poor access to public transit may need to take more time off the job, care responsibilities, or school to travel to vaccination site. |
| B/C Can Travel to Vaccination Site | • Populations may face disruptions in traveling to a vaccination location (e.g., geographic distance, difficult terrain, weather or climate, war and conflict). • Populations with mobility limitations (e.g., homebound) may be prevented from getting to vaccination sites [60]. |
| 2.2 Vaccinator Gets to Vaccination Site | |
| Vaccinator is Trained to Administer Vaccines | • Vaccinators located in areas displaced by war and conflict may have increased training costs to adhere to legal restrictions, ensure compliance and/or safety (e.g., added security), or provide incentives to vaccinators to take on risks. |
| Vaccinator is Willing and Available | • Vaccinators in areas with less developed healthcare systems may be overworked and, therefore, less willing or available to perform vaccination services regularly. |
| Vaccinator Knows Location of Beneficiary | • Even if a vaccinator is willing and able to vaccinate, they may now know the location of the site or individual, particularly for remote populations requiring outreach or transient populations (costs discussed in Section 2.6). |
| Vaccinator Can Travel to Vaccination Site | • Vaccinators may incur higher travel costs to reach certain hard-to-reach populations (e.g., outreach to geographically remote and transient populations or those in conflict zones). |
| 2.3 Vaccines and Supplies Get to Vaccination Site | |
| Vaccines are Available | • Populations may face reduced access to vaccines due to greater strains on the cold chain to deliver to geographically remote locations or in war/conflict zones. |
| Vaccine Supplies are Available | • Underdeveloped supply chain systems in geographically remote areas or areas of conflict may also prevent vaccine supplies (e.g., syringes) from being available at the vaccination location. |
| 2.4 Vaccine Administration | |
| Vaccination Site is Open | • Certain populations, such as those in remote areas or in urban slums, may only have access to facilities which are rarely open due to a lack of resources, accountability, motivation, and/or lack of access (e.g., due to extreme weather or terrain). |
| Vaccinator Recommends Vaccine to Beneficiary | • Certain populations are at increased risk of not receiving vaccines at the administration site, due to healthcare provider discrimination, lack of healthcare provider recommendations, and other barriers, such as legal restrictions or restrictive vial-opening threshold policies [19, 39, 40]. |
| B/C Consults with Vaccinator | • Those who have experienced previous healthcare provider discrimination may be hesitant to consult with vaccinator. |
| 2.5 Health System Communication for Vaccination | |
| Health System Communicates About Vaccination | • Health systems may not be able to communicate about where and when to get vaccinated to transient populations or those displaced by war or conflict. |
| • Those with mobility limitations may not venture to public locations as frequently as others and miss vaccination campaign messaging around upcoming vaccination campaigns. | |
| Social Mobilizer Communicates with B/C About Vaccination | • In war and conflict zones, for example, recruitment of social mobilizers may be challenging due to potential risks involved in traveling to and leading health promotion in dangerous locations. This can result in increased social mobilization and communication costs. Populations become even harder to reach if costs are not paid and social mobilization does not occur because beneficiaries and caregivers may not seek or know how to access vaccination. |
| 2.6 Record-Keeping for Vaccination | |
| Vaccinator Records Vaccination | • Record-keeping is needed to know who the zero-dose (i.e., hard-to-reach) communities are but when that is unknown then delivery can be disrupted to these communities. |
| B/C Keeps Vaccination Record | • Transient or displace populations, as well as those in conflict zones, may be less likely to maintain physical documentation of past vaccinations. |
| Vaccinator Keeps Vaccination Record | • Poor records could result in additional costs to identify and track hard-to-reach populations (e.g., door-to-door campaigns for polio eradication) [61]. |
B/C = Beneficiary/Caregiver
Once a beneficiary is vaccinated (as shown on the left side of the map), they will proceed to the right side of the map, which details the impact of vaccination and is further sub-divided into two sections: (1) health effects, and (2) economic benefits of vaccination. Light blue circles on the right side of the map represent the impact mechanisms or steps after vaccination that result in health and economic benefits. Within the health effects section, green rectangles represent the health benefits to the individual vaccinated, while green diamonds represent benefits to others. Within the economic benefits section, purple and pink rectangles represent the immediate economic benefits from cost savings in direct and opportunity costs, respectively, while the orange rectangles represent secondary or downstream economic benefits.
2. Representing Costs of Vaccination and Identifying Mechanisms that Make Individuals Hard-to-Reach
As the systems map shows, we found 23 mechanisms for a beneficiary to get vaccinated, along with associated direct (n=18) and opportunity (n=5) costs (Figure 1). The map begins with a beneficiary (and caregiver if needed), vaccinator, and vaccines all arriving at an immunization site as shown in the three sections on the far-left panel of the map.
2.1. Beneficiary/Caregiver Gets to Vaccination Site
Beginning in the top left corner, individual beneficiaries and their caregivers must first seek and know how to access vaccination, be able to take time off from responsibilities, and have the ability to travel to a vaccination site. The map shows the costs that are associated with the beneficiary and caregiver getting to the vaccination site. Of the five opportunity costs associated with vaccination, three are incurred by the beneficiary and caregiver when seeking vaccination (i.e., travel time, taking time away from work, chores, and/or school, and time of other caregivers caring for children and/or animals to travel to a vaccination site). Meanwhile, the costs associated with an individual seeking and knowing when and where to get vaccinated often fall largely on the health system (See Section 2.4, 2.5).
Each of these mechanisms illustrated on the map, when interrupted or delayed, can result in a person or population becoming hard-to-reach, which may make vaccination more time-consuming and costly compared to if the population is not hard-to-reach. For example, disruptions in traveling to a vaccination location (e.g., geographic distance, difficult terrain, weather or climate, war and conflict) can make individuals harder to reach for vaccination (Table 2) [1]. Since disrupting these mechanisms can result in a beneficiary not getting vaccinated, these mechanisms serve as gatekeepers (i.e., steps that prevent access) for an individual to get vaccinated and result in populations that are hard-to-reach. Furthermore, these mechanisms can increase associated costs and magnify demand-side mechanisms that can impact vaccination uptake (e.g., lack of time away from work, chores, school).
2.2. Vaccinator Gets to Vaccination Site
Directly below the beneficiaries/caregivers box is the section of the systems map that represents the vaccinator getting to the vaccination site. Four sequential steps (vaccinator training, participation, knowledge, and ability to travel) must occur for a vaccinator to get to a vaccination site. Costs associated with these steps include hiring, training, transporting, and incentivizing a vaccinator, in addition to the indirect opportunity cost of time lost to not be able to treat other patients [17]. Mechanisms that may be bottlenecks for vaccinators include insufficient funding to pay for training, salaries, and travel to vaccination sites, which may lead to understaffing or delayed training. The disruption of each of these mechanisms may cause populations to become hard-to-reach (Table 2).
2.3. Vaccines and Supplies Get to Vaccination Site
In the bottom left corner of the map is the third section, vaccines and supplies (e.g., syringes and cold boxes) getting to the vaccination site. There are five direct vaccination costs associated with vaccines and supplies getting to and being available at a vaccination site, including costs of cold chain and transport [2, 8]. The arrival of vaccines and supplies at a site directly influences whether a vaccinator can recommend the vaccine, which is visible in the map through the two outgoing arrows to vaccine administration. The mechanisms and costs associated with vaccine procurement and supply chains are particularly vulnerable to disruptions due to geography by distance or terrain, inadequate vaccination systems (e.g., lack of cold chain system), and transient or nomadic movement [18–38] (Table 2).
2.4. Vaccine Administration
Located in the middle left-side of the map, vaccine administration is dependent on beneficiaries, vaccinators, and vaccines and supplies all being present at an open and operational vaccination site. Vaccination counseling and recommendation are central intermediary steps in this process. Prior vaccination experience can also influence whether a beneficiary/caregiver seeks or knows how to access vaccination in the future. Direct costs include costs of the vaccination site, vaccine waste disposal, out-of-pocket costs that beneficiaries or caregivers may incur at the vaccination site, and beneficiary incentives [2, 8]. There is also an opportunity cost of outreach when the same resources could be spent delivering routine healthcare services. As the map shows, there are relatively fewer costs than mechanisms involved with vaccine administration, indicating that the majority of cost burden may be on ensuring the essential components get to a site rather than the vaccination taking place at a site. From the demand-side, this includes ensuring that beneficiaries, caregivers, and vaccinators are motivated to get to the site and be immunized. Hard-to-reach populations may have limited access or be at increased risk of not receiving vaccines at the administration site (Table 2) [39, 40].
2.5. Health System Communication for Vaccination
As mentioned in Section 2.1, health system communication for vaccination influences whether a beneficiary seeks or knows how to access vaccination, and therefore serves as a supporting factor to vaccination, as indicated by the light grey box. While communication from health systems and social mobilizers both result in costs [8], they can increase an individual’s knowledge of the availability and location of vaccination sites, resulting in increased vaccine coverage. Populations may face greater barriers to receiving health information if they are less connected to or do not reside within reasonable proximity to a health system, making them hard-to-reach (Table 2).
2.6. Record-Keeping for Vaccination
Record-keeping, similar to health system communication, is a supporting component for vaccination. Maintaining immunization records is important as it can help individuals and/or vaccinators know when vaccination is needed and may ultimately increase vaccination coverage [8]. For example, record-keeping can serve as an important tool for counting and identifying hard-to-reach populations; however, efforts can be complicated by transient or nomadic movement or weak health systems (Table 2). As one expert noted, while immunization program managers typically know these populations exist, they are not always accounted for in national coverage data and planning.
3. Representing the Health and Economic Benefits of Vaccination
The vaccination of an individual is the mechanism that links together the two halves of the systems map, connecting the cost of vaccination to resulting health and economic impacts.
3.1. Health Effects
The right side of the map begins with an individual (i.e., beneficiary) being exposed to a VPD-causing pathogen after vaccination. If the beneficiary is vaccinated but is not exposed to the pathogen or does not mount an immune response (e.g., due to low vaccine efficacy or immunocompromised individual), none of the resulting health effects and economic benefits will materialize. However, if a beneficiary is exposed to the pathogen, vaccination can prevent the beneficiary from developing the VPD or may help the beneficiary develop a less severe form of the VPD. This can lead to a number of direct health effects (n=6), including the potential to improve nutrition, cognitive function, and lifespan, as well as the aversion of family distress [41–44]. Furthermore, if a vaccinated individual does not develop a VPD, they will not need treatment; thus, potentially minimizing their contribution to antimicrobial resistance in a population [45, 46]. By preventing infection and disease, vaccines avert both short- and long-term disability and death which are captured in health measures, such as quality-adjusted life-years (QALYs) gained and disability-adjusted life-years (DALYs) averted (Table 1) [10, 14, 47]. Vaccinated individuals can also indirectly keep others healthy by reducing the spread of VPDs, further averting additional health effects and costs [48]. However, it is also important to consider the potential adverse events that stem from vaccination [14].
The positive health effects of vaccination may be different for hard-to-reach populations. For example, hard-to-reach populations may have a higher burden of certain VPDs because of poor vaccination coverage compared to populations that are not hard-to-reach [49]. Additionally, hard-to-reach populations may be at a greater risk of negative sequelae of VPDs due to limited healthcare access, and socioeconomic and racial disparities [50]. Hard-to-reach populations may also have different underlying health status (e.g., nutrition) and lack of access to other services (e.g., clean water, sanitation) which may result in a different vaccination impact (e.g., vaccine effectiveness in malnourished populations).
3.2. Economic Benefits
The far-right panel of the systems map is comprised of economic benefits, directly stemming from the three health impact mechanisms of an individual not developing a VPD, disability, or dying. Protecting an individual from illness can prevent lost time and costs associated with additional healthcare utilization and/or productivity from missed school, work, and/or chores. This results in the most immediate economic benefits, including averting travel and caregiving costs, in addition to increased workforce productivity and ability to generate income (i.e., downstream productivity gains) [10, 11, 14]. Vaccinated individuals may also avert healthcare costs and impoverishment due to financial loss [51]. Broader benefits to society may include greater equity from vaccinating marginalized groups [10]. Additionally, preventing childhood deaths may result in secondary economic benefits and growth potential due to a shifting age structure where caregivers may have fewer children due to higher likelihood of child survival (i.e., resulting in a demographic dividend); thus, increasing both the investment per child and the population able to work, or decreasing the dependency ratio [52, 53].
The economic benefit of vaccination may be different for hard-to-reach populations as compared to populations that are not hard-to-reach. For example, because hard-to-reach populations may be poorer, marginalized, and have less access to healthcare in general, averting healthcare costs through vaccination may lead to greater financial protection and societal equity effects [54–56]. Additionally, immunizing largely unvaccinated populations may provide much larger gains in life expectancy compared to populations that are not hard-to-reach, further improving equity for hard-to-reach populations. However, the impact of vaccination may vary depending on the underlying health status of a population or other factors (e.g., nutrition may impact immunization efficacy; populations with less access to health care may experience an increase in health care costs).
Discussion
The systems map we developed through iterative input from immunization experts can serve as a blueprint for visualizing the complex steps involved in vaccination and their associated costs, while helping to identify the particular steps that may be more challenging to overcome for populations that are hard-to-reach. Using this systems map, decision-makers can consider where mechanisms may be disrupted or weak, leading to challenges in vaccination and making populations hard-to-reach, and see the possible health and economic effects throughout the entire system. Insights from systems maps could be especially valuable in designing interventions that improve vaccination coverage and the allocation of finite resources. Decision-makers, such as policy makers, public health officials, funders, or healthcare workers can use this map to consider costs to both beneficiaries and the immunization program at the service delivery level, pinpoint where additional economic data are needed, and identify where funding may be allocated to make the greatest impact.
This systems map comprehensively shows what the potential downstream effects of vaccination are and how they interrelate and connect. To our knowledge, this is the first, single diagram of vaccine delivery costs at the service delivery level from both beneficiary and program perspectives. The color-coding of the map provides decision-makers with a visual representation of costs on each side of the cost-benefit analysis. Additionally, the application of this systems map to hard-to-reach populations is novel, and future research could involve its application to other population groups (e.g., hard-to-vaccinate groups). The number of mechanisms identified suggests that, in any country context, the vaccination system is complex and that there are many aspects of vaccination that need to be considered when costing out immunization programs and when planning to reach hard-to-reach populations. As demonstrated, mechanisms that serve as potential bottlenecks in reaching populations that are to hard-to-reach involve getting vaccines and key stakeholders (e.g., beneficiaries/caregivers and vaccinators) to a vaccination site, as well as vaccine administration. Although applied here the example of hard-to-reach populations, the systems map could also be applied to other sub-populations including hard-to-vaccinate populations that may face demand-side barriers even when vaccination services are more readily available.
There are multiple reasons to show the mechanisms by which vaccination occurs, rather than focus on associations between one aspect of vaccination and the effects of vaccination. First, understanding each of the specific steps will be useful to accurately cost out an entire vaccination program. Filling gaps in economic parameters specific to these mechanisms will require studies on the costs of each mechanism and any comparative costs between the general population and hard-to-reach populations. For example, further investigation on differences in costs for vaccinators in hard-to-reach populations, such as training, transport, and incentives, is warranted. Future research can utilize the systems map to dive deeper into each specific mechanism, with targeted systematic reviews to identify what is known and not known about these mechanisms and their associated costs and benefits. Highlighting the specific mechanisms that are potential points of disruption can help focus efforts to improve vaccine access for hard-to-reach populations. For example, by representing the mechanistic pathway by which people access a vaccination site, program managers may recognize that the breakdown in this process is due to a lack of communication about vaccination, which could disrupt an individual’s knowledge of where or when to get vaccinated. Additionally, this systems map can serve as a starting point for development of mechanistic systems models representing the components, processes, and costs of vaccination to assess the impact of bottlenecks and the investments required to resolve them. These models could be used to identify strategies to increase vaccine access for hard-to-reach populations and quantify the potential costs and clinical and economic benefit of these strategies. Understanding which costs may be different for specific hard-to-reach groups, how much they cost, and potential resulting equity benefits will shape the ongoing conversation about the resources needed and the value of improving vaccination in hard-to-reach populations.
Limitations
A systems map, like any model, is a simplification of real-life; therefore, it may not capture all influences or effects. While our systems map attempts to identify most of the important factors involved in vaccination and the associated costs, some mechanisms may have been missed. Additionally, systems maps lack quantitative data that can be used to describe the magnitude of the connections and relationships. For example, some mapped outcomes, such as poverty, are multi-factorial, and vaccination is just one potential contributor of many. The systems map does not demonstrate which linkages are more important than others, or which costs or benefits are comparatively greater, and these may vary by context. Systems maps may also have limited predictive value in a free-standing application and rely on contextual knowledge for general understanding [5]. Our systems map is intentionally generic to be relevant across vaccines, populations, and countries; however, specific contexts may influence the importance of each mechanism, cost, and benefit. Our map and findings are based on interviews and resulting feedback from selected experts whom we identified systematically but may not represent the opinions of all potential experts.
Conclusion
This systems map shows the different mechanisms that determine whether or not an individual gets vaccinated and the potential health and economic impacts. Decision-makers can utilize this systems map to understand where vaccination processes may be interrupted or weak and identify where gaps exist in the understanding of the economics of vaccination. By illustrating system-wide effects, this map can help decision-makers inform targeted interventions and policies to increase vaccination coverage in hard-to-reach populations.
Acknowledgements
We thank the immunization economic experts for their time and valuable feedback.
Funding
Research reported in this publication was supported by the Centers for Disease Control and Prevention (CDC) via contract 5 NU2GGH002000–02-00, the Agency for Healthcare Research and Quality (AHRQ) via grant R01HS023317, the Eunice Kennedy Shriver National Institute of Child Health and Human Development (NICHD) Office of Behavioral and Social Sciences Research (OBSSR) via grant U01HD086861, and by National Institute of General Medical Sciences (NIGMS) as part of the Models of Infectious Disease Agent Study (MIDAS) network under grant R01 GM127512. While CDC staff contributed in their individual capacity as authors, the funders had no role in the design and conduct of the study; collection, management, analysis, and interpretation of the data; and preparation, review, or approval of the manuscript.
Footnotes
Publisher's Disclaimer: This is a PDF file of an unedited manuscript that has been accepted for publication. As a service to our customers we are providing this early version of the manuscript. The manuscript will undergo copyediting, typesetting, and review of the resulting proof before it is published in its final form. Please note that during the production process errors may be discovered which could affect the content, and all legal disclaimers that apply to the journal pertain.
Disclaimer: The findings in this manuscript are the views of the authors and do not represent the official position of the U.S. Centers for Disease Control and Prevention.
References
- [1].Ozawa S, Yemeke TT, Evans DR, Pallas SE, Wallace AS, Lee BY. Defining hard-to-reach populations for vaccination. Vaccine 2019;37:5525–34. [DOI] [PMC free article] [PubMed] [Google Scholar]
- [2].World Health Organization and Others. (2020). Immunization Agenda 2030: A Global Strategy to Leave No One Behind. Draft 4 https://www.who.int/immunization/immunization_agenda_2030/en/.
- [3].Lee BY, Mueller LE, Tilchin CG. A systems approach to vaccine decision making. Vaccine 2017;35 Suppl 1:A36–A42. [DOI] [PMC free article] [PubMed] [Google Scholar]
- [4].Munk C, Portnoy A, Suharlim C, Clarke-Deelder E, Brenzel L, Resch SC, et al. Systematic review of the costs and effectiveness of interventions to increase infant vaccination coverage in low- and middle-income countries. BMC Health Serv Res 2019;19:741. [DOI] [PMC free article] [PubMed] [Google Scholar]
- [5].USAID. SPACES MERL Systems and Complexity White Paper 2016.
- [6].Haidari LA, Brown ST, Wedlock P, Lee BY. Map of different vaccine supply chain efficiency measures. Vaccine 2017;35:199–200. [DOI] [PMC free article] [PubMed] [Google Scholar]
- [7].Haidari LA, Brown ST, Constenla D, Zenkov E, Ferguson M, de Broucker G, et al. Geospatial Planning and the Resulting Economic Impact of Human Papillomavirus Vaccine Introduction in Mozambique. Sex Transm Dis 2017;44:222–6. [DOI] [PMC free article] [PubMed] [Google Scholar]
- [8].Immunization Economics Community of Practice. (2019). How to cost immunization programs: a practical guide on primary data collection and analysis
- [9].Deogaonkar R, Hutubessy R, van der Putten I, Evers S, Jit M. Systematic review of studies evaluating the broader economic impact of vaccination in low and middle income countries. BMC Public Health 2012;12:878. [DOI] [PMC free article] [PubMed] [Google Scholar]
- [10].World Health Organization. (2012). Report on the WHO consultation on the broader economic impact on vaccines and immunization programmes (BEIVIP)
- [11].Reaching Every District (RED), 2017 revision Brazzaville: World Health Organization; 2017. [Google Scholar]
- [12].World Health Organization. (2017). A guide for conducting an Expanded Programme on Immunization (EPI) review World Health Organization. https://apps.who.int/iris/handle/10665/259960. License: CC BY-NC-SA 3.0 IGO. [Google Scholar]
- [13].Phillips DE, Dieleman JL, Shearer JC, Lim SS. Childhood vaccines in Uganda and Zambia: Determinants and barriers to vaccine coverage. Vaccine 2018;36:4236–44. [DOI] [PubMed] [Google Scholar]
- [14].World Health Organization. (2008). WHO guide for standardization of economic evaluations of immunization programmes
- [15].Institute for Health Metrics and Evaluation (IHME) Seattle: 2019. [Google Scholar]
- [16].Ozawa S Hard to Reach Populations: A Systems Mapping Approach to Bridging the Gaps for Vaccination International Health Economics Association Congress. Basel, Switzerland: 2019. [Google Scholar]
- [17].Buykx PHJ, Wakerman J, Pashen D. Systematic review of effective retention incentives for health workers in rural and remote areas: towards evidence-based policy. Aust J Rural Health 2010;18(3):102–109. doi: 10.1111/j.1440-1584.2010.01139.x. [DOI] [PubMed] [Google Scholar]
- [18].Wedlock PT, Mitgang EA, Haidari LA, Prosser W, Brown ST, Krudwig K, et al. The value of tailoring vial sizes to populations and locations. Vaccine 2019;37:637–44. [DOI] [PMC free article] [PubMed] [Google Scholar]
- [19].Wedlock PT, Mitgang EA, Oron AP, Hagedorn BL, Leonard J, Brown ST, et al. Modeling the economic impact of different vial-opening thresholds for measles-containing vaccines. Vaccine 2019;37:2356–68. [DOI] [PMC free article] [PubMed] [Google Scholar]
- [20].Wedlock PT, Mitgang EA, Elsheikh F, Leonard J, Bakal J, Welling J, et al. The potential effects of introducing microneedle patch vaccines into routine vaccine supply chains. Vaccine 2019;37:645–51. [DOI] [PMC free article] [PubMed] [Google Scholar]
- [21].Lee BY, Wedlock PT, Haidari LA, Elder K, Potet J, Manring R, et al. Economic impact of thermostable vaccines. Vaccine 2017;35:3135–42. [DOI] [PMC free article] [PubMed] [Google Scholar]
- [22].Wedlock PT, Mitgang EA, Siegmund SS, DePasse J, Bakal J, Leonard J, et al. Dual-chamber injection device for measles-rubella vaccine: The potential impact of introducing varying sizes of the devices in 3 countries. Vaccine 2018;36:5879–85. [DOI] [PMC free article] [PubMed] [Google Scholar]
- [23].Haidari LA, Brown ST, Wedlock P, Connor DL, Spiker M, Lee BY. When are solar refrigerators less costly than on-grid refrigerators: A simulation modeling study. Vaccine 2017;35:2224–8. [DOI] [PMC free article] [PubMed] [Google Scholar]
- [24].Lee BY, Haidari LA, Prosser W, Connor DL, Bechtel R, Dipuve A, et al. Re-designing the Mozambique vaccine supply chain to improve access to vaccines. Vaccine 2016;34:4998–5004. [DOI] [PMC free article] [PubMed] [Google Scholar]
- [25].Haidari LA, Brown ST, Ferguson M, Bancroft E, Spiker M, Wilcox A, et al. The economic and operational value of using drones to transport vaccines. Vaccine 2016;34:4062–7. [DOI] [PMC free article] [PubMed] [Google Scholar]
- [26].Mueller LE, Haidari LA, Wateska AR, Phillips RJ, Schmitz MM, Connor DL, et al. The impact of implementing a demand forecasting system into a low-income country’s supply chain. Vaccine 2016;34:3663–9. [DOI] [PMC free article] [PubMed] [Google Scholar]
- [27].Lee BY, Connor DL, Wateska AR, Norman BA, Rajgopal J, Cakouros BE, et al. Landscaping the structures of GAVI country vaccine supply chains and testing the effects of radical redesign. Vaccine 2015;33:4451–8. [DOI] [PubMed] [Google Scholar]
- [28].Haidari LA, Wahl B, Brown ST, Privor-Dumm L, Wallman-Stokes C, Gorham K, et al. One size does not fit all: The impact of primary vaccine container size on vaccine distribution and delivery. Vaccine 2015;33:3242–7. [DOI] [PMC free article] [PubMed] [Google Scholar]
- [29].Portnoy A, Ozawa S, Grewal S, Norman BA, Rajgopal J, Gorham KM, et al. Costs of vaccine programs across 94 low- and middle-income countries. Vaccine 2015;33 Suppl 1:A99–108. [DOI] [PubMed] [Google Scholar]
- [30].Brown ST, Schreiber B, Cakouros BE, Wateska AR, Dicko HM, Connor DL, et al. The benefits of redesigning Benin’s vaccine supply chain. Vaccine 2014;32:4097–103. [DOI] [PubMed] [Google Scholar]
- [31].Haidari LA, Connor DL, Wateska AR, Brown ST, Mueller LE, Norman BA, et al. Augmenting transport versus increasing cold storage to improve vaccine supply chains. PLoS One 2013;8:e64303. [DOI] [PMC free article] [PubMed] [Google Scholar]
- [32].Assi T-M, Brown ST, Kone S, Norman BA, Djibo A, Connor DL, et al. Removing the regional level from the Niger vaccine supply chain. Vaccine 2013;31:2828–34. [DOI] [PMC free article] [PubMed] [Google Scholar]
- [33].Haidari LA, Connor DL, Wateska AR, Brown ST, Mueller LE, Norman BA, et al. Only adding stationary storage to vaccine supply chains may create and worsen transport bottlenecks. J Public Health Manag Pract 2013;19 Suppl 2:S65–7. [DOI] [PMC free article] [PubMed] [Google Scholar]
- [34].Lee BY, Cakouros BE, Assi T-M, Connor DL, Welling J, Kone S, et al. The impact of making vaccines thermostable in Niger’s vaccine supply chain. Vaccine 2012;30:5637–43. [DOI] [PMC free article] [PubMed] [Google Scholar]
- [35].Lee BY, Assi T-M, Rajgopal J, Norman BA, Chen S-I, Brown ST, et al. Impact of introducing the pneumococcal and rotavirus vaccines into the routine immunization program in Niger. Am J Public Health 2012;102:269–76. [DOI] [PMC free article] [PubMed] [Google Scholar]
- [36].Lee BY, Assi T-M, Rookkapan K, Connor DL, Rajgopal J, Sornsrivichai V, et al. Replacing the measles ten-dose vaccine presentation with the single-dose presentation in Thailand. Vaccine 2011;29:3811–7. [DOI] [PMC free article] [PubMed] [Google Scholar]
- [37].Lee BY, Assi T-M, Rookkapan K, Wateska AR, Rajgopal J, Sornsrivichai V, et al. Maintaining vaccine delivery following the introduction of the rotavirus and pneumococcal vaccines in Thailand. PLoS One 2011;6:e24673. [DOI] [PMC free article] [PubMed] [Google Scholar]
- [38].Assi T-M, Brown ST, Djibo A, Norman BA, Rajgopal J, Welling JS, et al. Impact of changing the measles vaccine vial size on Niger’s vaccine supply chain: a computational model. BMC Public Health 2011;11. [DOI] [PMC free article] [PubMed] [Google Scholar]
- [39].Pearson WS, Zhao G, Ford ES. An Analysis of Language as a Barrier to Receiving Influenza Vaccinations among an Elderly Hispanic Population in the United States. Adv Prev Med 2011;2011:298787. [DOI] [PMC free article] [PubMed] [Google Scholar]
- [40].Malande OO, Munube D, Afaayo RN, Annet K, Bodo B, Bakainaga A, et al. Barriers to effective uptake and provision of immunization in a rural district in Uganda. PLoS One 2019;14:e0212270. [DOI] [PMC free article] [PubMed] [Google Scholar]
- [41].Bloom DE, Canning D, and Shenoy ES, The effect of vaccination on children’s physical and cognitive development in the Philippines. Appl. Econ, 2011. 44(21): p. 2777–2783. [Google Scholar]
- [42].Anekwe TD and Kumar S, The effect of a vaccination program on child anthropometry: evidence from India’s Universal Immunization Program. J. Public Health, 2012. 34(4): p. 489–497. [DOI] [PubMed] [Google Scholar]
- [43].Katz J, et al. , Nutritional status of infants at six months of age following maternal influenza immunization: A randomized placebo-controlled trial in rural Nepal. Vaccine, 2017. 35(48 Pt B): p. 6743–6750. [DOI] [PMC free article] [PubMed] [Google Scholar]
- [44].De Vita MV, et al. , Malnutrition, morbidity and infection in the informal settlements of Nairobi, Kenya: an epidemiological study. Ital. J. Pediatr, 2019. 45(1): p. 12. [DOI] [PMC free article] [PubMed] [Google Scholar]
- [45].Bloom DE, et al. , Antimicrobial resistance and the role of vaccines. Proceedings of the National Academy of Sciences, 2018. 115(51): p. 12868–12871. [DOI] [PMC free article] [PubMed] [Google Scholar]
- [46].Hennessy TW, et al. , Impact of heptavalent pneumococcal conjugate vaccine on invasive disease, antimicrobial resistance and colonization in Alaska Natives: progress towards elimination of a health disparity. Vaccine, 2005. 23(48–49): p. 5464–5473. [DOI] [PubMed] [Google Scholar]
- [47].Gargano LMHR, Cookson ST. Pneumonia prevention: Cost-effectiveness analyses of two vaccines among refugee children aged under two years, Haemophilus influenzae type b-containing and pneumococcal conjugate vaccines, during a humanitarian emergency, Yida camp, South Sudan. Vaccine 2017;35(3):435–442. doi: 10.1016/j.vaccine.2016.11.070. [DOI] [PMC free article] [PubMed] [Google Scholar]
- [48].Benjamin-Chung J, Abedin J, Berger D, Clark A, Jimenez V, Konagaya E, Tran D, Arnold BF, Hubbard AE, Luby SP, Miguel E, & Colford JM (2019). Spillover effects on health outcomes in low- and middle-income countries: a systematic review. International journal of epidemiology, 48(4), 1387. 10.1093/ije/dyz111. [DOI] [PMC free article] [PubMed] [Google Scholar]
- [49].Gracey MaMK. Indigenous health part 1: determinants and disease patterns. The Lancet 2009; 374:65–75. [DOI] [PubMed] [Google Scholar]
- [50].Chu SY, Barker LE, & Smith PJ (2004). Racial/ethnic disparities in preschool immunizations: United States, 1996–2001. American journal of public health, 94(6), 973–977. 10.2105/ajph.94.6.973. [DOI] [PMC free article] [PubMed] [Google Scholar]
- [51].Chang AY, Riumallo-Herl C, Perales NA, Clark S, Clark A, Constenla D, et al. The Equity Impact Vaccines May Have On Averting Deaths And Medical Impoverishment In Developing Countries. Health Aff (Millwood) 2018;37:316–24. [DOI] [PubMed] [Google Scholar]
- [52].United-Nations-Population-Fund. Demographic dividend 2020.
- [53].Quilici S, Smith R, Signorelli C. Role of vaccination in economic growth. J Mark Access Health Policy 2015;3. [DOI] [PMC free article] [PubMed]
- [54].Bosch-Capblanch X, Zuske M-K, and Auer C, Research on subgroups is not research on equity attributes: Evidence from an overview of systematic reviews on vaccination. Int. J. Equity Health, 2017. 16(1): p. 95. [DOI] [PMC free article] [PubMed] [Google Scholar]
- [55].Arsenault C, et al. , An equity dashboard to monitor vaccination coverage. Bull. World Health Organ, 2017. 95(2): p. 128–134. [DOI] [PMC free article] [PubMed] [Google Scholar]
- [56].Boujaoude M-A, et al. , Accounting for equity considerations in cost-effectiveness analysis: a systematic review of rotavirus vaccine in low- and middle-income countries. Cost Effectiveness and Resource Allocation, 2018. 16(1). [DOI] [PMC free article] [PubMed] [Google Scholar]
- [57].Janusz CB, Castaneda-Orjuela C, Molina Aguilera IB, Felix Garcia AG, Mendoza L, Diaz IY, et al. Examining the cost of delivering routine immunization in Honduras. Vaccine 2015;33 Suppl 1:A53–9. [DOI] [PubMed] [Google Scholar]
- [58].Byberg S, Fisker AB, Rodrigues A, Balde I, Enemark U, Aaby P, Benn CS, & Griffiths UK (2017). Household experience and costs of seeking measles vaccination in rural Guinea-Bissau. Tropical medicine & international health : TM & IH, 22(1), 12–20. 10.1111/tmi.12793. [DOI] [PubMed] [Google Scholar]
- [59].Rheingans RD, Antil L, Dreibelbis R, Podewils LJ, Bresee JS, Parashar UD. Economic costs of rotavirus gastroenteritis and cost-effectiveness of vaccination in developing countries. J Infect Dis 2009;200 Suppl 1:S16–S27. doi: 10.1086/605026. [DOI] [PubMed] [Google Scholar]
- [60].Moyer CA, Tadesse L, Fisseha S. The relationship between facility delivery and infant immunization in Ethiopia. Int J Gynaecol Obstet: Off Organ Int Federation Gynaecol Obstet 2013;123:217–20. [DOI] [PubMed] [Google Scholar]
- [61].Umeh GC, Madubu DM, Korir C, Loveday N, Ishaku S, Iyal H, et al. Micro-planning for immunization in Kaduna State, Nigeria: Lessons learnt, 2017. Vaccine 2018;36:7361–8. [DOI] [PMC free article] [PubMed] [Google Scholar]