

Abstract
BACKGROUND:
Community pharmacists are well positioned to improve patient access to care, which may assist value-based care programs in reaching patients. While pharmacy accessibility is broadly acknowledged, much of the research supporting accessibility claims is poor quality.
OBJECTIVE:
To quantify the accessibility of pharmacists in comparison with physicians or qualified health care professionals (QHP) in a commercially insured population.
METHODS:
IBM MarketScan claims data from 2018 were used for this cross-sectional study. Beneficiaries included in the primary analysis were aged 18-64 years, enrolled with pharmacy benefits in 2018 for 12 months, and had at least 1 valid prescription drug claim or evaluation and management (E&M) code in 2018. Unique pharmacy visits were defined using a 6-day fill window for prescription fill dates, while visits to physicians or other QHP were defined as unique service dates tied to an E&M code. We assessed differences in visit frequency for the full sample, those with multiple chronic conditions (MCC), and “superutilizers” (top 5% based on total cost of care). Our statistical approach included descriptive statistics and the Wilcoxon sign rank test.
RESULTS:
After applying the inclusion criteria, 11,720,958 beneficiaries were included in the full sample. The MCC cohort contained 13.8% of the total sample (mean [SD] age: 50.8 [10.8]; 908,880 [56.1%] female). Finally, the superutilizers were 57.3% female with an average age of 48.4 years and comprised 5.3% of the total sample. The median number of pharmacy and physician or QHP visits for the full sample were 5 and 3 (P < 0.0001), yielding a pharmacy to physician or QHP visit ratio of 1.7:1. The MCC cohort had a median of 13 pharmacy visits and 7 physician or QHP visits (ratio 1.9:1; P < 0.0001), and the superutilizers had a median of 14 pharmacy visits and 9 physician or QHP visits (ratio 1.6:1; P < 0.0001).
CONCLUSIONS:
This study found that patients visit their community pharmacies almost twice as often as they visit their physicians or other QHP. Study findings emphasize the accessibility of community pharmacists and highlight the role of community pharmacists in improving patient engagement in all care programs, including value-based care programs.
What is already known about this subject
Pharmacists are uniquely positioned to improve access to care for high-risk patients.
While the accessibility of community pharmacists is broadly acknowledged, existing literature quantifying pharmacy accessibility for commercial populations is of poor quality.
What this study adds
Patients visit their community pharmacies approximately 1 and a half to 2 times as often as they visit their physician or other qualified health care professionals.
For patients with multiple comorbidities, visits to community pharmacies increase at an equal or greater rate than visits to health care providers.
Value-based care programs may benefit from using pharmacists to help engage and manage patients to improve outcomes and reduce costs.
Value-based care programs seek to improve the quality of health care while reducing spending.1 To achieve these goals, programs must use interdisciplinary approaches, devise coordinated care solutions, and consistently engage patients.2 Providers are being challenged to take greater ownership of their patients’ health outcomes, relying on increased collaboration between all health professionals and consistent follow-up with patients. Diligent management of high-risk patients is a primary focus of many value-based care programs because of the long-term cost implications stemming from preventable overuse of the health care system.3-5 Although a small population, these patients account for the majority of health care spending due to the high prevalence of multiple chronic conditions and increased complexity of care.5 To adequately meet the needs of these patients while reducing costs, tailored interventions and more frequent follow-up are required.5 Therefore, creating programs that increase access to care for patients is imperative for success. Although progress has been made to develop effective programs, reliably reaching patients remains a persistent barrier that must be solved.
Pharmacists can offer a potential solution for improving access to care. As the health care landscape shifts to value-based care, community pharmacists have the opportunity to transition from roles that involve primarily dispensing to those that facilitate interdisciplinary collaboration through deployment of clinical services.6,7 Pharmacists continue to demonstrate their ability to affect patient care through different programs, including medication optimization, disease state management, health and wellness services, and educational consultations.6-8 However, these services often lack connectivity with other providers, limiting their effect on patient outcomes.7 Pharmacy services can supplement those from other providers within value-based care programs because of the status of pharmacists as the most accessible health care provider.9
The degree to which pharmacists are accessible, however, has been poorly quantified. It is commonly cited that patients visit a community pharmacy 35 times per year, compared with visiting their primary care physician (PCP) only 4 times.9 This pharmacy to PCP visit ratio has been repeated in numerous publications to support the involvement of pharmacists within value-based care models, since their relative accessibility and utilization could assist with management and care of patients.7,10-12 However, the evidence supporting this ratio is suboptimal with multiple limitations. The results were published as a blog post rather than as a peer-reviewed study without mention of the methodology used. Also, the patient population and data sources used are unclear, making the results difficult to generalize. Moreover, it is doubtful that more than a small percentage of patients visit a pharmacy nearly 3 times a month. A recent study by Berenbrok et al within the Medicare population found patients had twice as many community pharmacy than primary care visits.13 While both sets of results demonstrate the accessibility advantage of pharmacies, the individual provider visit ratio counts and comparative ratio are smaller in the Berenbrok study.
Although the Berenbrok study seems to represent a more rigorous visit estimate for patients enrolled in Medicare, there remains little understanding of pharmacy visits for commercially insured patients. An accurate estimate is needed to help guide realistic design and implementation of pharmacist-led outreach efforts within value-based care programs. Therefore, the purpose of this study was to quantify the accessibility of pharmacists in comparison with primary care physicians in a commercially insured population, providing an estimate of the visit ratio for the general population, superutilizers, and those with multiple chronic conditions.
Methods
In this cross-sectional study, IBM MarketScan claims data from 2018 were used to compare the visit frequency between pharmacies and physicians or qualified health care professionals (QHP). Beneficiaries included in the main analysis were those aged 18-64 years, enrolled with pharmacy benefits in 2018 for 12 months, and had at least 1 valid (eg, nondenied with a positive charge) prescription drug claim or evaluation and management (E&M) code in 2018 (99201-99205, 99211-99215).
To properly quantify relative access to health care resources, all patients who had evidence of at least 1 health care touch point were included in the main analysis, whether through a pharmacy or service provided by a health care provider. Mail-order pharmacies were excluded from the analysis. To account for prescriptions adjudicated on multiple days picked up in the same visit, unique pharmacy visits were defined using a 6-day fill window based on prescription fill dates. Therefore, if a patient had prescriptions filled on September 6, 9, and 13, they would have 2 unique pharmacy visits utilizing the 6-day fill window, since the visit from September 9 would be combined with the anchor visit on September 6. The visit on September 13 would be counted separately, since it is more than 6 days away from the anchor visit.
Physican and QHPs visits were defined as unique service dates tied to an E&M code. The requirement of an E&M code was used to allow for the inclusion of nonphysician ancillary care providers, while excluding services such as radiology results interpretation, which generate outpatient bills but may not include a patient visit.
In addition to the full sample, we assessed differences in visit frequency for those with multiple chronic conditions (MCC) and superutilizers. Beneficiaries with 2 or more chronic conditions, as defined by the Elixhauser Comorbidity Index,14 were included in the MCC cohort. Beneficiaries determined to be superutilizers were those that comprised the top 5% of total cost of care for the sample selected for this study. The MCC and superutilizer cohorts were not mutually exclusive, since beneficiaries could be included in 1 or both cohorts if they met the eligibility criteria.
Sensitivity analyses were completed for all cohorts using a 0-day and 13-day visit window for pharmacy visits. In addition, a “double visit” sample was created as an additional comparator with the main sample with different health care utilization patterns. The double visit sample consisted of beneficiaries with a valid prescription and an E&M code, indicating potential active use of both providers during the study period.
Our statistical approach included descriptive statistics and the Wilcoxon sign rank test, which tests for the hypothesis that the samples are derived from the same distribution without making any underlying distributional assumptions. All analyses were conducted using SAS version 9.4 (SAS Institute). This retrospective observational study was declared exempt from human subjects review.
Results
Table 1 shows demographics with visit count and ratio comparisons between providers for the full sample, as well as for the MCC and superutilizer cohorts. Within the full sample, 11,720,958 beneficiaries (mean [SD] age = 42.9 [13.4] years, 6,523,513 [55.7%] female) were included in the analysis. This was reduced to 1,620,067 (13.8%) beneficiaries for the MCC cohort and 619,694 (5.3%) for the superutilizer cohort. Mean age was highest for the MCC population at age 50.8 years and lowest for the full sample at age 42.9. Also, a plurality of patients included in this study were located in the southern United States, with percentages ranging from 44.5% to 49.2% across the 3 groups.
TABLE 1.
Description of Population and Visit Counts
| Cohort | Full sample | MCC | Superutilizersa |
|---|---|---|---|
| N (%) | 11,720,958 (100%) | 1,620,067 (13.8%) | 619,694 (5.3%) |
| Age, mean (SD) | 42.9 (13.4) | 50.8 (10.8) | 48.4 (12.0) |
| Sex, female, n (%) | 6,523,513 (55.7) | 908,880 (56.1) | 354,932 (57.3) |
| Region, n (%) | |||
| North east | 2,101,852 (17.9) | 293,304 (18.1) | 124,778 (20.1) |
| North central | 2,493,868 (21.3) | 332,818 (20.5) | 127,819 (20.6) |
| South | 5,215,739 (44.5) | 797,395 (49.2) | 266,992 (43.1) |
| West | 1,881,507 (16.1) | 193,742 (12.0) | 99,037 (16.0) |
| Unknown | 27,992 (0.2) | 2,808 (0.2) | 1,068 (0.2) |
| Number of chronic conditions,b median (IQR) | 0 (0-1) | 2 (2-3) | 2 (1-3) |
| Health care encounters, n (%) | |||
| Pharmacy and physician encounters | 9,199,942 (78.5) | 1,550,079 (96.7) | 597,719 (96.5) |
| Pharmacy encounters only | 1,330,317 (11.4) | 17,677 (1.1) | 8,843 (1.4) |
| Physician/QHP encounters only | 1,190,699 (10.2) | 52,311 (3.2) | 13,132 (2.1) |
| Pharmacist visit count per patient, median (IQR) | 5 (1-11) | 13 (7-20) | 14 (8-21) |
| Physician/QHP visit count per patient, median (IQR) | 3 (1-5) | 7 (4-11) | 9 (5-14) |
| Pharmacy to physician/QHP count ratio | 1.7:1c | 1.9:1c | 1.6:1c |
a Top 5% of total health care cost.
b Derived using Elixhauser conditions.
c Wilcoxon rank sum P < 0.0001.
IQR = interquartile range; MCC = multiple chronic conditions; QHP = qualified health care professional.
Although the majority of the full sample (79.5%) visited a community pharmacy and physician or QHP during the calendar year, 11.4% visited only a community pharmacy, and 10.2% visited only a health care provider. The percentage with both visit types was much higher for the MCC and superutilizer cohorts at 96.7% and 96.5%, respectively.
The median number of visits across all cohorts was highest with superutilizers at 14 for community pharmacies and 9 for physicians, compared with 13 and 7 for the MCC cohort and 5 and 3 for the full sample (Figure 1). Across the groups, however, the pharmacy to provider visit ratio was 1.7:1 for the full sample, 1.9:1 for the MCC cohort, and 1.6:1 for the superutilizer cohort (Table 1). Results of the Wilcoxon sign rank test find that all pairwise comparisons evaluating differences in pharmacy and physician or QHP visits within the same cohort had significant differences at P < 0.0001.
FIGURE 1.
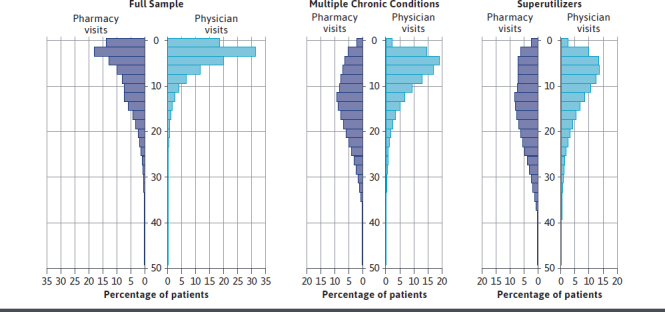
Visit Frequency Comparison by Cohort
Changing the window for calculating pharmacy visits meaningfully affected the observed visit ratio (Supplementary Table 1 (40KB, pdf) , available in online article). The 0-day visit window resulted in actual ratios of pharmacy and physician visit counts of 5:3 (unit ratio: 1.7:1; P < 0.0001) for the full sample, 17:7 (unit ratio: 2.4:1; P < 0.0001) for the MCC cohort, and 18:9 (unit ratio: 2.0:1; P < 0.0001) for the superutilizer cohort. A 13-day visit window resulted in actual ratios of 4:3 (unit ratio: 1.3:1; P < 0.0001), 11:7 (unit ratio: 1.5:1; P < 0.0001), and 12:9 (unit ratio: 1.3:1; P < 0.0001) for the total cohort, MCC cohort, and superutilizer cohort, respectively. Results for the double visit sample, which only included patients with a valid prescription fill and a valid outpatient claim with an E&M code, demonstrated a greater total visit count compared with the primary sample, but the visit ratios did not meaningfully change (Supplementary Table 2 (40KB, pdf) , available in online article).
Discussion
This study found that patients visit their community pharmacies approximately 1 and a half to 2 times as often as they visit their physicians or QHP. There is some variation in the ratio depending on patient chronic conditions, health care utilization, and assumptions about how many days should be used to group individual prescription fills into a single visit event. The ratio of pharmacy to physician or QHP visits for the MCC cohort was equal to or greater than the visit ratio for the full sample and the superutilizers, suggesting that while visits to health care providers increase for patients with MCC, visits to community pharmacies increased at an equal or greater rate. This is in contrast with superutilizers whose high health care spending correlated to an increase in physician or QHP visits out of proportion with community pharmacy visits. Regardless, the number of visits to a community pharmacy remained greater than physician or QHP visits, even when limiting observations to 2 cohorts of patients with high health care needs.
To our knowledge, this study is the first that quantifies the frequency of encounters for pharmacies and health care providers in a commercially insured population. In addition, this research compared general health care users to those with MCC and superutilizers, both of which are well known populations targeted by value-based care programs to reduce health care spending. This study found that the often-stated estimate of pharmacy to physician visit ratio of 35:4 is remarkably inflated and found a visit ratio in line with the 1.9:1 community pharmacy to primary care physician ratio previously reported in the literature within the Medicare population.9,13
Changing the pharmacy visit windows affected the pharmacy visit counts and comparative ratios between providers. The 0-day window produced the highest count and greatest ratio between pharmacies and providers, whereas the 13-day window yielded the lowest count and closest ratio between visit types for all groups. To our knowledge, there is no research to guide appropriate selection of pharmacy visit windows as proxies for pharmacy visits, although it is clear that such research is needed. A 0-day window is likely too liberal, since prescriptions are commonly adjudicated on different days but picked up on the same day. Not accounting for this nuance of prescription claims would overestimate visits. However, a 13-day window, while representative of the maximum time that the typical pharmacy waits before returning a prescription to stock,13 likely groups together multiple fills, which are relatively far apart in calendar time and are therefore picked up on different days.
To illustrate the effect of the window, at a 0-day window the superutilizer cohort had a median of 18 estimated visits to a pharmacy and a ratio of 2.0:1, whereas with a 13-day window the same cohort had a median pharmacy visit count of 12 and a ratio of 1.3:1. Additional work is needed to compare adjudication dates and pick-up dates for a representative sample of dispensed prescriptions to derive a standard for day-based calculation windows when estimating pharmacy visits.
These results suggest that value-based care programs may benefit from using pharmacists to help engage and manage patients to improve outcomes and reduce costs. In addition to the greater number of visits, the full sample observed more than a million patients, greater than 10% of the total cohort, who visited a community pharmacy, but no visit to a physician or QHP over an entire year. Within the period of study, these patients fell outside of the typical health care system and payment models for their care, with their only access to a health care professional through a community pharmacy. Significant health changes can happen within the time frame of 1 year for a patient, even if medications and conditions are thought to be stable.
Although it is recommended for patients to see their physicians or QHP yearly, for those who do not, the community pharmacist may act as an accessible intermediary for point-of-care testing, medication reconciliation, and education and can recommend referrals to providers when patient care requires optimization or further intervention. As a result, pharmacists may prevent more patients from progressing into the MCC and superutilizer cohorts through earlier identification of uncontrolled disease, increased education for patients, and appropriate referrals for further follow-up by a physician or QHP.
To take full advantage of this access opportunity, pharmacists must receive greater incentives; new care models and work streams must be developed; and increased interdisciplinary collaboration and communication is required.15 The opportunity for pharmacists to improve patient outcomes is apparent, but their success will rely on how they are incorporated into the team to use their skills and established accessibility.
LIMITATIONS
Our study has limitations that should be noted. First, pharmacy fill dates were used as a proxy for pharmacy visits, which may have overestimated the number of encounters. Although a 6-day visit window was used to adjust for overestimation, pharmacy pick-up dates would provide a more accurate representation of pharmacy visits for comparison. In addition, within our sample the amount of physician visits may have been underestimated, since patients who did not have an E&M visit but had a valid pharmacy claim were included.
Although not represented in our analysis, these patients would have had at least 1 physician encounter at some point to receive a valid prescription, which would increase the number of physician visits in the sample. However, this could have been a visit outside of the calendar year used for this study, or refills could have been called into the pharmacy without the patient being seen by the prescriber and, subsequently, a claim with an E&M code was not billed to the insurer.
Finally, our sample did not include pharmacy visits that were not tied to a prescription, which could include education and counseling, immunizations, or medication therapy management. Thus, pharmacy visits could also have been underestimated, since these clinical interactions were not accounted for within the analysis.
Conclusions
This study found that patients visit their community pharmacies approximately 1 and a half to 2 times as often as they visit their physicians or other QHP. These findings emphasize the accessibility of community pharmacists and support the use of community pharmacists within value-based care programs to improve patient engagement in the community.
REFERENCES
- 1.Swarthout M, Bishop MA. Population health management: review of concepts and definitions. Am J Health Syst Pharm. 2017;74(18):1405-11. doi: 10.2146/ajhp170025 [DOI] [PubMed] [Google Scholar]
- 2.Teisberg E, Wallace S, O’Hara S. Defining and implementing value-based health care: a strategic framework. Acad Med. 2020;95(5):682-85. doi: 10.1097/ACM.0000000000003122 [DOI] [PMC free article] [PubMed] [Google Scholar]
- 3.Wammes JJG, van der Wees PJ, Tanke MAC, et al. Systematic review of high-cost patients’ characteristics and healthcare utilization. BMJ Open 2018;8:e023113. doi: 10.1136/bmjopen-2018-023113 [DOI] [PMC free article] [PubMed] [Google Scholar]
- 4.Blumenthal D, Chernof B, Fulmer T, Lumpkin J, Selberg J. Caring for highneed, high-cost patients - an urgent priority. N Engl J Med. 2016;375(10):909-11. doi: 10.1056/NEJMp1608511 [DOI] [PubMed] [Google Scholar]
- 5.Ibrahim SA. High-risk patients and utilization of primary care in the US Veterans Affairs Health System. JAMA Netw Open. 2020;3(6):e209518. doi: 10.1001/jamanetworkopen.2020.9518 [DOI] [PubMed] [Google Scholar]
- 6.Newman TV, Hernandez I, Keyser D, et al. Optimizing the role of community pharmacists in managing the health of populations: barriers, facilitators, and policy recommendations. J Manag Care Spec Pharm. 2019;25(9):995-1000. doi: 10.18553/jmcp.2019.25.9.995 [DOI] [PMC free article] [PubMed] [Google Scholar]
- 7.Goode JV, Owen J, Page A, Gatewood S. Community-based pharmacy practice innovation and the role of the community-based pharmacist practitioner in the United States. Pharmacy (Basel). 2019;7(3):106. doi: 10.3390/pharmacy7030106 [DOI] [PMC free article] [PubMed] [Google Scholar]
- 8.Newman TV, San-Juan-Rodriguez A, Parekh N, et al. Impact of community pharmacist-led interventions in chronic disease management on clinical, utilization, and economic outcomes: an umbrella review. Res Social Adm Pharm. 2020;16(9):1155-65. doi: 10.1016/j.sapharm.2019.12.016 [DOI] [PubMed] [Google Scholar]
- 9.Moose J, Branham A. Pharmacists as influencers of patient adherence. Pharmacy Times. August 21, 2014. Accessed November 17, 2021. https://www.pharmacytimes.com/view/pharmacists-as-influencers-of-patient-adherence- [Google Scholar]
- 10.Tsuyuki RT, Beahm NP, Okada H, Al Hamarneh YN. Pharmacists as accessible primary health care providers: review of the evidence. Can Pharm J (Ott). 2018;151(1):4-5. doi: 10.1177/1715163517745517 [DOI] [PMC free article] [PubMed] [Google Scholar]
- 11.Gebhart F. Pharmacists want more time with patients. Drug Topics. March 18, 2019. Accessed November 17, 2021. https://www.drugtopics.com/view/pharmacists-want-more-time-patients [Google Scholar]
- 12.Nightengale B. What was, is no more: community pharmacy economics. J Manag Care Spec Pharm. 2020;26(6): 703-05. doi: 10.18553/jmcp.2020.26.6.703 [DOI] [PMC free article] [PubMed] [Google Scholar]
- 13.Berenbrok LA, Gabriel N, Coley KC, Hernandez I. Evaluation of frequency of encounters with primary care physicians vs visits to community pharmacies among medicare beneficiaries. JAMA Netw Open. 2020;3(7):e209132. doi: 10.1001/jamanetworkopen.2020.9132 [DOI] [PMC free article] [PubMed] [Google Scholar]
- 14.Fernando DT, Berecki-Gisolf J, Newstead S, Ansari Z. Effect of comorbidity on injury outcomes: a review of existing indices. Ann Epidemiol. 2019;36: 5-14. doi: 10.1016/j.annepidem.2019.06.004 [DOI] [PubMed] [Google Scholar]
- 15.Urick BY, Pathak S, Hughes TD, Ferreri SP. Design and effect of performance-based pharmacy payment models. J Manag Care Spec Pharm. 2021;27(3): 306-15. doi: 10.18553/jmcp.2021.27.3.306 [DOI] [PMC free article] [PubMed] [Google Scholar]