

Abstract
Context:
Biospecimen analysis may enhance confidence in the accuracy of self-reported substance use among adolescents and transitional age youth (TAY). Associations between biospecimen types and self-reported use, however, are poorly characterized in the existing literature.
Objective:
We performed a systematic review of associations between biospecimen-confirmed and self-reported substance use.
Data Sources:
PubMed, Embase, and Web of Science.
Study Selection:
We included studies documenting associations between self-reported and biospecimen-confirmed substance use among adolescents (12-18 years) and TAY (19-26 years) published 1990-2020.
Data Extraction:
Three authors extracted relevant data using a template and assessed bias risk using a modified JBI Critical Appraisal Tool.
Results:
We screened 1523 titles and abstracts, evaluated 73 full texts for eligibility, and included 28 studies. Most studies examined urine (71.4%) and hair (32.1%) samples. Self-report retrospective recall period varied from past 24 hours to lifetime use. Agreement between self-report and biospecimen results were low to moderate and were higher with rapidly metabolized substances (e.g., amphetamines) and when shorter retrospective recall periods were applied. Frequently encountered sources of potential bias included use of non-validated self-report measures and failure to account for confounding factors in the association between self-reported and biospecimen-confirmed use.
Limitations:
Study heterogeneity prevented a quantitative meta-analysis. Studies varied in retrospective recall periods, biospecimen processing, and use of validated self-report measures.
Conclusions:
Associations between self-reported and biospecimen-confirmed substance use are low to moderate and are higher for shorter recall periods and for substances with rapid metabolism. Future studies should employ validated self-report measures and include demographically diverse samples.
Keywords: adolescence, biospecimen, self-report, substance use
Table of Contents Summary:
This systematic review examined the associations between self-reported and biospecimen-confirmed substance use among adolescents and transitional age youth.
Substance use is often initiated during adolescence; 38.3% and 44.0% of US students in grades 8, 10, and 12 report lifetime use of any illicit drug (including inhalants) and alcohol, respectively (Johnston et al., 2021). Although experimentation with substances is typical, neurobiological changes make adolescents particularly vulnerable to progression to problematic use (Gray & Squeglia, 2018). The potential adverse effects of substance use during adolescence are well documented, including, but not limited to, increased risk for sexually transmitted infections, unintended pregnancy, involvement in the juvenile legal system, school truancy, exacerbation of psychiatric symptoms, and physical health problems (Gray & Squeglia, 2018; Kulak & Griswold, 2019). Additionally, substance use often co-occurs with psychiatric disorders in adolescence (Brownlie et al., 2019; Welsh et al., 2017) and is associated with impaired social functioning (Marti et al., 2010).
Given the strong bidirectional associations between substance use and adverse health and social outcomes, health researchers often seek to quantify adolescent substance use (Winters & Kaminer, 2008). Such research would ideally include external verification (e.g., biospecimen) of substance use to mitigate potential self-report biases (e.g., under-reporting). Self-reported use is logistically more straightforward than obtaining biospecimens (e.g., urine, hair, saliva, breath) and biological assays often only test for recent (days to weeks) past use, whereas many studies examine lifetime or months-long usage patterns (Aarons et al., 2001). Nonetheless, for recent substance use, it is important to understand the validity of adolescent self-report of substance use compared to analysis of biospecimens (Williams & Nowatzki, 2005). The current systematic review therefore examines the correspondence between self-reported and biospecimen-confirmed substance use among adolescents and transitional age youth (TAY).
Methods
Overall Study Design
The current systematic review followed guidelines described in the Preferred Reporting Items for Systematic Reviews and Meta-Analysis (PRISMA) (Moher et al., 2009).
Search Strategy
A search was carried out in March of 2021 by an information specialist using three electronic databases (PubMed, Embase, and Web of Science). A combination of medical subject headings and free text terms were used to identify publications pertaining to adolescent substance use and biospecimen testing. Searches were limited to publications in English and with publication dates from 01/01/1990-12/31/2020 to increase precision. The reference lists of the articles selected for analysis were searched for additional pertinent publications. Full details of the search strategy are presented in the Supplemental Material.
Inclusion and Exclusion Criteria
Eligible studies were peer-reviewed empirical articles (e.g., controlled trial, cohort study) published between 1990 and 2020 in English, including participants ages 12-26 years and assessing youth-report of substance use (e.g., tobacco, alcohol, cannabis, cocaine, methamphetamine, ecstasy, and other illicit substances) and biospecimen confirmation of substance use within the study sample. We excluded non-empirical reports (e.g., review, meta-analysis, commentary, opinion piece), publications written in any language other than English, and studies involving participants outside the ages of 12-26 years when data was not reported separately for our target age group.
Study Selection
Study screening progress was documented in a PRISMA flow chart (Figure 1). After removing duplicates, our search strategy yielded 1525 publications. Three reviewers (JF, MH, QM) independently screened a random sample of 100 titles and abstracts and collaboratively reviewed decisions to ensure inter-rater reliability. Publications were then divided and screened by the three reviewers to determine if they met criteria for full-text review; 1450 were eliminated because of irrelevance to the topic. Full text screening of 75 articles was completed independently by three reviewers (JF, MH, RK) to determine eligibility for inclusion. Of the 75 full texts reviewed, 47 did not meet inclusion because they were (reasons not mutually exclusive) the wrong study type (e.g., systematic review; n=10), did not present youth data separately from adult data (n=23), or reported no measure of association between self-reported and biospecimen confirmed substance use (n=21). A team of three reviewers (JF, MH, RK) assessed and summarized findings from the final 28 articles. To establish interrater reliability, the three reviewers extracted data from three articles (11% of articles included) independently and met to compare results and resolve discrepancies through discussion. Any disagreements in the full text review were resolved collectively through consultation and detailed examination of the study. The remaining articles were coded independently by a single reviewer. Reviewers met regularly to discuss any questions regarding the articles they coded independently to ensure consistency in decision making.
Figure 1.
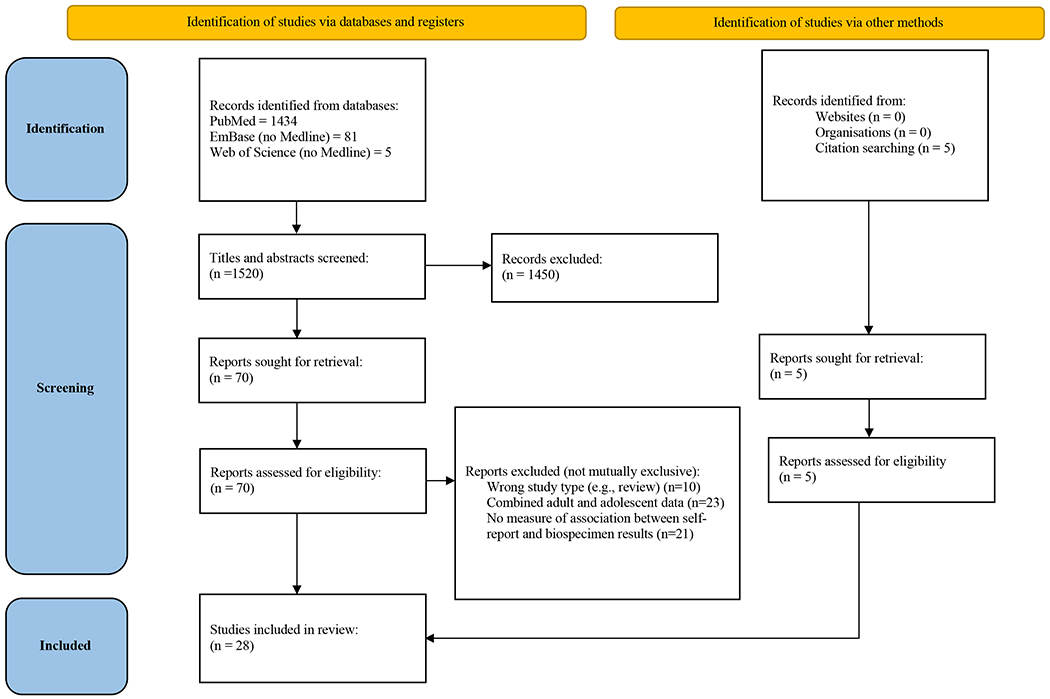
PRISMA Flow Diagram
Abbreviation: PRISMA, Preferred Reporting Items for Systematic reviews and Meta-Analyses
Data Extraction
Data were extracted by three authors (JF, MH, RK) into a standardized electronic form, including information about study design, participants, self-report and biospecimen assessments, and congruence between self-report and biospecimen findings.
Quality Assessment
The JBI Critical Appraisal Checklist for Analytical Cross-Sectional Studies (JBI, 2021) was used to assess the methodological quality and risk of bias of included studies. The JBI was modified to address specific areas relevant to the current review and each study was rated on eight domains (see Supplemental Table 1). Three members of the review team (JF, MH, RK) independently assessed risk of bias for each included study and resolved disagreements through discussion. Bias scores could range from 0 to 8, with high scores reflecting greater degree of bias/lower methodological quality. The quality assessment had no impact on study inclusion or exclusion.
Synthesis of Results
We performed a narrative synthesis because of heterogeneous self-report methods and biospecimen assays for substance use. No single summary measure was applicable across all studies. Additionally, we tabulated the relevant kappa values (a measure of reproducibility or agreement between two measures) by biospecimen type, substance tested, and retrospective self-report recall period among studies that calculated this statistic (Table 2). The following classification of kappa values was used to interpret values: ≤ 0, no agreement; 0.01-0.20, none to slight; 0.21-0.40, fair; 0.41-0.60, moderate; 0.61-0.80, substantial; 0.81-1.00, almost perfect agreement (McHugh, 2012).
Table 2.
Kappa Statistics by Biospecimen, Substance, and Self-Report Period Among Studies that Reported Kappa Values
| Biospecimen: urine | ||||
|---|---|---|---|---|
| Substance | Self-Report Period | Results k (95% CI)a | Assay Type | Citation |
| Cannabis | Past 2 days | 0.57 (0.37, 0.77)b | Laboratory Confirmed | Murphy et al., 2000 |
| Past 3 days | 0.45 (0.40, 0.49) | Laboratory Confirmed | Fendrich & Xu, 1994 | |
| 0.32 | Laboratory Confirmed | Yacoubian et al., 2003 | ||
| Past 5 days | 0.71 (0.50, 0.91)b | Laboratory Confirmed | Murphy et al., 2000 | |
| Past 7 days | 0.79 | Drug Screen | Wilcox et al., 2013 | |
| 0.69 (0.48, 0.90)b | Laboratory Confirmed | Murphy et al., 2000 | ||
| Past 16 days | 0.75 | Laboratory Confirmed | Solbergsdottir et al., 2004 | |
| Past 30 days | 0.44 (0.33-0.54) 0.31 (0.20-0.41) |
Onsite Testing Laboratory Confirmed |
Buchan et al., 2002 | |
| 0.32 (baseline) 0.52 (6 month follow-up) 0.58 (18 month follow-up) |
Drug Screen | Dillon et al., 2005 | ||
| 0.35 (0.31, 0.38) | Laboratory Confirmed | Fendrich & Xu, 1994 | ||
| 0.48 | Laboratory Confirmed | Williams & Nowatzki, 2005 | ||
| 0.31c | Laboratory Confirmed | Yacoubian 2001 | ||
| Past 6 months | 0.36 | Drug Screen | Ciesla & Spear, 2001 | |
| Lifetime | 0.18 (0.16, 0.20) | Laboratory Confirmed | Fendrich & Xu, 1994 | |
| Cocaine | Past 2 days | 0.73 | Laboratory Confirmed | Solbergsdottir et al., 2004 |
| Past 3 days | 0.23 (0.16, 0.29) | Laboratory Confirmed | Fendrich & Xu, 1994 | |
| 0.18 | Laboratory Confirmed | Yacoubian et al., 2003 | ||
| Past 7 days | 0.75 | Drug Screen | Wilcox et al., 2013 | |
| Past 30 days | 0.38 (baseline) 0.49 (6 month follow-up) 0.56 (12 month follow-up) |
Drug Screen | Dillon et al., 2005 | |
| 0.22 (0.16, 0.28) | Laboratory Confirmed | Fendrich & Xu, 1994 | ||
| Lifetime | 0.13 (0.09, 0.18) | Laboratory Confirmed | Fendrich & Xu, 1994 | |
| Opiates | Past 2 days | 0.65 | Laboratory Confirmed | Solbergsdottir et al., 2004 |
| Past 3 days | 0.08 (−0.07, 0.22) | Laboratory Confirmed | Fendrich & Xu, 1994 | |
| 0.40 | Laboratory Confirmed | Yacoubian et al., 2003 | ||
| Past 4 days | 0.30 | Laboratory Confirmed | Williams & Nowatzki, 2005 | |
| Past 7 days | 0.72 | Drug Screen | Wilcox et al., 2013 | |
| Past 30 days | 0.06 (−0.06, 0.18) | Laboratory Confirmed | Fendrich & Xu, 1994 | |
| Lifetime | 0.05 (−0.03, 0.12) | Laboratory Confirmed | Fendrich & Xu, 1994 | |
| Amphetamines/Methamphetamine | Past 2 days | 0.83 | Laboratory Confirmed | Solbergsdottir et al., 2004 |
| Past 3 days | 0.39 (0.26, 0.52) | Laboratory Confirmed | Fendrich & Xu, 1994 | |
| Past 7 days | 0.69 | Drug Screen | Wilcox et al., 2013 | |
| Past 30 days | 0.28 (0.19, 0.37) | Laboratory Confirmed | Fendrich & Xu, 1994 | |
| Lifetime | 0.14 (0.09, 0.18) | Laboratory Confirmed | Fendrich & Xu, 1994 | |
| PCP | Past 3 days | 0.36 (0.21, 0.51) | Laboratory Confirmed | Fendrich & Xu, 1994 |
| 0.46 | Laboratory Confirmed | Yacoubian et al., 2003 | ||
| Past 30 days | 0.37 (0.24, 0.49) | Laboratory Confirmed | Fendrich & Xu, 1994 | |
| Lifetime | 0.18 (0.11, 0.24) | Laboratory Confirmed | Fendrich & Xu, 1994 | |
| Alcohol | <24 hours | 0.13 | Laboratory Confirmed | Williams & Nowatzki, 2005 |
| Past 2 days | 0.19 | Laboratory Confirmed | Solbergsdottir et al., 2004 | |
| Benzodiazepines | Past 2 days | 0.86 | Laboratory Confirmed | Solbergsdottir et al., 2004 |
| Past 7 days | 0.55 | Drug Screen | Wilcox et al., 2013 | |
| Biospecimen: hair | ||||
| Alcohol | Past 90 days | 0.72 (any use; EtG) 0.66 (any use; FAEE) 0.36 (heavy use; EtG) 0.31 (heavy use; FAEE) |
Laboratory Confirmed | Bertol et al., 2017 |
| Caffeine | Past 90 days | 0.57 (heavy use) | Laboratory Confirmed | Bertol et al., 2017 |
| Cocaine | Past 4 months | 0.45 (methadone patients)d 0.00 (criminal justice) |
Laboratory Confirmed | Magura & Kang 1997 |
| Tobacco | Past 90 days | 0.40 | Laboratory Confirmed | Bertol et al., 2017 |
Abbreviations: EtG, ethyl glucuronide; FAEE, fatty acid ethyl ester; k, kappa
Some studies did not report a 95% CI, therefore only kappa is presented.
Conditional kappa reported only when unconditional kappas were not presented in the study.
Average kappa was calculated across 7 years and 12 sites (kappas ranged from 0.11 to 0.49, SD=.09).
Self-report period for comparison depended on hair length (1. 3-cm hair segment compared to 4-6 weeks; 3.6-cm segment to past 3-4 months).
Results
Characteristics of Included Studies
Twenty-eight articles met criteria for inclusion in the final analysis. Study designs were 80.8% (n=21) cross-sectional and 19.2% (n=5) longitudinal. Study sample sizes ranged from 31 to 33,313. Studies predominantly focused on adolescents only (n=17; adolescence defined as ages 12-18 years) or adolescents and TAY (TAY defined as 19-26 years; n=9); two studies included only TAY. Participating youth were on average 54.9% white and 66.2% male; 35.7% (n=10) of studies included youth with involvement in the legal system. Most studies (71.4%, n=20) used urine samples, and 32.1% (n=9) used hair, 10.7% (n=3) blood, 7.1% (n=2) saliva, and 7.1% (n=2) breathalyzer; of these studies, 25.0% (n=7) included more than one biospecimen for comparison with self-report (included in specimen totals). Studies primarily examined congruence between biospecimens and self-reported results for cannabis (67.9%; n=19) and cocaine (50.0%; n=14), with smaller subsets focused on amphetamines/methamphetamines (28.6%; n=8), opioids (28.6%; n=8), alcohol (25.0%; n=7), hallucinogens (17.9%; n=5), PCP (14.3%, n=4), nicotine (14.3%; n=4), barbiturates (7.1%; n=2), and other substances (10.7%; n=3).
Methodological Quality of Included Studies
Results of the JBI risk of bias assessment are displayed in Table 1. Risk of bias across the studies was low, on average (M=2.0, SD=1.2, range=0.5-4.5). Three studies (Feucht et al., 1994; Komro et al., 1993; Oesterle et al., 2015) had ratings above the midpoint (sum scores ≥4), reflecting a moderate amount of bias. The most common sources of bias across studies were not identifying and addressing possible confounders (e.g., self-report period, site), and not adequately describing inclusion/exclusion criteria. For the purpose of this review, no articles were excluded due to risk of bias.
Table 1.
Bias Risk Assessment Ratings
| Study reference | (1) Inclusion criteria | (2) Subject and study description | (3) Exposure description | (4) Measurement of condition | (5) Confounders identified | (6) Confounders addressed | (7) Outcome measurement | (8) Statistical analysis | Sum score |
|---|---|---|---|---|---|---|---|---|---|
| Biological specimen: urine | |||||||||
| Akinci et al., 2001 | .5 | 0 | 0 | .5 | .5 | .5 | 0 | .5 | 2.5 |
| Buchan et al., 2002 | .5 | 0 | 0 | 0 | 0 | 0 | 0 | 0 | 0.5 |
| Burleson & Kaminer, 2006 | 0 | 0 | 0 | .5 | .5 | .5 | 0 | 0 | 1.5 |
| Ciesla & Spear, 2001 | .5 | 0 | .5 | 0 | 0 | 0 | 0 | 0 | 1 |
| Dillon et al., 2005 | .5 | 0 | 0 | 0 | 0 | 0 | 0 | 0 | 0.5 |
| Donahue et al., 2007 | 0 | 0 | 0 | 0 | 0 | 0 | 0 | 0 | 0 |
| Fendrich & Xu, 1994 | .5 | 0 | .5 | 0 | 0 | 0 | 0 | 0 | 1 |
| Gignac et al., 2005 | 0 | 0 | 0 | 0 | 1 | 1 | 0 | .5 | 2.5 |
| Lennox et al., 2006 | 0 | 0 | 0 | 0 | 1 | 1 | 0 | 0 | 2 |
| Murphy et al., 2000 | 0 | 0 | 0 | 0 | .5 | 0 | 0 | 0 | 0.5 |
| Solbergsdottir et al., 2004 | .5 | 0 | .5 | .5 | .5 | .5 | 0 | 0 | 2.5 |
| Wilcox et al., 2013 | .5 | .5 | .5 | 0 | 0 | 0 | 0 | 0 | 1.5 |
| Williams & Nowatzki, 2005 | .5 | 0 | 0 | 0 | 1 | 1 | 0 | 0 | 2.5 |
| Yacoubian, 2001 | 0 | 0 | 0 | 0 | 0 | 0 | 1 | 0 | 1 |
| Yacoubian et al., 2003 | 0 | 0 | 0 | 0 | 0 | 0 | 0 | 0 | 0 |
| Biological specimen: hair | |||||||||
| Bertol et al., 2017 | .5 | .5 | .5 | 0 | .5 | .5 | 0 | 0 | 2.5 |
| Bessa et al., 2010 | 0.5 | 0.5 | 0 | 0 | 1 | 1 | 0 | 0.5 | 3.5 |
| Magura & Kang, 1997 | 0.5 | 0 | 0.5 | 0.5 | 0.5 | 0.5 | 0 | 0 | 2.5 |
| Palamar et al., 2016 | 0.5 | 0 | 0.5 | 0.5 | 0 | 0 | 0 | 0.5 | 2 |
| Biological specimen: blood | |||||||||
| Caraballo et al., 2004 | .5 | 0 | .5 | 0 | 0 | 0 | 0 | 0 | 1 |
| Biological specimen: saliva | |||||||||
| Komro et al., 1993 | .5 | .5 | 0 | 0 | 1 | 1 | 0.5 | 1 | 4.5 |
| Biological specimen: multiple | |||||||||
| Comasco et al., 2009 | .5 | .5 | .5 | 0 | .5 | .5 | 0 | 0 | 2.5 |
| Dembo et al., 1999 | .5 | 0 | .5 | 0 | .5 | .5 | .5 | .5 | 3 |
| Dolcini et al., 2003 | 0 | .5 | .5 | 0 | 0 | 0 | 0 | .5 | 1.5 |
| Feucht et al., 1994 | .5 | 0 | .5 | 0 | 1 | 1 | .5 | 1 | 4.5 |
| Junkuy et al., 2014 | .5 | 0 | .5 | 0 | .5 | .5 | 0 | .5 | 2.5 |
| Oesterle et al., 2015 | 0 | 0 | .5 | 0 | 1 | 1 | 0.5 | 1 | 4 |
| Mieczkowski et al., 1998 | .5 | 0 | .5 | 0 | 0 | 0 | 0 | 1 | 2 |
Concordance Between Self-Report and Biospecimens
Urine.
Twenty studies examined congruence among self-report and urinalysis. Sample size ranged from 31 to 33,313 and youth were on average 72.9% male and 56.4% white; six studies included adolescents and TAY, thirteen were adolescents only, and one included only TAY. Study designs were 30.0% longitudinal (n=6). Substances examined were primarily cannabis (n=18) and cocaine (n=12), with fewer studies on opioids (n=8), amphetamines (n=8), alcohol (n=5), benzodiazepines (n=4), PCP (n =4), barbiturates (n=2), and methaqualone (n=1).
Kappas for cannabis were reported in nine studies (Table 2), ranging from 0.11 (G. Yacoubian, 2001) to 0.79 (Wilcox et al., 2013). Percent discrepancy between self-report and urinalysis was reported in three studies, at 13% (Akinci et al., 2001) and 35% (Mieczkowski et al., 1998), and at 3% for those who self-reported no use, 47% for those who reported use, and at 21% for those who reported abuse or dependence (Gignac et al., 2005). Intraclass correlations were reported in one study (Donohue et al., 2007) across six months, ranging from 0.47 to 0.58 based on contemporaneous self-report and 0.39 to 0.62 based on timeline follow-back report.
Regarding other substances, kappas for cocaine were reported in five studies, ranging from 0.18 (G. S. Yacoubian et al., 2003) to 0.75 (Wilcox et al., 2013) (Table 2); percent discrepancy was reported in two studies at 7% (Mieczkowski et al., 1998) and 100% (Feucht et al., 1994). Kappas ranged from 0.05 (Fendrich & Xu, 1994) to 0.72 (Wilcox et al., 2013) for opioids (reported in 5 studies; Table 2); 0.14 (Fendrich & Xu, 1994) to 0.83 (Solbergsdottir et al., 2004) for amphetamines (reported in 3 studies); 0.55 (Wilcox et al., 2013) to 0.86 (Solbergsdottir et al., 2004) for benzodiazepines (reported in 2 studies); 0.13 (Williams & Nowatzki, 2005) to 0.19 (Solbergsdottir et al., 2004) for alcohol (reported in 2 studies); and 0.18 (Fendrich & Xu, 1994) to 0.46 (G. S. Yacoubian et al., 2003) for PCP (reported in 2 studies; Table 2). The remaining studies combined results across biospecimens and could not be disaggregated.
Hair.
Nine studies examined congruence among self-report and hair specimen analysis. Sample size ranged from 48 to 1,000 and youth were on average 62.7% male and 46.1% white; four studies included adolescents only, three included adolescents and TAY, and two TAY only. All studies were cross-sectional designs. Substances examined were cocaine (n=5), cannabis (n=3), alcohol (n=2), amphetamines (n=1), hallucinogens (n=1), nicotine (n=1) and other (n=2; bath salts, caffeine). Only three studies reported kappas (Table 2), though one did not clearly define the self-report period (Table 1).
For cocaine, kappas were 0.45 among methadone patients and 0.00 among criminal justice-involved individuals (Magura & Kang, 1997). Regarding percent detection, in a sample with no reported cocaine use, 1.7% tested positive on hair analysis (Bessa et al., 2010); in a sample where 0.9%, 3.2%, and 13.2% reported cocaine use in the last 3 days, 30 days, and ever, 22% tested positive for cocaine (Mieczkowski et al., 1998). Another study found of those who tested positive for cocaine, 93% self-reported no use in the past three months, whereas of those who tested negative 8% self-reported use (Dembo et al., 1999). Among six participants who reported ever using cocaine, five were negative by hair assay and of the three who reported use in the last month, only one was positive by hair assay (Feucht et al., 1994).
Regarding cannabis, in a sample with no reported cannabis use, 4% tested positive on hair analysis (Bessa et al., 2010); in a sample where 25.3%, 50.6%, and 85.6% reported cannabis use in the last three days, 30 days, and ever, 38.5% tested positive for cannabis (Mieczkowski et al., 1998). An additional study found that of those who tested positive for cannabis, 19% self-reported no use in the past three months, whereas of those who tested negative, 35% self-reported use (Dembo et al., 1999).
For amphetamine use, percent detection ranged from 34.3% (≤90 days) to 46.4% (≤1 day) (Junkuy et al., 2014). Among participants who reported lifetime use of “bath salts”, stimulant NPS, or unknown pills or powders, 41.2% (n = 14) tested positive for an NPS (i.e., had discordant reports) (Palamar et al., 2016). For alcohol, kappas ranged from 0.31 to 0.72 depending upon the method of analysis (Bertol et al., 2017); among heavy drinkers and high alcohol consumers, kappas were −0.05 and −0.03 respectively (Comasco et al., 2009). Kappas for caffeine and tobacco were 0.57 and 0.40, respectively (Bertol et al., 2017).
Blood.
Three studies examined congruence among self-report and blood specimens. Sample size ranged from 200 to 2,107 and youth were on average 42.7% male and 63.2% white; two studies included adolescents only and one included adolescents and TAY. All three were cross-sectional designs. One focused solely on alcohol (Comasco et al., 2009) finding no agreement between phosphatidyl ethanol analysis (venous blood sample) and a semi-structured interview which classified participants as low or high alcohol consumers. One focused on nicotine (Caraballo et al., 2004), finding sensitivity of 78.9% and a specificity of 97.3% when self-report was used as the gold standard (Caraballo et al., 2004); when serum cotinine concentration (cutoff of 11.40 ng/ml) was used as the gold standard, there was a sensitivity of 81.3% and a specificity of 96.9%. Adolescents who self-reported smoking less than one cigarette daily, on average, were 34 times more likely to have discrepant biochemically cotinine levels, compared to those who smoke five or more cigarettes daily. One study combined results across biospecimens and could not be disaggregated (Oesterle et al., 2015).
Saliva.
Two studies examined congruence among self-report of nicotine use and saliva specimens in cross-sectional, adolescent only samples (Dolcini et al., 2003; Komro et al., 1993). Sample sizes ranged from 959 to 1,881 and adolescents were approximately half female in both studies and 69% white (race was only reported in a single study (Dolcini et al., 2003)). One study (Dolcini et al., 2003) found unadjusted sensitivity of cotinine ranging from 48.6% (self-reported smoking in past 9 hours) to 88.9% (self-reported smoking today), and unadjusted specificity from 92.5% (self-reported smoking today) to 93.8% (self-reported smoking in past 3 days); for thiocyanate, unadjusted sensitivity ranged from 31.4% (self-reported smoking in past 9 hours) to 48.9% (self-reported smoking today) and unadjusted specificity at 81.2% or 81.3% across all time periods (self-reported smoking in past nine hours through past three days). Another study examining thiocyanate found that students in the reference group falsely claimed to be nonsmokers more frequently (10.04%) than students in the treatment group (5.96%) (Komro et al., 1993).
Brethalyzer.
Two studies examined congruence among self-report and breathalyzers in cross-sectional, adolescent only samples (Dolcini et al., 2003; Oesterle et al., 2015). Sample sizes ranged from 645 to 1,881 and adolescents were approximately 43.3% male and 76.2% White. One study examined carbon monoxide, finding unadjusted sensitivity ranging from 33.3% (self-reported smoking in past 9 hours) to 68.9% (self-reported smoking today) and unadjusted specificity ranging at 98% across all time periods (self-reported smoking in past nine hours through past three days). The one study of ethanol combined results across biospecimens and could not be disaggregated (Oesterle et al., 2015).
Discussion
Summary of Evidence
This systematic review reveals substantial variability in the concordance between self-reported and biospecimen-confirmed substance use among adolescents and TAY. The agreement between self-report and biospecimen-confirmed substance use was, at best, moderate, and agreement generally decreased as the length of self-report recall period increased. Risk of bias among the studies included were low-to-moderate; however, the wide variability in methods precluded quantitative aggregation of findings. The most consistent source of bias across studies was not using a validated self-report measure of substance use.
The largest number of studies compared self-reported use with urinalysis. Different substances, however, have different periods of detection and sensitivity by urinalysis, particularly for infrequent use, and as such the concordance between self-report and urinalysis differs by substance. For instance, daily cannabis use may be detected in urine for up to a month following last use, whereas more rapidly metabolized drugs such as cocaine may be undetectable in urine within days of last use. Therefore, adolescents reporting use when biospecimens are negative may indicate the biospecimen test is not sensitive enough. Of note, very recent recall (past 2 days) of benzodiazepine and amphetamine use was excellent; however, this was documented in single study conducted among 100% white and predominantly (68%) male treatment-seeking patients in a single treatment center (Solbergsdottir et al., 2004). Other included studies had greater diversity in terms of sex and race/ethnicity. In addition, a substantial number of studies included youth involved in the legal system, for whom accurate substance use assessment has substantial legal implications.
Studies also used different methods of analyzing biospecimens, which may be contributing to variability in concordance between self-reported and biospecimen analysis. For urinalysis, as an example, studies used techniques including but not limited to, analyte immunoassay (Dillon et al., 2005), fluorescence polarization immunoassay and a paper chromatography screen (Williams & Nowatzki, 2005), and SYVA Emit enzyme amino acid assay technique (Donohue et al., 2007); some confirmed positive tests with gas chromatography/mass spectrometry (e.g., Buchan et al., 2002; Yacoubian, 2001). Thresholds for detection were not consistently reported, which is a crucial detail for reproducibility and understanding differences in concordance across studies.
Strengths
This study is the first systematic review providing a rigorous evaluation of the evidence related to the association between self-reported and biospecimen-confirmed substance use among adolescents and TAY. With the assistance of a medical librarian we searched multiple databases for relevant studies over the past three decades. In addition, we applied a structured risk-of-bias evaluation of each included study. We applied PRISMA guidelines in our presentation of results. Our summary of available kappa values illustrates pertinent patterns in associations between self-reported and biospecimen-confirmed substance use. Participants in the studies were recruited from diverse settings, including substance use treatment facilities, the legal system, and educational environments; thus, our findings may be applicable to a wide range of youth cohorts.
Limitations
Our findings suggest the need for more systematic use of objective measures of youth substance use, as overall the concordance was low for most specimen types, particularly beyond a seven-day self-report period. The diverse nature of the studies (e.g., self-report measure used, mode of administration for self-report and biospecimen collection method and threshold, comparison statistics presented) and the limited number of studies per biospecimen and substance type limited our ability to conduct a meta-analysis to examine the relative impact of study and sample characteristics on concordance. Our search strategy of published sources was comprehensive, though it is possible some studies were missed as a result of excluding non-English-language publications. In addition, we limited our study to include only published studies, which may be subject to publication bias. It is possible inclusion of non-published data might yield different results, particularly given that published studies are often more likely to have found statistical significance.
Recommendations for Future Research
Whenever possible, studies examining the associations between self-reported and biospecimen-confirmed substance use among adolescents and TAY should use validated self-report measures. Multiple brief self-report tools are available, many of them free, and can be integrated into routine clinical practice and research (Gray & Squeglia, 2018). Of note, the Screening to Brief Intervention (S2BI) (Levy et al., 2014) and queries frequency of use of eight drugs during the past year, yielding high sensitivity and specificity for identifying use and substance use disorders. The Brief Screener for Tobacco, Alcohol, and Other Drugs (BSTAD) (Kelly et al., 2014) assesses frequency of use during the past year and provides optimal cutoff points for identifying substance use disorders.
Furthermore, studies should explore differences in agreement between self-report and biospecimen results for various self-report recall durations and biospecimen types, ideally within the same cohort. These data would help clinicians and researchers identify optimal testing parameters for a substance given the specific clinical or research question. More data are needed to inform real-world applications; to that end, studies should examine associations in clinical and non-clinical settings. Acceptance of biospecimen testing in voluntary settings (e.g., when not court mandated) is dependent on patient perceptions; future studies should integrate patient preference for testing modalities (Gassman et al., 2016).
Conclusions
This systematic review summarizes three decades of research examining the associations between self-reported and biospecimen-confirmed substance use among adolescents and TAY. Included studies varied widely in their methods and presentation of results, thereby impeding straightforward synthesis across studies. Overall, associations between self-reported and biospecimen-confirmed use were in the low-to-moderate range and tended to be higher when shorter self-report recall periods were used and among substances with rapid metabolism. Future research should examine self-reported substance use using validated measures, and biospecimen analysis both combined with self-report and independently to explore the distinct performance of these two techniques on rates of substance use.
Supplementary Material
Acknowledgments:
This publication was supported by the National Institute on Drug Abuse (K23DA050798, PI: Folk) the National Center for Advancing Translational Sciences, National Institutes of Health, through UCSF-CTSI (UL1 TR001872). Its contents are solely the responsibility of the authors and do not necessarily represent the official views of the NIH.
Abbreviations:
- PRISMA
Preferred Reporting Items for Systematic Reviews and Meta-Analysis
- TAY
transitional age youth
Footnotes
Disclosure of Interest: The authors have indicated they have no financial relationships relevant to this article to disclose.
Clinical Trials Registration: N/A
References
- Aarons GA, Brown SA, Hough RL, Garland AF, & Wood PA (2001). Prevalence of adolescent substance use disorders across five sectors of care. Journal of the American Academy of Child and Adolescent Psychiatry, 40(4), 419–426. 10.1097/00004583-200104000-00010 [DOI] [PubMed] [Google Scholar]
- Akinci IH, Tarter RE, & Kirisci L (2001). Concordance between verbal report and urine screen of recent marijuana use in adolescents. Addictive Behaviors, 26(4), 613–619. 10.1016/s0306-4603(00)00146-5 [DOI] [PubMed] [Google Scholar]
- Bertol E, Vaiano F, Boscolo-Berto R, Fioravanti A, Palumbo D, Catalani V, Mari F, Patussi V, & Serpelloni G (2017). Alcohol, caffeine, and nicotine consumption in adolescents: Hair analysis versus self-report. The American Journal of Drug and Alcohol Abuse, 43(3), 341–349. 10.1080/00952990.2016.1216556 [DOI] [PubMed] [Google Scholar]
- Bessa MA, Mitsuhiro SS, Chalem E, Barros MM, Guinsburg R, & Laranjeira R (2010). Underreporting of use of cocaine and marijuana during the third trimester of gestation among pregnant adolescents. Addict Behav, 35(3), 266–269. 10.1016/j.addbeh.2009.10.007 [DOI] [PubMed] [Google Scholar]
- Brownlie E, Beitchman JH, Chaim G, Wolfe DA, Rush B, & Henderson J (2019). Early adolescent substance use and mental health problems and service utilisation in a school-based sample. The Canadian Journal of Psychiatry, 64(2), 116–125. 10.1177/0706743718784935 [DOI] [PMC free article] [PubMed] [Google Scholar]
- Caraballo RS, Giovino GA, & Pechacek TF (2004). Self-reported cigarette smoking vs. Serum cotinine among U.S. adolescents. Nicotine & Tobacco Research: Official Journal of the Society for Research on Nicotine and Tobacco, 6(1), 19–25. 10.1080/14622200310001656821 [DOI] [PubMed] [Google Scholar]
- Comasco E, Nordquist N, Leppert J, Oreland L, Kronstrand R, Alling C, & Nilsson KW (2009). Adolescent alcohol consumption: Biomarkers PEth and FAEE in relation to interview and questionnaire data. Journal of Studies on Alcohol and Drugs, 70(5), 797–804. 10.15288/jsad.2009.70.797 [DOI] [PubMed] [Google Scholar]
- Dembo R, Shemwell M, Guida J, Schmeidler J, Baumgartner W, Ramirez-Garnica G, & Seeberger W (1999). A comparison of self-report, urine sample, and hair sample testing for drug use: A longitudinal study. In Drug Testing Technology: Assessment of Field Applications (1st ed., pp. 91–108). CRC Press. [Google Scholar]
- Dolcini MM, Adler NE, Lee P, & Bauman KE (2003). An assessment of the validity of adolescent self-reported smoking using three biological indicators. Nicotine & Tobacco Research: Official Journal of the Society for Research on Nicotine and Tobacco, 5(4), 473–483. [PubMed] [Google Scholar]
- Donohue B, Hill HH, Azrin NH, Cross C, & Strada MJ (2007). Psychometric support for contemporaneous and retrospective youth and parent reports of adolescent marijuana use frequency in an adolescent outpatient treatment population. Addictive Behaviors, 32(9), 1787–1797. 10.1016/j.addbeh.2006.12.005 [DOI] [PubMed] [Google Scholar]
- Fendrich M, & Xu Y (1994). The validity of drug use reports from juvenile arrestees. The International Journal of the Addictions, 29(8), 971–985. 10.3109/10826089409047921 [DOI] [PubMed] [Google Scholar]
- Feucht TE, Stephens RC, & Walker ML (1994). Drug use among juvenile arrestees: A comparison of self-report, urinalysis and hair assay. Journal of Drug Issues, 24(1), 99–116. 10.1177/002204269402400106 [DOI] [Google Scholar]
- Gassman RA, Agley J, Fly AD, Beckmeyer JJ, He K, Aaron Sayegh M, & Tidd D (2016). Using biological samples for youth ATOD survey validation. Addiction Research & Theory, 24(3), 177–185. 10.3109/16066359.2015.1094061 [DOI] [Google Scholar]
- Gignac M, Wilens TE, Biederman J, Kwon A, Mick E, & Swezey A (2005). Assessing cannabis use in adolescents and young adults: What do urine screen and parental report tell you? Journal of Child and Adolescent Psychopharmacology, 15(5), 742–750. 10.1089/cap.2005.15.742 [DOI] [PubMed] [Google Scholar]
- Gray KM, & Squeglia LM (2018). Research review: What have we learned about adolescent substance use? Journal of Child Psychology and Psychiatry, and Allied Disciplines, 59(6), 618–627. 10.1111/jcpp.12783 [DOI] [PMC free article] [PubMed] [Google Scholar]
- JBI. (2021). Critical Appraisal Tools. https://jbi.global/critical-appraisal-tools
- Johnston LD, Miech RA, O’Malley PM, Bachman JG, Schulenberg JE, & Patrick ME (2021). Monitoring the Future national survey results on drug use 1975-2020: Overview, key findings on adolescent drug use. Institute for Social Research, University of Michigan. http://www.monitoringthefuture.org//pubs/monographs/mtf-overview2020.pdf [Google Scholar]
- Junkuy A, Aramrattana A, & Sribanditmongkol P (2014). A comparative study of self-report, urinalysis and hair analysis in the detection of methamphetamine in Yaba users. Journal of the Medical Association of Thailand, 97(7), 776–784. [PubMed] [Google Scholar]
- Kelly SM, Gryczynski J, Mitchell SG, Kirk A, O’Grady KE, & Schwartz RP (2014). Validity of brief screening instrument for adolescent tobacco, alcohol, and drug use. Pediatrics, 133(5), 819–826. 10.1542/peds.2013-2346 [DOI] [PMC free article] [PubMed] [Google Scholar]
- Komro KA, Kelder SH, Perry CL, & Klepp KI (1993). Effects of a saliva pipeline procedure on adolescent self-reported smoking behavior and youth smoking prevention outcomes. Preventive Medicine, 22(6), 857–865. 10.1006/pmed.1993.1077 [DOI] [PubMed] [Google Scholar]
- Kulak JA, & Griswold KS (2019). Adolescent substance use and misuse: Recognition and management. American Family Physician, 99(11), 689–696. [PubMed] [Google Scholar]
- Levy S, Weiss R, Sherritt L, Ziemnik R, Spalding A, Van Hook S, & Shrier LA (2014). An electronic screen for triaging adolescent substance use by risk levels. JAMA Pediatrics, 168(9), 822–828. 10.1001/jamapediatrics.2014.774 [DOI] [PMC free article] [PubMed] [Google Scholar]
- Magura S, & Kang SY (1997). The validity of self-reported cocaine use in two high-risk populations. NIDA Research Monograph, 167, 227–246. [PubMed] [Google Scholar]
- Marti CN, Stice E, & Springer DW (2010). Substance use and abuse trajectories across adolescence: A latent trajectory analysis of a community-recruited sample of girls. Journal of Adolescence, 33(3), 449–461. 10.1016/j.adolescence.2009.06.005 [DOI] [PMC free article] [PubMed] [Google Scholar]
- McHugh ML (2012). Interrater reliability: The kappa statistic. Biochemia Medica, 22(3), 276–282. [PMC free article] [PubMed] [Google Scholar]
- Mieczkowski T, Newel R, & Wraight B (1998). Using hair analysis, urinalysis, and self-reports to estimate drug use in a sample of detained juveniles. Substance Use & Misuse, 33(7), 1547–1567. 10.3109/10826089809069812 [DOI] [PubMed] [Google Scholar]
- Moher D, Liberati A, Tetzlaff J, Altman DG, & PRISMA Group. (2009). Preferred reporting items for systematic reviews and meta-analyses: The PRISMA statement. PLoS Medicine, 6(7), e1000097. 10.1371/journal.pmed.1000097 [DOI] [PMC free article] [PubMed] [Google Scholar]
- Oesterle TS, Hitschfeld MJ, Lineberry TW, & Schneekloth TD (2015). CRAFFT as a substance use screening instrument for adolescent psychiatry admissions. Journal of Psychiatric Practice, 21(4), 259–266. 10.1097/PRA.0000000000000083 [DOI] [PubMed] [Google Scholar]
- Palamar JJ, Salomone A, Vincenti M, & Cleland CM (2016). Detection of “bath salts” and other novel psychoactive substances in hair samples of ecstasy/MDMA/”Molly” users (26883685). 161, 200–205. 10.1016/j.drugalcdep.2016.02.001 [DOI] [PMC free article] [PubMed] [Google Scholar]
- Solbergsdottir E, Bjornsson G, Gudmundsson LS, Tyrfingsson T, & Kristinsson J (2004). Validity of self-reports and drug use among young people seeking treatment for substance abuse or dependence. Journal of Addictive Diseases, 23(1), 29–38. 10.1300/J069v23n01_03 [DOI] [PubMed] [Google Scholar]
- Welsh JW, Knight JR, Hou SS-Y, Malowney M, Schram P, Sherritt L, & Boyd JW (2017). Association between substance use diagnoses and psychiatric disorders in an adolescent and young adult clinic-based population. The Journal of Adolescent Health: Official Publication of the Society for Adolescent Medicine, 60(6), 648–652. 10.1016/j.jadohealth.2016.12.018 [DOI] [PubMed] [Google Scholar]
- Wilcox CE, Bogenschutz MP, Nakazawa M, & Woody G (2013). Concordance between self-report and urine drug screen data in adolescent opioid dependent clinical trial participants. Addictive Behaviors, 38(10), 2568–2574. 10.1016/j.addbeh.2013.05.015 [DOI] [PMC free article] [PubMed] [Google Scholar]
- Williams RJ, & Nowatzki N (2005). Validity of adolescent self-report of substance use. Substance Use & Misuse, 40(3), 299–311. 10.1081/ja-200049327 [DOI] [PubMed] [Google Scholar]
- Winters KC, & Kaminer Y (2008). Screening and assessing adolescent substance use disorders in clinical populations. Journal of the American Academy of Child and Adolescent Psychiatry, 47(7), 740–744. 10.1097/CHI.0b013e31817395cf [DOI] [PMC free article] [PubMed] [Google Scholar]
- Yacoubian G (2001). Exploring the temporal validity of self-reported marijuana use among juvenile arrestees. Journal of Alcohol and Drug Education, 46(3), 34–42. [Google Scholar]
- Yacoubian GS, VanderWall KL, Johnson RJ, Urbach BJ, & Peters RJ (2003). Comparing the validity of self-reported recent drug use between adult and juvenile arrestees. Journal of Psychoactive Drugs, 35(2), 279–284. 10.1080/02791072.2003.10400010 [DOI] [PubMed] [Google Scholar]
Associated Data
This section collects any data citations, data availability statements, or supplementary materials included in this article.