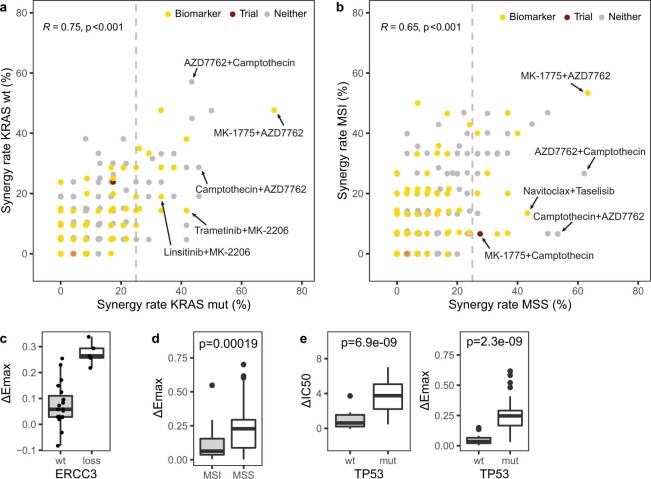
Extended Data Fig. 6. Populations of unmet clinical need.
a, b, 28 and 38 combinations are highly synergistic in KRAS mut (a) or MSS (b) colon cancer cell lines and some have ΔEmax or ΔIC50 biomarkers or are in clinical trials. Synergy rates of all colon combinations shown by KRAS mutant (mut; x-axis) versus wild-type (wt; y-axis;). b) or MSS (x-axis) versus MSI (y-axis; a). Colours represent biomarker or clinical trial presence. Vertical dashed line represents a synergy rate of 25% in MSS or KRAS mutant cell lines. n = 650 combinations. Pearson correlation with Fisher’s Z transform as statistical test. c, Loss of ERCC3 is associated with increased efficacy (ΔEmax) of linsitinib+MK-2206 in KRAS mutant colon (n = 20 wt; n = 5 loss). Median and interquartile range. p-value < 0.001, FDR < 0.05. d, Colon MSS cells show higher efficacy (ΔEmax) for AZD7762 (CHEK1/2) and camptothecin (TOP1). Drug combination responses were averaged across replicates and both anchor-library combination configurations were pooled (n = 31 MSS cell lines; n = 15 MSI cell lines). Median and interquartile range. Two-sided Welch’s t-test. e, AZD7762 and camptothecin have greater potency (ΔIC50) and efficacy (ΔEmax) in KRAS-TP53 double mutant colon cancer cells (n = 8 KRAS mutant & TP53 wild-type cell lines (wt); n = 16 KRAS-TP53 double mutant cell lines (mut)). Drug combination responses were averaged across replicates and both combination configurations were pooled. Median and interquartile range. Two-sided Welch’s t-test.

