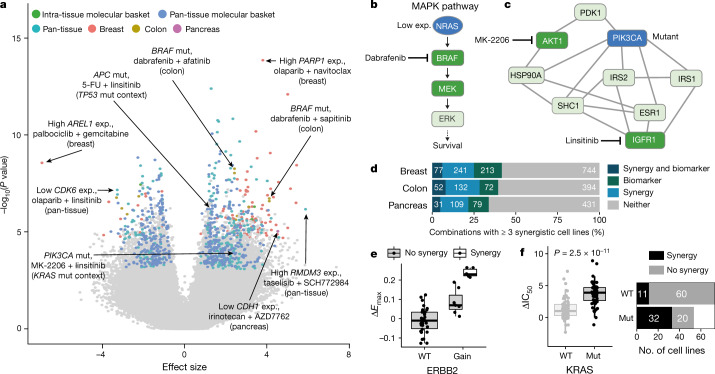
Fig. 3. A biomarker pipeline incorporating multi-omics features identifies context-specific associations.
a, Volcano plot of biomarkers associated with ΔIC50 (n = 2,006,328). Statistically significant large effect-size biomarkers (n = 884) are coloured by analysis type. Examples discussed in the text and selected outliers are labelled. Exp., expression; mut., mutant. b, Schematic of MAPK pathway showing the relationship between NRAS and BRAF. Low expression of NRAS is a biomarker of certain dabrafenib-containing combinations. c, Network of interactors of PIK3CA, showing its position two nodes away from targets of MK-2206 and linsitinib. PIK3CA mutation is predictive of the linsitinib + MK-2206 combination response in the KRAS-mutant molecular context. d, Number of combinations with at least three synergistic cell lines and combination response biomarkers (ΔEmax or ΔIC50). e, Gain of ERBB2 is associated with sapitinib + JQ1 combination response in breast and all synergistic cell lines have an ERBB2 amplification. f, KRAS mutation is associated with trametinib + MK-2206 combination response in a pan-tissue setting (left, two-sided Welch’s t-test) and most synergistic cell lines harbour mutated KRAS (right). In box plots, the horizontal line shows the median, boxes extend across first and third quartiles, and whiskers extend to 1.5× interquartile range.

