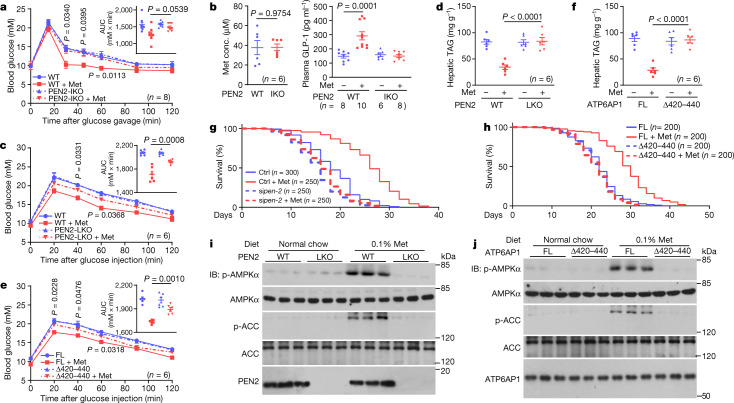
Fig. 4. PEN2 and ATP6AP1 are required for the biological effects of metformin.
a, b, Intestinal PEN2 is required for the metformin-induced glucose-lowering effect. PEN2-IKO mice were administered with metformin as depicted in Extended Data Fig. 12d. Oral glucose tolerance test analysis (a), measurements of duodenal metformin concentrations (b, left) and measurements of plasma GLP-1 levels before and after 15 min of glucose gavaging (b, right) were then performed. c, d, PEN2 is required for metformin-induced reduction in hepatic fat. Mice in which Pen2 was specifically knocked out in the liver (LKO) were treated with metformin as depicted in Extended Data Fig. 12f. Intraperitoneal glucose tolerance test results (c) and hepatic TAG levels (d) in mice after 16 weeks of treatment of metformin are shown. e, f, ATP6AP1 is required for metformin-induced reduction in hepatic fat. Mice were treated as depicted in Extended Data Fig. 12m. Intraperitoneal glucose tolerance test results (e) and hepatic TAG levels (f) in mice after 16 weeks of treatment of metformin are shown. g, h, PEN2 and ATP6AP1 are required for metformin-induced lifespan extension in C. elegans. WT (N2) nematodes with pen-2 (T28D6.9) knocked down using siRNA (sipen-2) (g) or ATP6AP1–/– (vha-19) nematodes with full-length ATP6AP1 or ATP6AP1Δ420–440 stably expressed (h) were treated with 50 mM metformin. Lifespan data are shown as Kaplan–Meier curves (statistical analyses are provided in Supplementary Table 3). Ctrl, control. i, j, PEN2 and ATP6AP1 are required for AMPK activation induced by 0.1% metformin in the diet. The 5-week-old PEN2-LKO mice (i; tamoxifen was injected at 4 weeks old) or 8-week-old ATP6AP1-LKO mice expressing ATP6AP1Δ420–440 (j; viruses injected at 4 weeks old, and tamoxifen was injected at 5 weeks old), were fed with normal chow diet containing 0.1% metformin for 1 week, as previously described10. Hepatic AMPK activation was then analysed by IB. For gel source data, see Supplementary Fig. 1. Data are shown as the mean ± s.e.m., n values are labelled on each panel, and P values were calculated using two-way repeated-measures ANOVA followed by Tukey’s test (a, c and e compared blood glucose between the WT/ATP6AP1-FL + Met group and the PEN2-IKO/LKO/ATP6AP1Δ420–440 + Met group at each time point; see also insets of a, c and e for area under the receiver operator characteristic curve (AUC) values, and P values by two-way ANOVA, followed by Tukey’s test), two-sided Student’s t-test (b, left), and two-way ANOVA, followed by Tukey’s test (right panel of b, and d, f). Experiments in this figure were performed three times.

