Abstract
Several PI3Kδ inhibitors are approved for the therapy of B cell malignancies, but their clinical use has been limited by unpredictable autoimmune toxicity. We have recently reported promising efficacy results treating chronic lymphocytic leukemia (CLL) patients with combination therapy with the PI3Kδγ inhibitor duvelisib and fludarabine cyclophosphamide rituximab (FCR) chemoimmunotherapy, but approximately one-third of patients develop autoimmune toxicity. We show here that duvelisib FCR treatment in an upfront setting modulates both CD4 and CD8 T cell subsets as well as pro-inflammatory cytokines. Decreases in naïve and central memory CD4 T cells and naïve CD8 T cells occur with treatment, while activated CD8 T cells, granzyme positive Tregs and Th17 CD4 and CD8 T cells all increase with treatment, particularly in patients with toxicity. Cytokines associated with Th17 activation (IL-17A and IL-21) are also relatively elevated in patients with toxicity. The only CLL feature associated with toxicity was increased priming for apoptosis at baseline, with a significant decrease during the first week of duvelisib. We conclude that an increase in activated CD8 T cells with activation of Th17 T cells, in the context of lower baseline Tregs and greater CLL resistance to duvelisib, is associated with duvelisib-related autoimmune toxicity.
Introduction:
Despite recent therapeutic advances, chronic lymphocytic leukemia (CLL) remains an incurable disease. In randomized clinical trials, phosphatidylinositol 3 kinase inhibitors (PI3Ki) improve progression-free and overall survival, but at the expense of significant autoimmune toxicities1, 2. Duvelisib is a potent small molecule oral PI3K inhibitor that targets both the p110δ and p110γ isoforms3 and was approved by the US Food and Drug Administration in 2018 for the therapy of relapsed refractory CLL and follicular lymphoma4, 5. The goal of dual isoform inhibition is to achieve cell autonomous tumor inhibition by blocking p110δ, while also targeting the microenvironment through p110γ3. The PI3Kγ isoform modulates macrophage and T cell function, with mice lacking PI3Kγ showing increased CD8 T cell activation and cytotoxicity due to transcriptional activation of NFκB and inhibition of C/EBPβ in macrophages in the microenvironment6.
Immune-related adverse events (irAEs) caused by PI3Ki can be severe in a subset of CLL patients1. These irAEs are more common in younger, less heavily pretreated patients, and in those with mutated immunoglobulin heavy chain variable regions (IGHV)1, 7. We conducted a clinical trial in young fit CLL patients in which we combined duvelisib with FCR therapy (dFCR), with the goal of achieving a high rate of undetectable MRD (uMRD) (Supplementary Figure 1). The regimen was highly effective, with an 88% overall response rate (ORR) and 66% uMRD rate in bone marrow8. While the therapy was generally well tolerated, nonetheless irAEs included transaminitis (28% grade 3–4), arthritis (9% grade 2), and colitis (6% grade 2–3) along with some opportunistic infections. These irAEs can resolve with drug hold, or more rapidly with steroids, suggesting an autoimmune mechanism. In this study, we sought to understand duvelisib immunomodulation by evaluating immune cell subset changes that occurred in patients who developed irAEs in this trial. To accomplish this, we used mass cytometry by time-of-flight (CyTOF) technology to comprehensively interrogate the effects of duvelisib on T cell subsets in patient samples.
Patients and Methods:
Clinical Trial Sampling
We initiated a clinical trial that evaluated dFCR for previously untreated younger fit patients (Supplementary Figure 1)8. Patients started on day −7 with one week of duvelisib monotherapy. FCR was introduced on day 1 at standard dosing for up to 6 cycles as tolerated. Duvelisib was planned to continue for an additional two years of consolidation. The timepoints analyzed in this study were Screen, Cycle 1 Day 1 (C1D1; after one week of duvelisib monotherapy), Cycle 3 Restage (C3R) and 6 months post FCR. Patient data were analyzed based on grade of toxicity, with a particular focus on grade 3 or higher irAEs in the first 3 months of therapy (transaminitis and colitis), as opposed to later or no toxicity. Toxicities were graded according to the Common Terminology Criteria for Adverse Events version 4.038. The study was approved by the Dana-Farber Harvard Cancer Center Institutional Review Board and all subjects signed written informed consent (NCT02158091).
Mass Cytometry (CyTOF)
We built a 39-antibody CyTOF panel to evaluate T cell subsets (Supplementary Figures 2–3) and performed CyTOF on a sub cohort of 16 patients treated on the dFCR study, 10 patients with autoimmune toxicity and 6 without toxicity. B cell depletion using B cell depleting magnetic beads (Stemcell Cat #17854) was performed prior to staining based on WBC; if WBC was lower than 10K / μL, then no B cell depletion was done. Between 0.5 and 2.0 × 10⁶ cells of each sample were used for CyTOF antibody stains after resting for one hour and were stained in batches at room temperature with a mixture of samples with and without toxicity. The samples were spun down and aspirated. 5 μM of cisplatin viability staining reagent (Fluidigm #201064) was added for two minutes and then diluted with culture media. Cells were fixed with 0.4% paraformaldehyde made from a 16% stock (Fisher Scientific #O4042–500) diluted in PBS for 5 minutes. After centrifugation, Human TruStain FcX Fc receptor blocking reagent (BioLegend #422302) was used at a 1:100 dilution in CSB (PBS with 2.5 g/L bovine serum albumin [Sigma Aldrich #A3059] and 100 mg of sodium azide [Sigma Aldrich #71289]) for 10 minutes followed by incubation with conjugated surface antibodies (each marker was used at a 1:100 dilution in CSB, unless stated otherwise (Supplementary Figure 2)) for 30 minutes. All antibodies were obtained from the Harvard Medical Area CyTOF Antibody Resource and Core (Boston, MA).
For intracellular stains, 16% stock paraformaldehyde dissolved in PBS was used at a final concentration of 4% for 10 minutes to fix the samples before permeabilization with the FoxP3/Transcription Factor Staining Buffer Set (ThermoFisher Scientific #00-5523-00). The samples were incubated with SCN-EDTA coupled palladium based barcoding reagents for 15 minutes and then combined into a single sample tube9. Conjugated intracellular antibodies (each marker was used at a 1:100 dilution in permeabilization buffer, unless stated otherwise) were added into each tube and incubated for 60 minutes. Cells were then fixed with 4% formaldehyde for 10 minutes.
Before samples were acquired on a Helios CyTOF Mass Cytometer (Fluidigm), DNA was labeled for 20 minutes with an 18.75 μM iridium intercalator solution (Fluidigm #201192B), to identify single cell events. Samples were subsequently washed and reconstituted in Cell Acquisition Solution (Fluidigm #201237) in the presence of EQ Four Element Calibration beads (Fluidigm #201078) at a final concentration of 1×10⁶ cells/mL. Samples were acquired using the wide bore (WB) injector.
Analysis of Mass Cytometry Samples
The raw FCS files were normalized to reduce signal deviation between samples over the course of multi-day batch acquisitions, utilizing the bead standard normalization method established by Finck et al10. The normalized files were then uploaded to Cytobank for cleanup based on Gaussian parameters as outlined in a modified version of the 2017 Bagwell11 method. The cleaned-up files were compensated with a panel specific spillover matrix to subtract cross-contaminating metal isotope signals using a CyTOF-based compensation method established by Chevrier et al12. These compensated files were then deconvoluted into individual sample files using a single-cell based debarcoding algorithm established by Zunder et al9. From there, the data were uploaded to Cytobank for bead removal, singlet identification and live cell gating. These live cells were equal sampled to the minimum event count of the samples (if the sample had more than 2000 events remaining), and viSNEs (visual Stochastic Network Embedding) were run on all markers in the overall live cells and the CD3+ cells allowing for two dimensional visualization of the high dimensional data based on the recommendations outlined by van der Maaten13. The viSNE algorithm uses each cell’s marker expression to group it with similar cells and plot these groups on a two-dimensional graph where similar cells are closer together. The viSNE parameters were then used for a density-based clustering based on Rodriguez and Laio14 using the ClusterX implementation from Chen et al15. The event counts of these cell clusters were exported and analyzed using the quasi-likelihood negative binomial generalized log-linear model as implemented in Bioconductor library edgeR16. The cell phenotype in a significant cluster was identified using marker expression heatmaps and marker expression fold change bar graphs. In this analysis, Tregs were defined as CD4+ CD127lo FoxP3+ CD39+ Helios+, and Th17 cells as CD4+ RORγT+.
Manual gating of CyTOF data
After gating on CD3+ single viable cells, CD4 and CD8 were separately gated. After gating on CD4+ cells, naïve CD4 T cells were defined as CD45RA+ CD45RO− CCR7+. After gating on CD8+ cells, naïve CD8s were defined as CD45RA+ CD45RO− CCR7+. After gating on CD4+ cells, Tregs were defined as CD127lo CD25hi17. After gating on CD4+ T cells, Th17s were defined as RORγT+18.
For additional methods, please see the Supplement.
Results:
Patient characteristics
The characteristics of the patients on this trial have been previously described8. Sixteen patients were studied by CyTOF and 26 patients by Luminex for cytokine results (Supplementary Figure 1). Patients studied by CyTOF represented the extremes of toxicity (severe vs absent), but were representative of the overall study population, previously untreated for CLL and with a median age 55. Unmutated IGHV was present in 56%, and one patient had 17p deletion without TP53 mutation. As expected, overall T cell numbers declined significantly in patients treated with dFCR, as reflected in serial CD4 count data, shown in Supplementary Figure 4.
Overall immune landscape and cluster identification by CyTOF
To determine the immune phenotype differences between pre- and post-treatment PBMC samples in patients who did or did not develop irAEs, we used CyTOF technology to profile serial PBMC samples from 16 patients at screen (n = 16), C1D1 (n = 16), C3R (n = 14), and 6 mo post FCR (n = 6). The absolute number of CD20lo CD3hi cells studied per patient and timepoint is indicated in Supplementary Table 1. Unsupervised analysis of the CyTOF staining data identified 41 clusters of cells with similar phenotypes after doing equal sampling on all patients and all sample timepoints (Figure 1A). The phenotype of each cluster is provided in Supplementary Table 2. Based on the expression of antibody markers, all 41 clusters were broadly assigned to 8 islands, or major phenotypes, belonging to CD4 T, CD8 T, Tregs, Th1, Th17, double positive T (DP T), double negative (DN T) and non-T cell subsets (Figure 1B). We focused initially on the clusters significantly altered in patients with toxicity at the C3R timepoint, since this coincided with the timing of many severe irAEs, approximately 3 months after initiation of therapy. We found five significantly altered T cell clusters specifically in patients with toxicity, as well as three altered in patients both with and without toxicity (Supplementary Table 3, Figure 1C). The clusters altered only in patients with toxicity, namely c1, c3, c6, c24, and c38, are spatially distinct as shown in the viSNE plot, with c1 and c3 belonging to the CD4 T cell island whereas c6, c24 and c38 belong to the CD8 T cell island. The clusters altered in both sets of patients, namely c7, c15, and c34, are all in the CD8 cluster (Figure 1C).
Figure 1. Overview of CyTOF Data from all Patients.
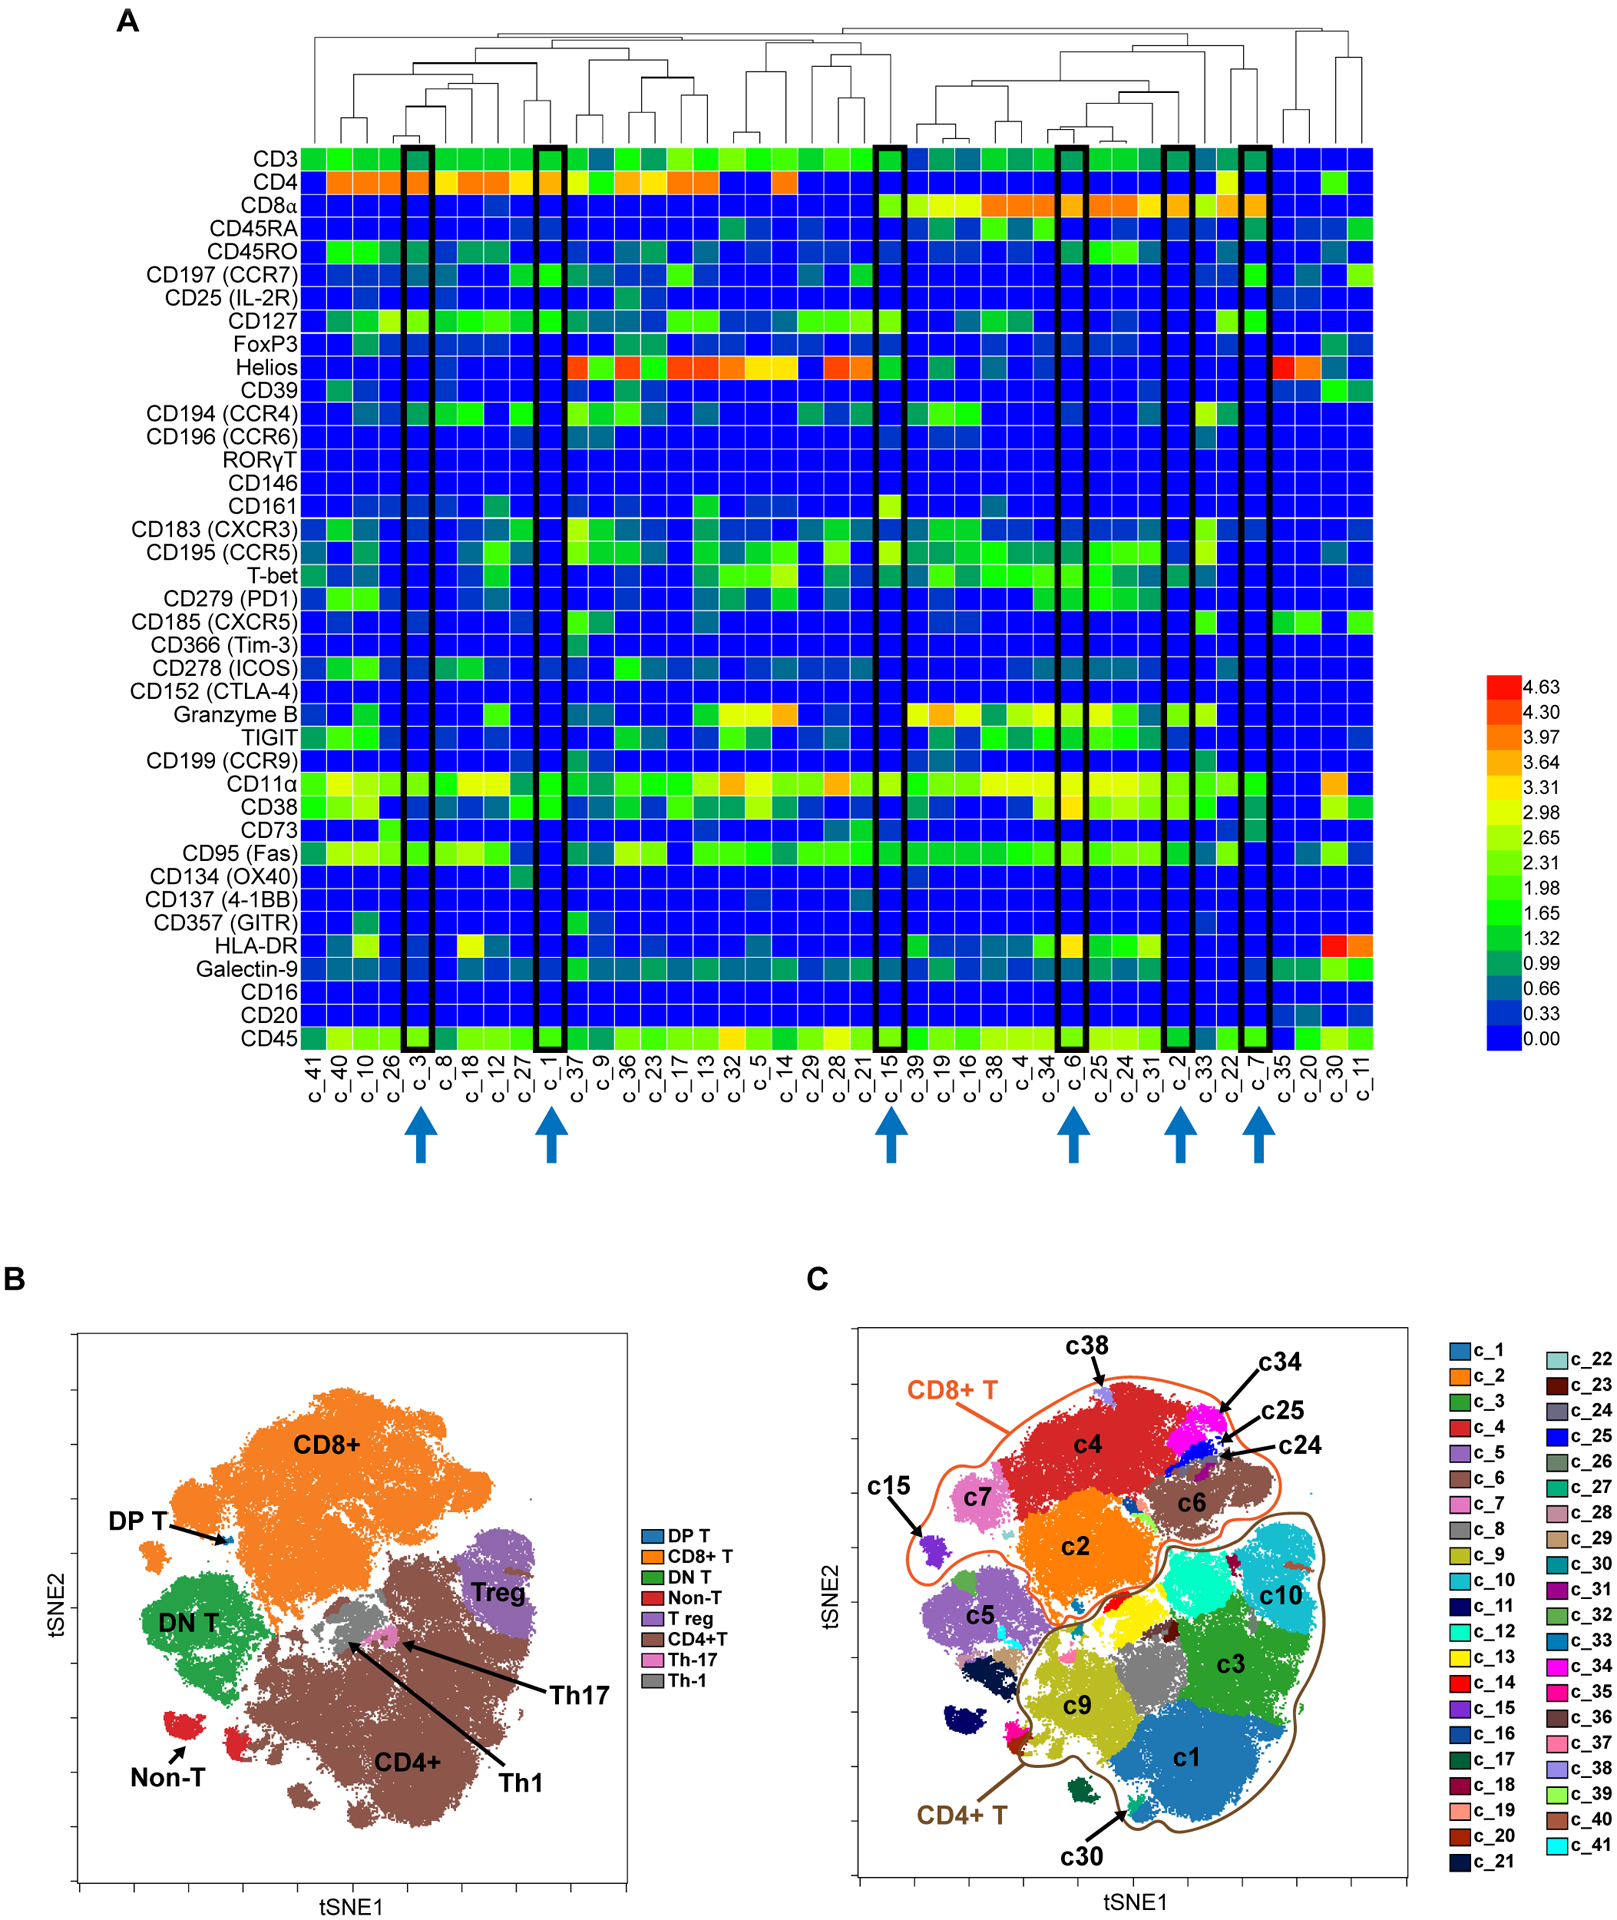
A. Unsupervised clustering of CyTOF data from all patients studied (N=16) identifies 41 separate clusters of cells with similar phenotypes in the dFCR cohort. Highlighted in black boxes are the most significantly altered clusters featured later in the manuscript. Values are Arcsinh transformed calculated mean marker expression in a given cluster. B. Using viSNE dimensionality reduction to visualize high dimensional data in 2 dimensions, with eight major phenotypic islands identified. tSNE=t-distributed stochastic neighbor embedding. DP=double positive; DN=double negative. C. Detail of the subdistribution of individual clusters discussed in the manuscript, among the major islands, across all patients studied. CD8+ T cells are circled in orange, and CD4+ T cells circled in brown.
In the first week of duvelisib monotherapy, fewer changes were seen, but we did see c9, a CD4 cluster with high expression of many chemokine receptors, specifically elevated in patients without toxicity at screen and C1D1, while c38, a naïve CD8 cluster, was specifically elevated in patients with toxicity (Supplementary Table 3 and Supplementary Figure 5, Figure 1C). Cluster 15 is elevated in both groups at screen and C1D1, with a greater decrease at C3R in toxicity patients, while c10 increases at C1D1 in both groups but more so in patients with toxicity (Figure 1C).
Changes in specific CD4 and CD8 T cell subsets associated with toxicity on dFCR
In our cohort, for patients with significant immune toxicity, we found that within CD3+ T cells, both naïve CD4 (cluster 1) and memory CD4 (cluster 3) T cells, as well as naïve CD8 T cells (cluster 7), were significantly decreased at C3R (Supplementary Table 3, Figure 2A–B). Decreases in naïve CD4 and CD8 T cells are not directly associated with an autoimmune response but could imply that the naïve T cells are differentiating into another T cell subset leading to an autoimmune response. These findings are illustrated visually in Figure 2B, showing serial viSNEs from prior to therapy, after one week of duvelisib monotherapy and at C3R. The patients with toxicity show clear development of an activated CD8 T cell population expressing granzyme B, seen in clusters 6, 2, 24 and 34 at C3 restage, likely reflecting the effector cells driving toxicity (Figure 2A–B). In contrast, no significant changes were seen with clusters 6, 2 or 24 in our no toxicity patient cohort, but c34 did increase in this cohort as well (Figure 2A, 2C). While cluster 2 analyzed individually showed a borderline significant change (Supplementary Table 3), it showed a very significant difference between patients with toxicity and those without (Supplementary Table 4, Figure 2A).
Figure 2. Overview of Changing T Cell Clusters in Patients with and without Toxicity.
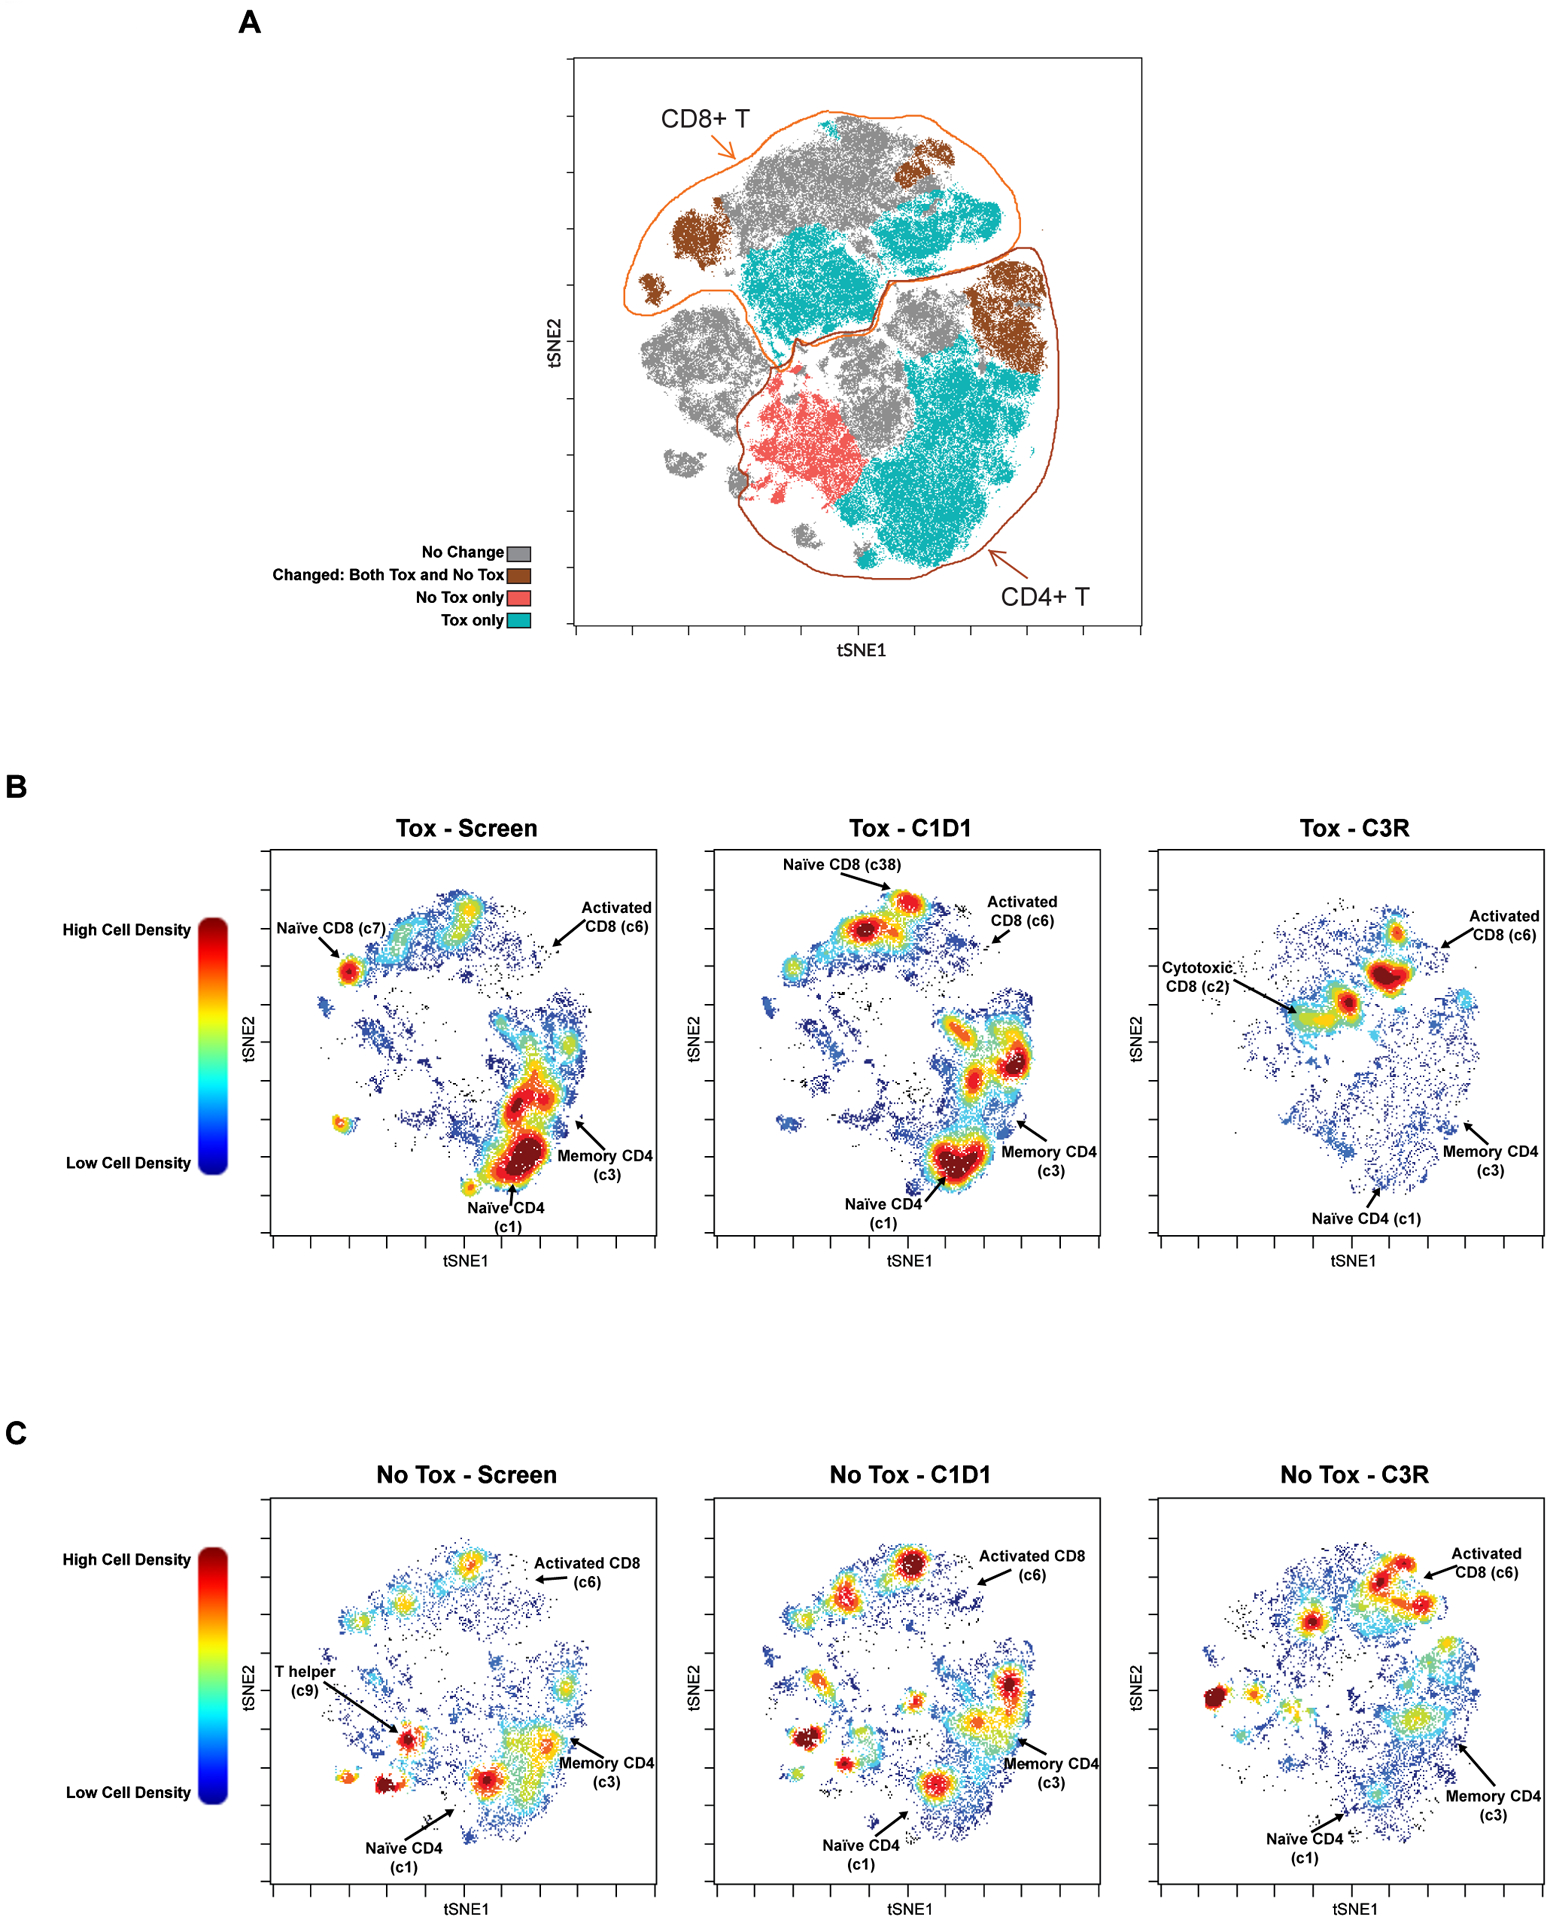
A. viSNE plot highlighting the major clusters that are changed in patients with and without toxicity (brown); only in those with toxicity (aqua); only in those without toxicity (red); or unchanged by treatment (gray). Tox=patient subgroup with autoimmune toxicity; No Tox=patient subgroup without autoimmune toxicity. B-C. viSNE plots showing pre and post treatment T cell cluster changes with dFCR, comparing screen, C1D1 and C3R, between patients with (B; N=7) and without (C; N=4) toxicity. Selected clusters showing significant differences are labelled. Plots are colored by relative cell density with red representing more cells and blue representing fewer cells.
We sought to further characterize the cell populations found to be significantly different in the toxicity patients. We first focused on the CD4 clusters, 1 and 3 (Figure 3A). An in-depth analysis of these clusters shows the presence and absence of markers to corroborate the heatmap data. Cluster 1 shows high expression of CCR7, CD4, CD127, CD45RA, CD3 and CD25 giving it a characteristic naïve CD4 phenotype (Figure 3A). Cluster 3 is comprised of CD127, CD4, CCR9, CD45RO, CD25, CCR4 antibody markers indicating a CD4 central memory phenotype (Figure 3A). We observe a decrease in both these clusters (naïve and central memory) with treatment at C3 restage in our patients developing toxicity. Most of this decrease in Cluster 3 occurs during the week of duvelisib monotherapy, while Cluster 1 decreases during monotherapy and even more after the addition of chemotherapy.
Figure 3. Decrease in Naïve CD4 and Central Memory CD4s in Patients with Toxicity.
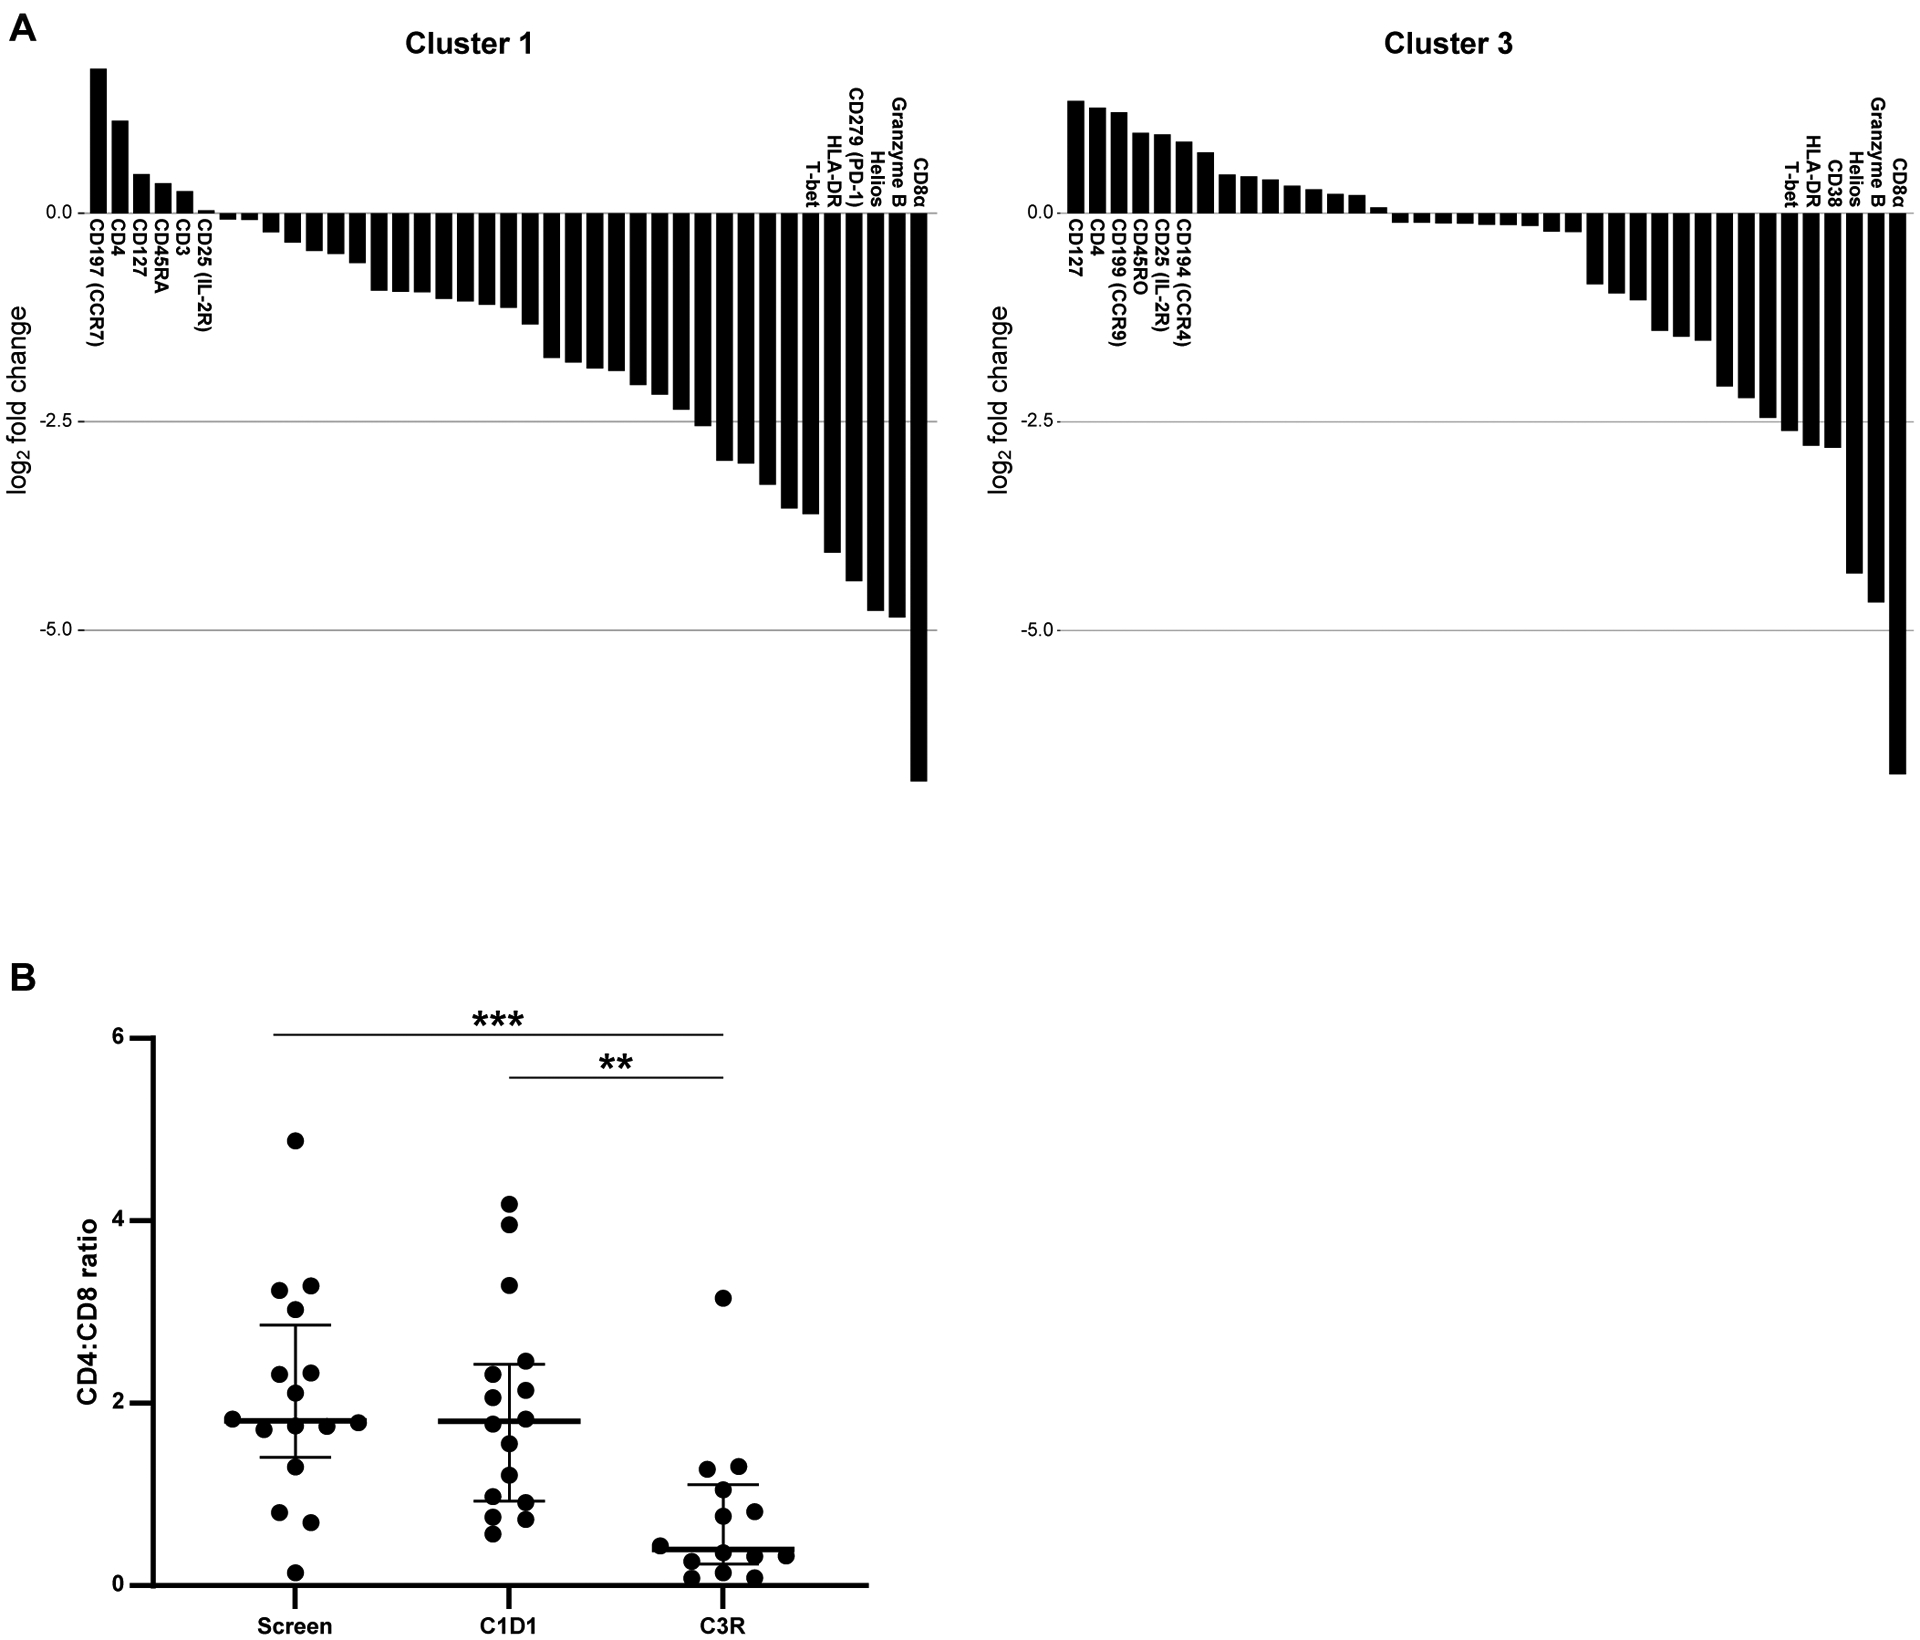
A. Six most and least enriched markers defining cluster 1 and cluster 3. B. CD4:CD8 ratio between tox and no tox patients, between screen and C3R. ** p≤ to 0.01; *** p≤ to 0.001.
To further confirm these findings from the clustering algorithm, we performed manual gating on all our samples at all timepoints. Consistent with the clustering data, we found that naïve CD4 T cells (CD45RA+ CD45RO− CCR7+) decrease at the C3 restage timepoint in patients who develop toxicity whereas the decrease was not significant in the patient cohort without toxicity (Supplementary Figure 6A). The reduction in CD4 T cells across all samples were most likely due to chemoimmunotherapy treatment (Supplementary Figure 6B). The CD4:CD8 ratio (Supplementary Figure 6C) also shows a significant decrease in all patients at C3 restage, which is driven by the change in patients with toxicity but not significant in patients without toxicity (Figure 3B).
To further elucidate the inversion of the CD4:CD8 ratio, we analyzed clusters 6 and 2 in particular, the large clusters of activated CD8 T cells that increase with treatment selectively in patients with toxicity (Figures 2A, 4A). Together with the decrease in the CD4 T cell clusters (clusters 1 and 3), these findings likely contribute to the inversion of the CD4:CD8 ratio. Cluster 6 expresses HLA-DR, CD38, PD1, T-bet, CD8a, and granzyme B, giving it an activated CD8 phenotype. Clusters 24 and 34 are small clusters with similar activated CD8 phenotype, also increasing at C3R (Supplementary Figure 7). Cluster 2 expresses CD8a, CD16, CD38, granzyme B, T-bet and RORγT, consistent with an activated effector CD8 T cell with Th17 differentiation. During therapy, we observe a migration of cluster 7 to cluster 6 (Figure 2A, 4A), implicating the conversion of naïve CD8 (cluster 7: positive for CD8a, CCR7 and CD45RA) to activated CD8 cells during therapy. Consistent with this observation, another large cluster of naïve CD8 T cells, cluster 4, positive for CD8, granzyme B, T-bet, CD16, CD45RA, and TIGIT, indicative of a naïve effector CD8 T cell phenotype (Supplementary Figure 7), also decreases with therapy. Quantification of total CD8 T cells using manual gating shows a significant increase in the entire study population at C3R (Figure 4B), more significant in the toxicity patients (Supplementary Figure 8A). Manual gating also confirms the decrease in naïve CD8 T cells (CD45RA+ CD45RO− CCR7+) at C3 restage as shown in Figure 4C, with lower baseline levels in patients without toxicity (Supplementary Figure 8B). This increase in activated CD8 T cells is likely contributing to duvelisib toxicity and is consistent with what has been observed in model systems with the added effect of PI3Kγ inhibition.
Figure 4. Increase in Activated CD8 T cells, Activated Th17 CD8 T cells and Decrease in Naïve CD8s identified in Patients with Toxicity.
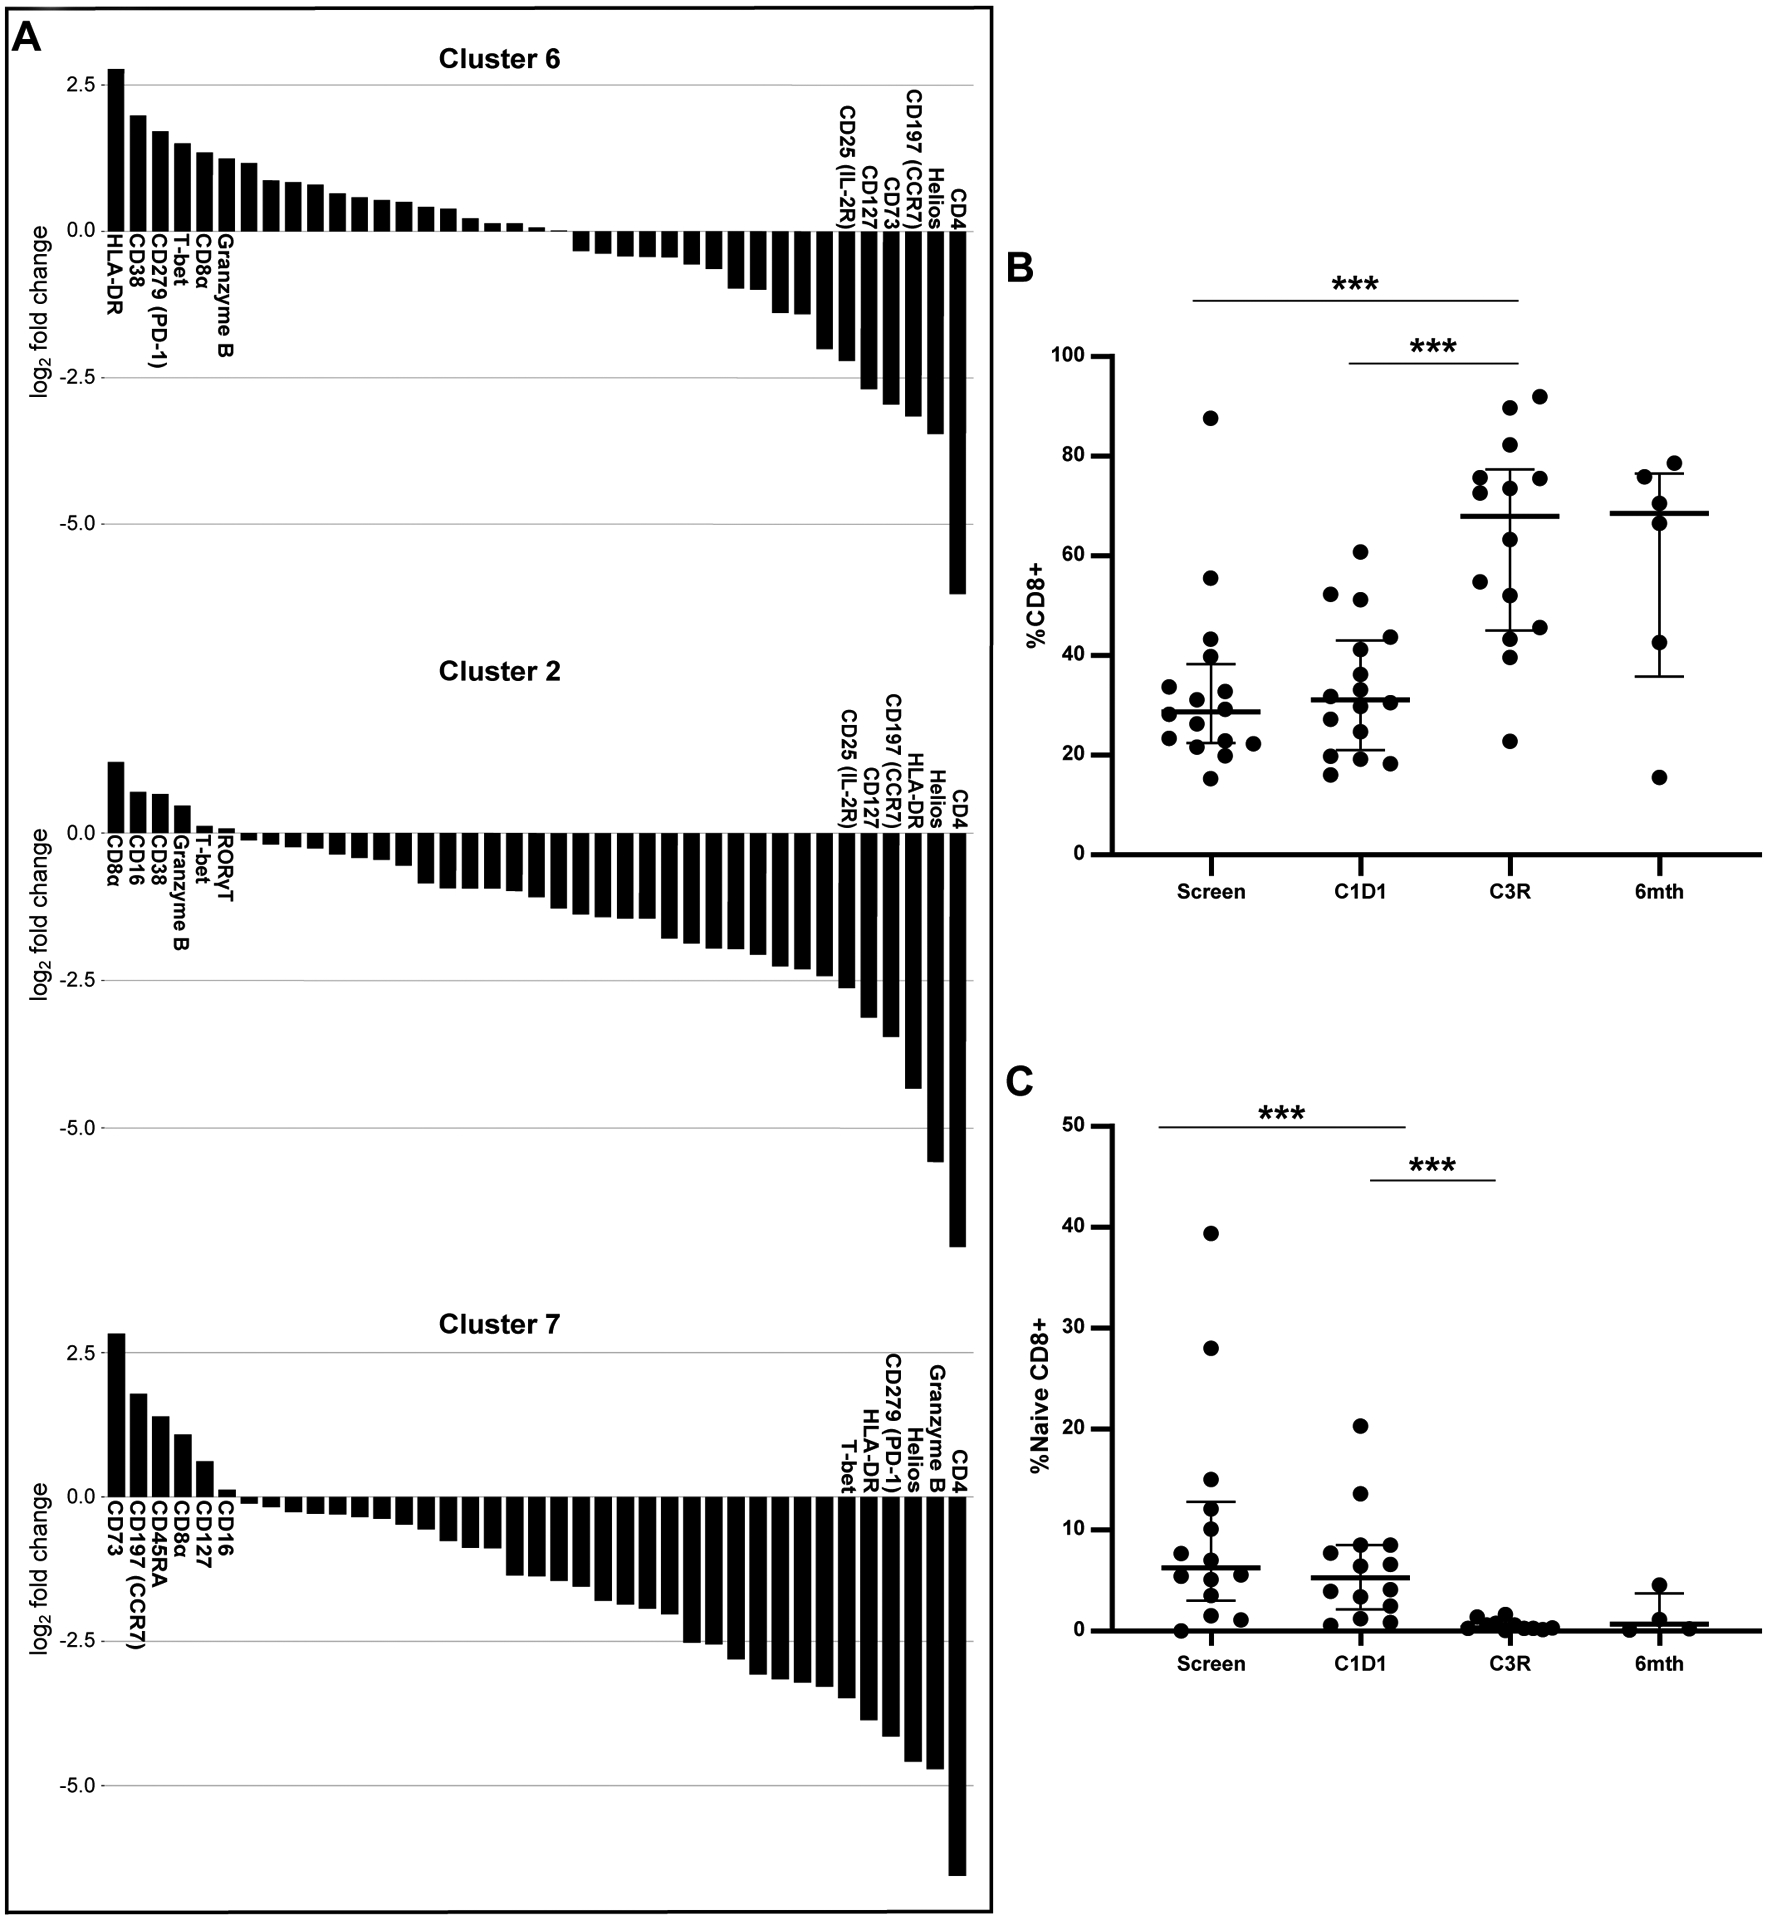
A. Six most and least enriched markers defining cluster 6, activated CD8 T cells; cluster 2, activated Th17 CD8 T cells; and cluster 7, naïve CD8s. B. Change in total CD8s across all patients over time. C. Change in naive CD8s across all samples over six months. *** p≤ to 0.001.
Changes in Th17 and Treg cell subsets during duvelisib FCR therapy
We have previously demonstrated that increased activation of the Th17 pathway is associated with the autoimmune toxicity of idelalisib treatment in previously untreated patients19. Given those findings and the interesting above observation that a significantly increased CD8 cluster in this cohort shows Th17 differentiation specifically in patients with toxicity, we further evaluated the impact of duvelisib on Th17 subsets. The transcription factor regulating Th17 differentiation is RORγT. Consistent with the idelalisib data, with dFCR treatment, RORγT+ (Th17) CD4 T cells increased significantly with treatment at C3 restage and 6 mos post FCR in the entire cohort (Figure 5A), primarily driven by a significant change in the cohort with toxicity (Supplementary Figure 9A). Interestingly, a cluster of CD161, CD8 positive T cells (c15, Figure 5B) is elevated at screen in patients with toxicity compared to those without and is depleted over time selectively in patients with toxicity. This cluster has similar properties to a previously described CD8 population which is activated, shows Th17 differentiation and is tissue homing in the setting of chronic inflammation20. Its enrichment at baseline in patients who go on to develop toxicity, and its decrease at the time of toxicity, is suggestive of tissue migration resulting in inflammation and toxicity in these patients.
Figure 5. Changes in Th17s and Tregs with dFCR Treatment as shown with Mass Cytometry.
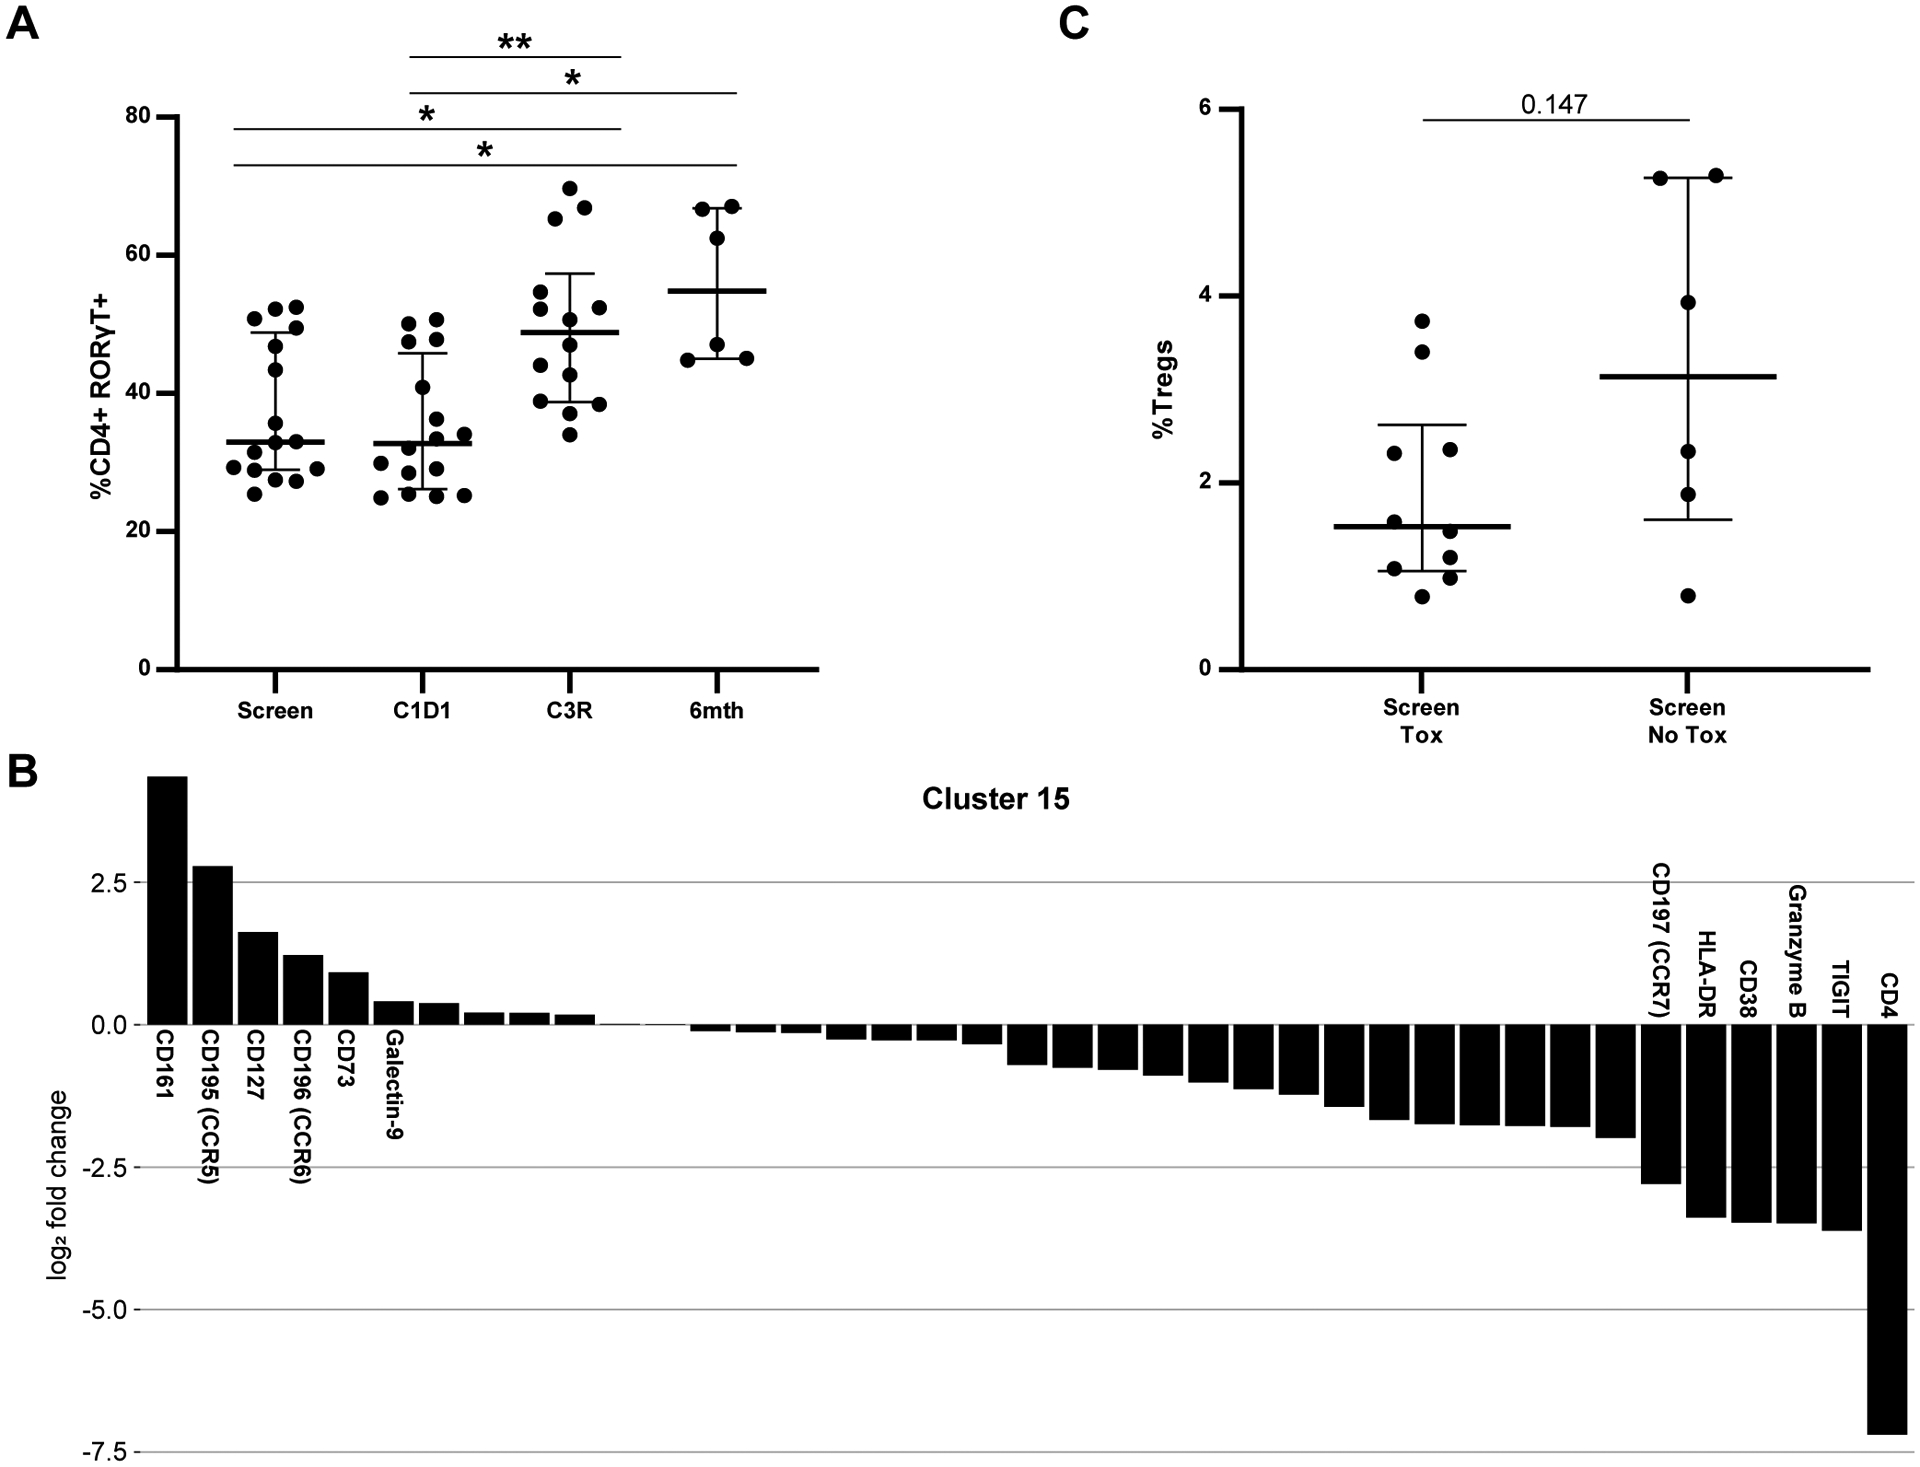
A. Change in CD4+ RORγT+ cells over time in the entire population. B. Markers driving clustering for c15, a Th17 phenotype CD8. C. %Tregs at screen comparing patients with and without toxicity. * p≤ to 0.05; ** p≤ to 0.01.
In our prior work with idelalisib, we found that Tregs decrease during therapy, so we assessed changes in Tregs in the dFCR patients. Lower baseline Tregs (CD4+ CD25hi CD127lo) were observed at screening in patients developing toxicity compared to those without (Figure 5C). Interestingly, in this patient population we saw an increase in Tregs at C3R, which was associated with granzyme B expression that was more significant in patients with toxicity (Supplementary Figure 9B, 9C). Granzyme B expressing Tregs are known to be both activated and more prone to apoptosis than non-granzyme B expressing Tregs, and have been associated with renal allograft rejection21, suggesting that they may also be implicated in the inflammatory process in this setting.
Duvelisib FCR treatment decreases pro-inflammatory cytokines in patients without toxicity
These data show that duvelisib can cause an imbalance of T cell subsets toward a more inflammatory phenotype in vitro, with increased activated CD8s, increased activated and apoptotic Tregs, reduced CD4s and increased Th17s defined by CD4+ RORγT+ expression. To test whether this inflammatory phenotype was also manifested in circulating cytokine levels, a Luminex panel of 35 pro-inflammatory cytokines was used to measure cytokine levels in patient serum samples at screen, C1D1, C3 restage and 6-month post FCR timepoints. As shown in Figure 6, six cytokines (IL-17A, IFNγ, IL-21, TNFα, IL-1RA and Tweak) showed a significant difference during therapy between the toxicity and no toxicity groups. These pro-inflammatory cytokines decreased with treatment in patients without toxicity, but showed no change or increase in patients who developed toxicity. We found no significant differences in the remaining 29 cytokines between patients in the toxicity or no toxicity groups (Supplementary Figure 10).
Figure 6. Pro-Inflammatory Cytokines Decrease with Treatment in Patients without Toxicity on dFCR treatment.
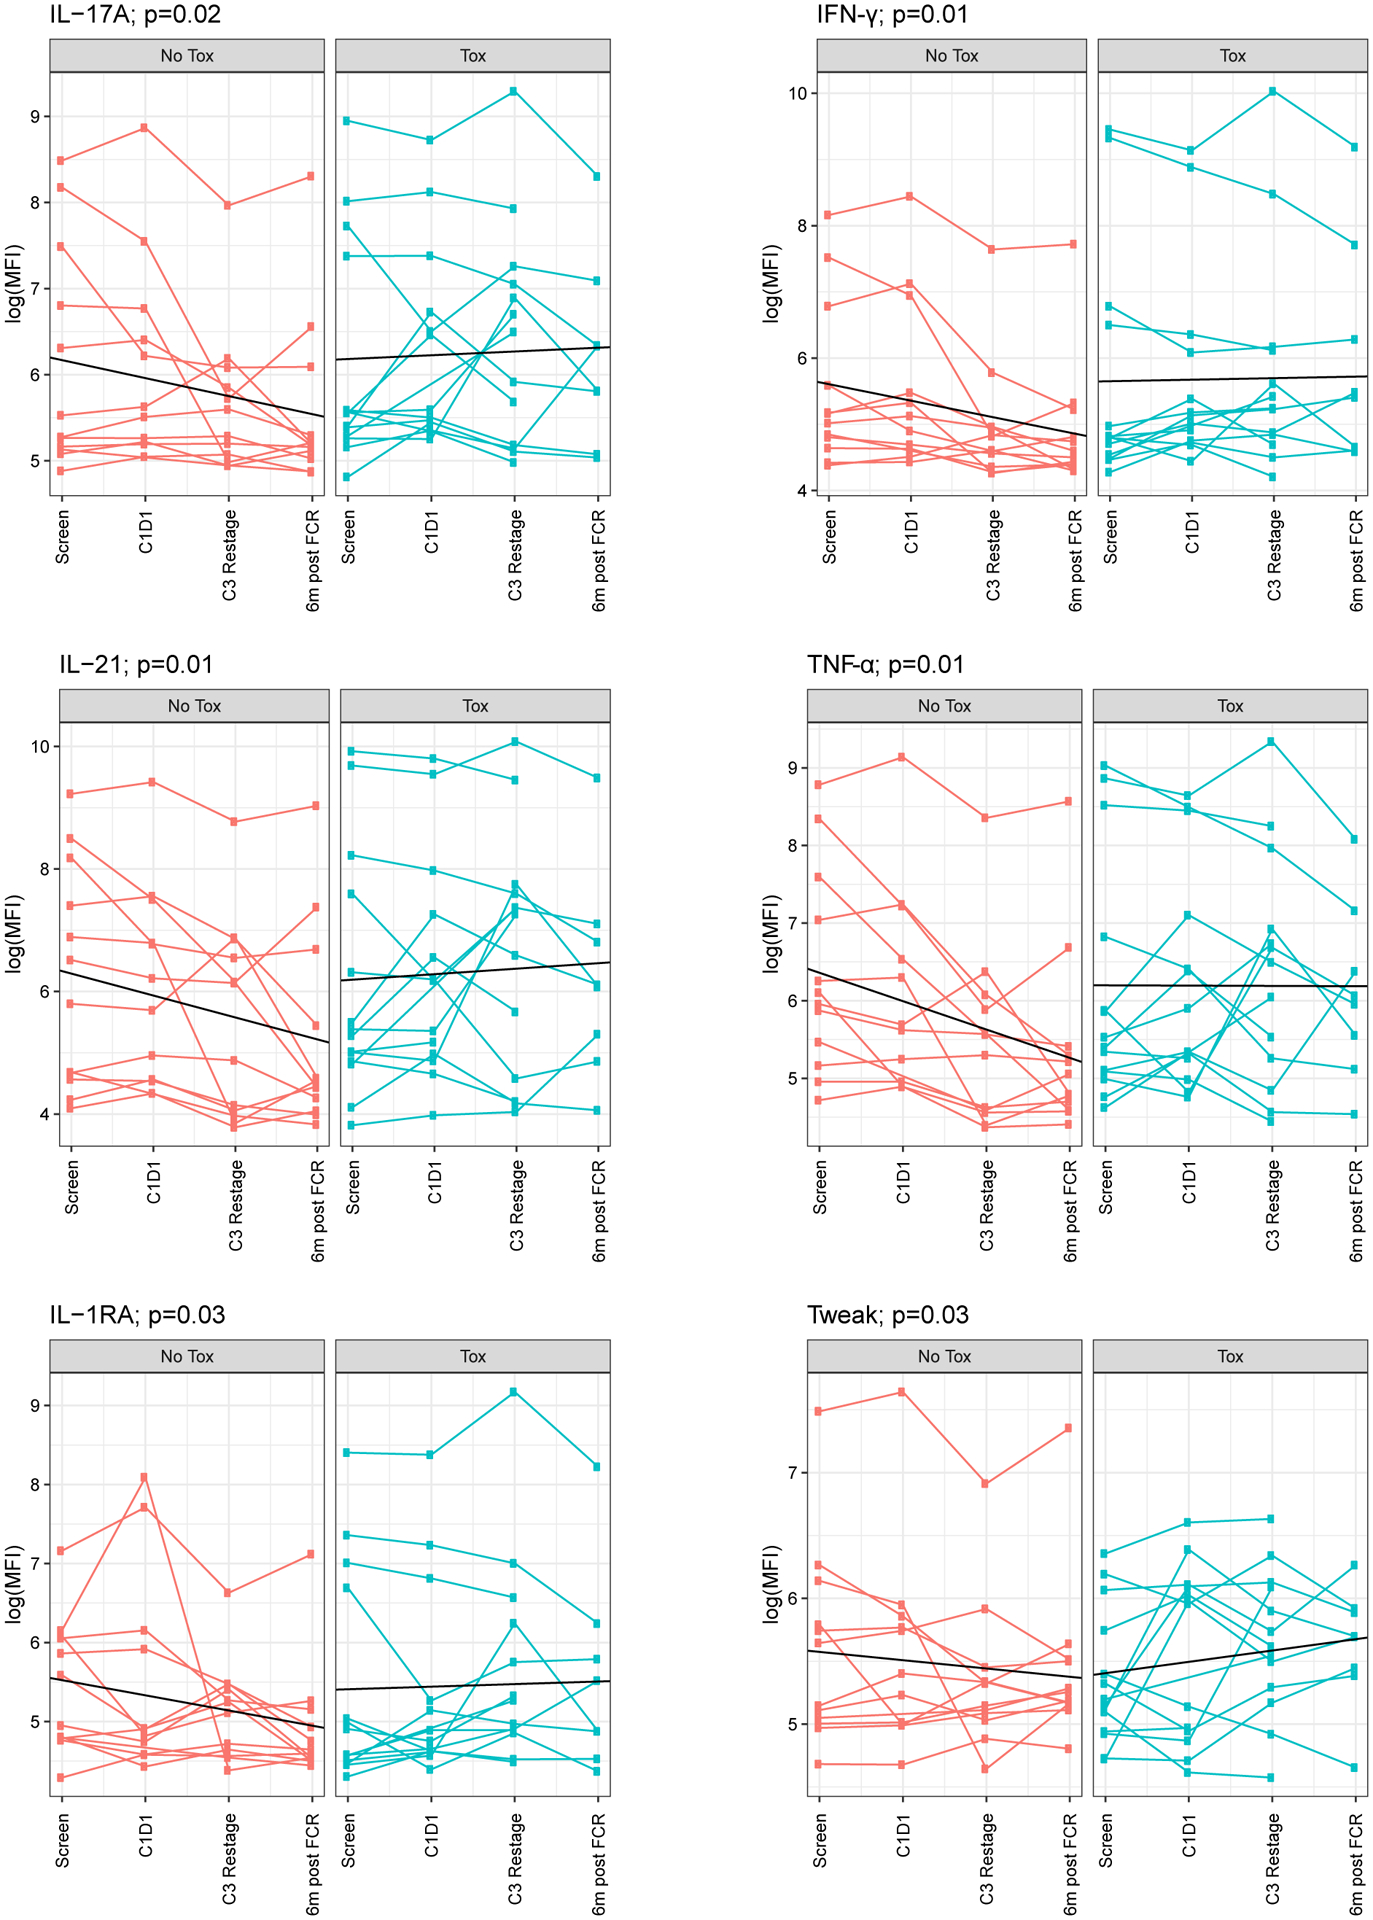
IL-17A, IFNγ, IL-21, TNFα, IL-1RA and Tweak were statistically significantly different between tox and no tox groups.
CLL disease features associate with duvelisib toxicity
Finally, we sought to investigate whether any baseline disease features of the CLL patients or cells were associated with the development of duvelisib toxicity. No significant differences were seen based on IGHV; TP53 aberrancy; other FISH abnormalities; Rai stage; age at diagnosis or enrollment; white blood cell count, lymph node or bone marrow disease burden at enrollment; best radiographic response or achievement of undetectable MRD. We investigated the susceptibility to apoptosis of the CLL cells from 12 patients at baseline and after one week of duvelisib treatment (N=8 with autoimmune toxicity, N=4 without toxicity) using BH3 profiling, a functional assay to detect the proximity of a cell to the threshold of apoptosis (priming). Interestingly, patients with higher baseline priming for apoptosis in their CLL cells (by both BIM and PUMA) were more likely to develop immune toxicity (Figure 7A), and after the 1-week lead-in, these patients had a significant decrease in priming compared to patients without toxicity (Figure 7B).
Figure 7. CLL Cells from Patients with Toxicity Show Increased Priming at Baseline, with a Decrease after 1 Week of Duvelisib.
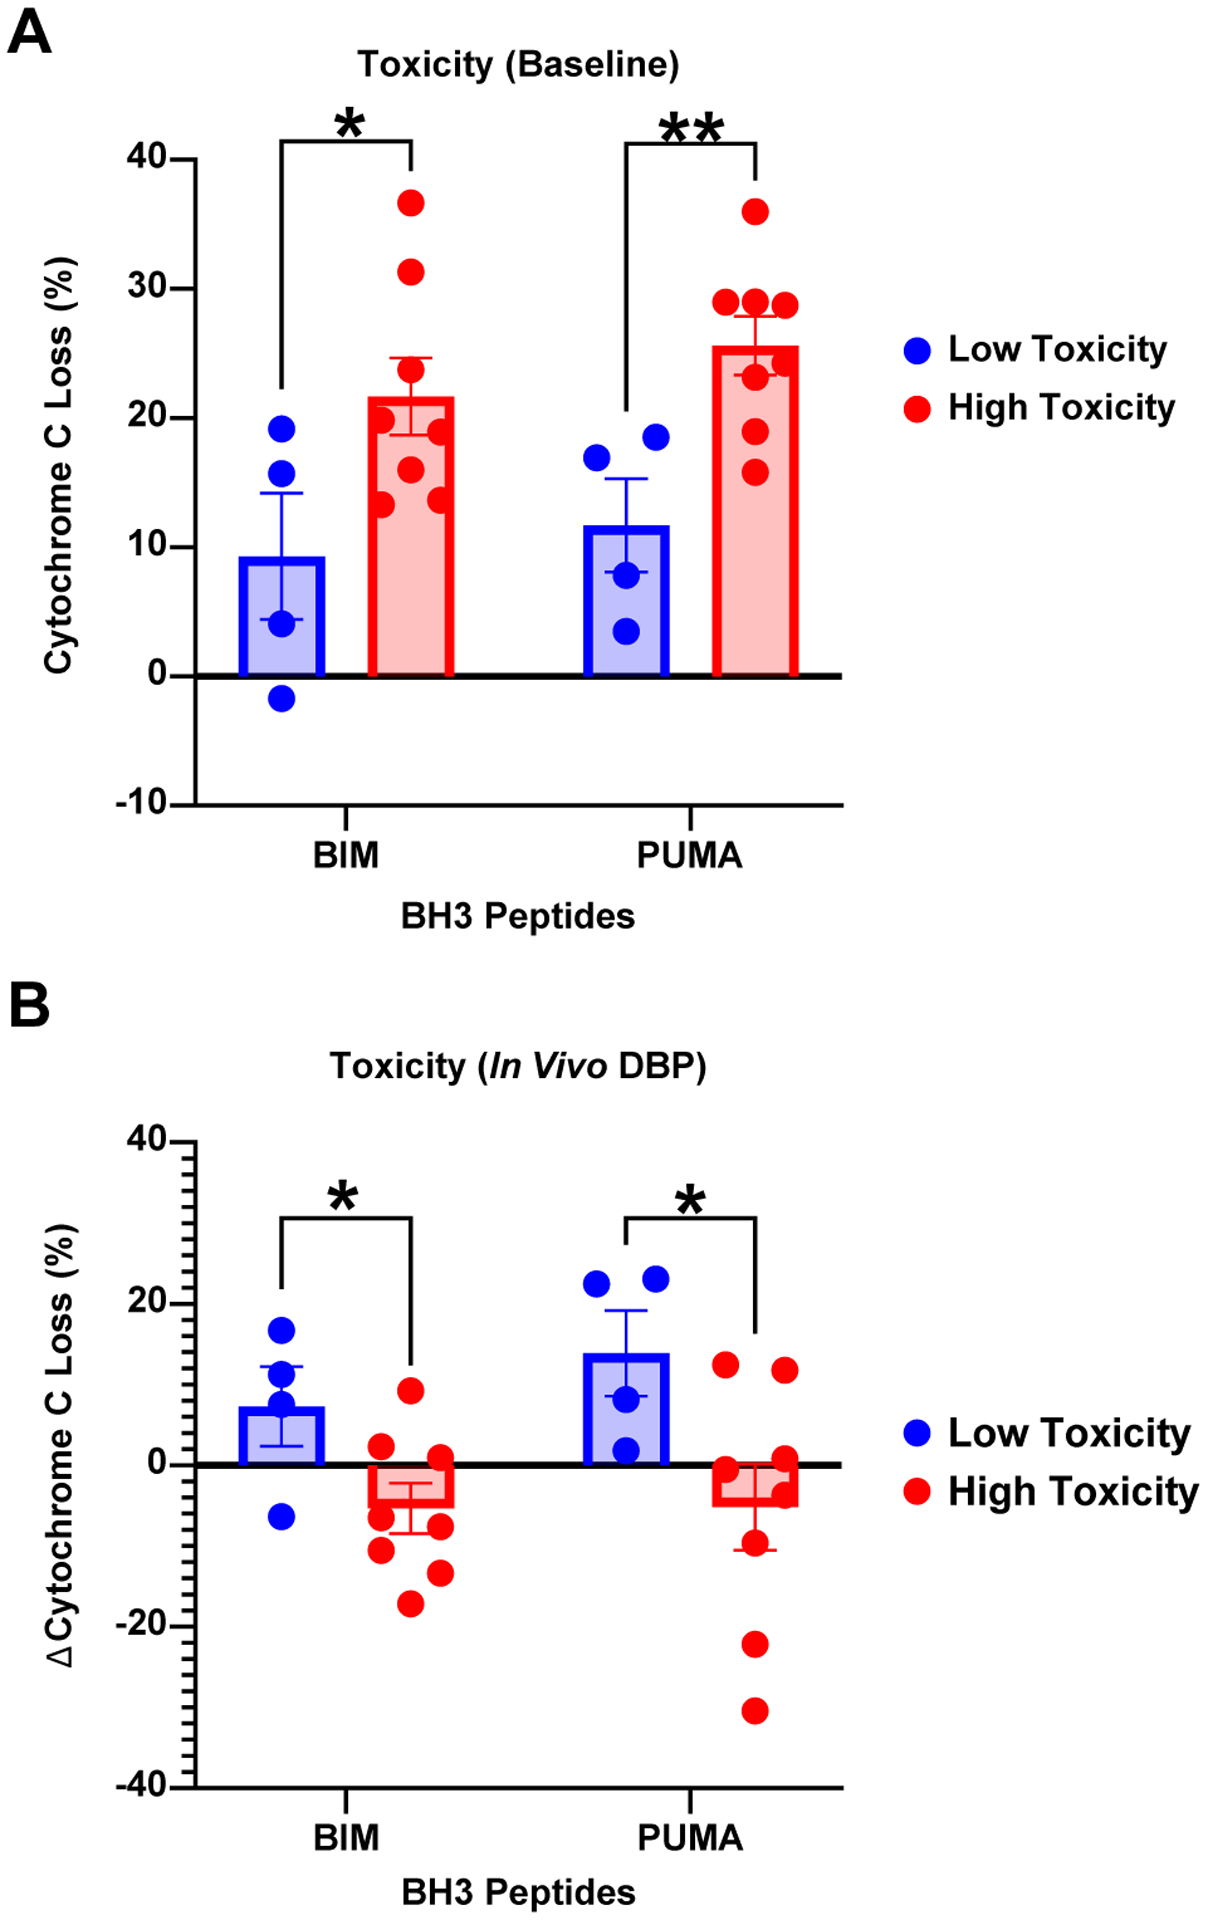
BH3 profiling on dFCR patients with (N=8) and without autoimmune toxicity (N=4), at baseline (A), and after 1 week of duvelisib therapy (B). BIM and PUMA BH3 peptides (x-axis) independently assess priming for apoptosis, and delta cytochrome C loss (y-axis) represents the degree of mitochondrial outer membrane permeabilization. * p<0.05; ** p<0.01.
Discussion:
Duvelisib is a potent, oral p110δγ inhibitor with efficacy in relapsed refractory CLL patients and in combination with FCR in our recent trial in previously untreated CLL8. The ability to deliver PI3K inhibitor therapy has been limited by autoimmune toxicity, the mechanisms of which are incompletely understood. We show here that dFCR treatment in an upfront setting modulates both CD4 and CD8 T cell subsets as well as pro-inflammatory cytokines in correlative samples banked from patients on therapy. Naïve CD4 T cells, memory CD4 T cells, naïve CD8 T cells, and Th1 CD4 T cells all decrease with treatment, while activated CD8 T cells, granzyme positive Tregs, Th17 CD4, and CD8 T cells all increase with treatment. Cytokines associated with Th17 activation (IL-17A and IL-21) are also relatively elevated in patients with toxicity. At baseline we found a trend toward lower Tregs in patients who went on to develop autoimmune toxicity. We therefore conclude that an increase in activated CD8 T cells and Th17 T cells with treatment in the context of lower baseline Tregs in some patients is associated with duvelisib-related toxicity.
Duvelisib was given as a single agent for one week, allowing us to isolate the effect of duvelisib alone. Out of the 41 clusters identified using CyTOF, we found significant changes in naïve CD4 and CD8 T cells in patients who developed toxicity, as CD4s decreased while naïve CD8s increased during duvelisib monotherapy. While the decrease in naïve CD4 T cells is not directly associated with an autoimmune response, it may imply that naïve CD4 T cells are trafficking from the bloodstream to affected tissues or are activated and differentiating into another CD4 T cell subset. The increased naïve CD8s appear to differentiate into activated memory CD8s by the subsequent timepoint, likely fueling autoimmune toxicity. We also observed a decrease in priming for apoptosis in the CLL cells of patients who went on to develop toxicity. These early effects of duvelisib in the toxicity-prone patients may suggest greater sensitivity of the T cells to the antiproliferative or immunomodulatory effects of duvelisib, combined with a greater resistance of the CLL cells. Greater activation or persistence of CLL cells has been associated with persistent immune dysfunction in CLL, which may explain how this finding could associate with autoimmune toxicity.
One of our key findings is that duvelisib was associated with a marked increase in CD8 T cells in patients both with and without toxicity. We have not previously seen this increase in patients treated with idelalisib, suggesting that this is a specific effect of PI3Kγ inhibition. Our data are in accordance with previous work by Kaneda et al., who found that PI3Kγ inhibition in macrophages led to increased total and CD8 T cell infiltration within tumors in mice6. Here we demonstrate increased CD8 T cells in peripheral blood; further work would be required to assess lymph node or tissue infiltration, although we see expression of tissue homing surface markers in this cell population. Interestingly, a subset of these CD8 T cells also demonstrate Th17-type differentiation. We also find that the cytokines most differentially expressed with toxicity are those associated with Th17 response, consistent with our prior observations with idelalisib22 and suggesting that Th17 activation is a significant contributor to PI3Kδ inhibitor-related toxicity.
Our observation that relatively low Tregs at baseline were associated with development of autoimmune toxicity is potentially consistent with our prior observations that a decrease in Tregs is associated with autoimmune toxicity with idelalisib. Here we actually observed an increase in Tregs in patients with toxicity, but this increase was associated with granzyme B expression, which has been associated with an activated pro-apoptotic phenotype in the setting of transplant rejection21. This Treg population is also similar to an activated, pro-apoptotic Treg population that we have previously identified and correlated with autoimmune toxicity in our idelalisib study23. Further work will be required to understand and characterize the nature of the Treg population at baseline and how it may be altered over time by duvelisib or idelalisib.
Here we show that duvelisib, like other PI3Kδ inhibitors, can cause pro-inflammatory immunomodulation and autoimmune toxicity in some patients, with activation of a Th17 phenotype. Distinct from idelalisib, in this cohort we see a significant increase in activated CD8 T cells, likely related to PI3Kγ inhibition, without reduction in T regs during therapy. Limitations of our study include the combination with FCR which makes it harder to isolate the effects of duvelisib, and the lack of tissue evaluation or functional T cell studies possible with the trial samples. Moving forward, development of biomarker signatures for toxicity, perhaps baseline Tregs, Th17 activation, naïve CD4 T cells, in combination with plasma cytokine levels, could help personalize CLL treatment with PI3Kδ inhibitors to avoid toxicity in patients. Our findings also set the stage for designing combination clinical trials that may preserve Treg numbers and function or inhibit pro-inflammatory Th17 responses in CLL patients.
Supplementary Material
Acknowledgements:
The authors thank all the patients who participated in this study and contributed their samples. The study is funded by NIH RO1 CA 213442 (PI: Brown, Jennifer) and Verastem Oncology. The study was funded by NIH RO1 CA 213442 (PI: Brown, Jennifer), Verastem Oncology (Brown, Jennifer), and NIH U01AI138318, P30AR070253, P30AR069625 (Lederer, James, A).
Competing Interests:
ET has received travel expenses and honorariums from Fluidigm and is a current employee of Fluidigm. TZL is a current employee of Casma Therapeutics. PA has served as a consultant for Merck, BMS, Pfizer, Affimed, Adaptive, Infinity, ADC Therapeutics, Celgene, Morphosys, Daiichi Sankyo, Miltenyi, Tessa, GenMab, C4, Enterome, Regeneron, Epizyme, Astra Zeneca, and Genentech; received research funding from Merck, BMS, Affimed, Adaptive, Roche, Tensha, Otsuka, Sigma Tau, Genentech, IGM, and Kite; and received honoraria from Merck and BMS. DCF served on the advisory board for Kyowa Kirin. JA served on the advisory boards for Regeneron and BMS/Celgene. MSD has received research funding from AbbVie, Ascentage Pharma, AstraZeneca, Genentech, MEI Pharma, Novartis, Pharmacyclics, Surface Oncology, TG Therapeutics, and Verastem; has served on the advisory board for AbbVie, Adaptive Biotechnologies, Ascentage Pharma, AstraZeneca, BeiGene, Celgene, Eli Lilly, Janssen, Pharmacyclics, Takeda, and TG Therapeutics; has served as a consultant for AbbVie, Adaptive Biotechnologies, AstraZeneca, BeiGene, Genentech, Janssen, Merck, Pharmacyclics, Research to Practice, Syros Pharmaceuticals, TG Therapeutics, Verastem, and Zentalis. JAL consults for Alloplex Biotherapeutics. JRB has served as a consultant for Abbvie, Acerta/Astra-Zeneca, Beigene, Bristol Myers Squibb/Juno/Celgene, Catapult, Dynamo, Eli Lilly, Genentech/Roche, Gilead, Janssen, Kite, Loxo, MEI Pharma, Morphosys AG, Nextcea, Novartis, Octapharma, Rigel, Pfizer, Pharmacyclics, Redx, Sun, Sunesis, TG Therapeutics, Verastem; received honoraria from Janssen and Teva; received research funding from Gilead, Loxo/Lilly, Sun and Verastem/SecuraBio, and TG Therapeutics; and served on data safety monitoring committees for Morphosys and Invectys. DG, AG, ST, ZW, VR, AV, SMF, BL, SPM, JHM, and OO have no COI to disclose.
References:
- 1.Lampson BL, Kasar SN, Matos TR, Morgan EA, Rassenti L, Davids MS, et al. Idelalisib given front-line for treatment of chronic lymphocytic leukemia causes frequent immune-mediated hepatotoxicity. Blood 2016. Jul 14; 128(2): 195–203. [DOI] [PMC free article] [PubMed] [Google Scholar]
- 2.Sharman JP, Coutre SE, Furman RR, Cheson BD, Pagel JM, Hillmen P, et al. Final Results of a Randomized, Phase III Study of Rituximab With or Without Idelalisib Followed by Open-Label Idelalisib in Patients With Relapsed Chronic Lymphocytic Leukemia. J Clin Oncol 2019. Jun 1; 37(16): 1391–1402. [DOI] [PMC free article] [PubMed] [Google Scholar]
- 3.Winkler DG, Faia KL, DiNitto JP, Ali JA, White KF, Brophy EE, et al. PI3K-delta and PI3K-gamma inhibition by IPI-145 abrogates immune responses and suppresses activity in autoimmune and inflammatory disease models. Chem Biol 2013. Nov 21; 20(11): 1364–1374. [DOI] [PubMed] [Google Scholar]
- 4.Flinn IW, Hillmen P, Montillo M, Nagy Z, Illes A, Etienne G, et al. The phase 3 DUO trial: duvelisib vs ofatumumab in relapsed and refractory CLL/SLL. Blood 2018. Dec 6; 132(23): 2446–2455. [DOI] [PMC free article] [PubMed] [Google Scholar]
- 5.Flinn IW, Miller CB, Ardeshna KM, Tetreault S, Assouline SE, Mayer J, et al. DYNAMO: A Phase II Study of Duvelisib (IPI-145) in Patients With Refractory Indolent Non-Hodgkin Lymphoma. J Clin Oncol 2019. Apr 10; 37(11): 912–922. [DOI] [PubMed] [Google Scholar]
- 6.Kaneda MM, Messer KS, Ralainirina N, Li H, Leem CJ, Gorjestani S, et al. PI3Kgamma is a molecular switch that controls immune suppression. Nature 2016. Nov 17; 539(7629): 437–442. [DOI] [PMC free article] [PubMed] [Google Scholar]
- 7.Brown JR, Zelenetz A, Furman R, Lamanna N, Mato A, Montillo M, et al. Risk factors for grade 3/4 transaminase elevation in patients with chronic lymphocytic leukemia treated with idelalisib. Leukemia 2020. Jul 12. [DOI] [PMC free article] [PubMed] [Google Scholar]
- 8.Davids MS, Fisher DC, Tyekucheva S, McDonough M, Hanna J, Lee B, et al. A phase 1b/2 study of duvelisib in combination with FCR (DFCR) for frontline therapy for younger CLL patients. Leukemia 2020. Aug 20. [DOI] [PMC free article] [PubMed] [Google Scholar]
- 9.Zunder ER, Finck R, Behbehani GK, Amir el AD, Krishnaswamy S, Gonzalez VD, et al. Palladium-based mass tag cell barcoding with a doublet-filtering scheme and single-cell deconvolution algorithm. Nat Protoc 2015. Feb; 10(2): 316–333. [DOI] [PMC free article] [PubMed] [Google Scholar]
- 10.Finck R, Simonds EF, Jager A, Krishnaswamy S, Sachs K, Fantl W, et al. Normalization of mass cytometry data with bead standards. Cytometry A 2013. May; 83(5): 483–494. [DOI] [PMC free article] [PubMed] [Google Scholar]
- 11.Bagwell CB, Inokuma M, Hunsberger B, Herbert D, Bray C, Hill B, et al. Automated Data Cleanup for Mass Cytometry. Cytometry A 2020. Feb; 97(2): 184–198. [DOI] [PubMed] [Google Scholar]
- 12.Chevrier S, Crowell HL, Zanotelli VRT, Engler S, Robinson MD, Bodenmiller B. Compensation of Signal Spillover in Suspension and Imaging Mass Cytometry. Cell Syst 2018. May 23; 6(5): 612–620 e615. [DOI] [PMC free article] [PubMed] [Google Scholar]
- 13.van der Maaten L Accelerating t-SNE using Tree-Based Algorithms. Journal of Machine Learning Research 2014; 15: 1–21. [Google Scholar]
- 14.Rodriguez A, Laio A. Machine learning. Clustering by fast search and find of density peaks. Science 2014. Jun 27; 344(6191): 1492–1496. [DOI] [PubMed] [Google Scholar]
- 15.Chen H, Lau MC, Wong MT, Newell EW, Poidinger M, Chen J. Cytofkit: A Bioconductor Package for an Integrated Mass Cytometry Data Analysis Pipeline. PLoS Comput Biol 2016. Sep; 12(9): e1005112. [DOI] [PMC free article] [PubMed] [Google Scholar]
- 16.Robinson MD, McCarthy DJ, Smyth GK. edgeR: a Bioconductor package for differential expression analysis of digital gene expression data. Bioinformatics 2010. Jan 1; 26(1): 139–140. [DOI] [PMC free article] [PubMed] [Google Scholar]
- 17.Yu N, Li X, Song W, Li D, Yu D, Zeng X, et al. CD4(+)CD25 (+)CD127 (low/-) T cells: a more specific Treg population in human peripheral blood. Inflammation 2012. Dec; 35(6): 1773–1780. [DOI] [PubMed] [Google Scholar]
- 18.Ivanov II, McKenzie BS, Zhou L, Tadokoro CE, Lepelley A, Lafaille JJ, et al. The orphan nuclear receptor RORgammat directs the differentiation program of proinflammatory IL-17+ T helper cells. Cell 2006. Sep 22; 126(6): 1121–1133. [DOI] [PubMed] [Google Scholar]
- 19.Gadi D, Kasar S, Griffith A, Chiu PY, Tyekucheva S, Rai V, et al. Imbalance in T Cell Subsets Triggers the Autoimmune Toxicity of PI3K Inhibitors in CLL. Blood 2019; 134(Supplement_1): 1745–1745.31558466 [Google Scholar]
- 20.Billerbeck E, Kang YH, Walker L, Lockstone H, Grafmueller S, Fleming V, et al. Analysis of CD161 expression on human CD8+ T cells defines a distinct functional subset with tissue-homing properties. Proc Natl Acad Sci U S A 2010. Feb 16; 107(7): 3006–3011. [DOI] [PMC free article] [PubMed] [Google Scholar]
- 21.Sula Karreci E, Eskandari SK, Dotiwala F, Routray SK, Kurdi AT, Assaker JP, et al. Human regulatory T cells undergo self-inflicted damage via granzyme pathways upon activation. JCI Insight 2017. Nov 2; 2(21). [DOI] [PMC free article] [PubMed] [Google Scholar]
- 22.Gadi D, Kasar S, Griffith A, Chiu P, Tyekucheva S, Rai V, et al. Imbalance in T Cell Subsets Triggers the Autoimmune Toxicity of PI3K Inhibitors in CLL. Blood 2019; 134 (Supplement_1): 1745.31558466 [Google Scholar]
- 23.Vartanov A, Matos T, McWilliams E, Gadi D, Rao D, Kasar S, et al. Mass Cytometry Identifies T Cell Populations Associated with Severe Hepatotoxicity in CLL Patients on Upfront Idelalisib. Blood 2018; 132: 4413. [Google Scholar]
Associated Data
This section collects any data citations, data availability statements, or supplementary materials included in this article.


