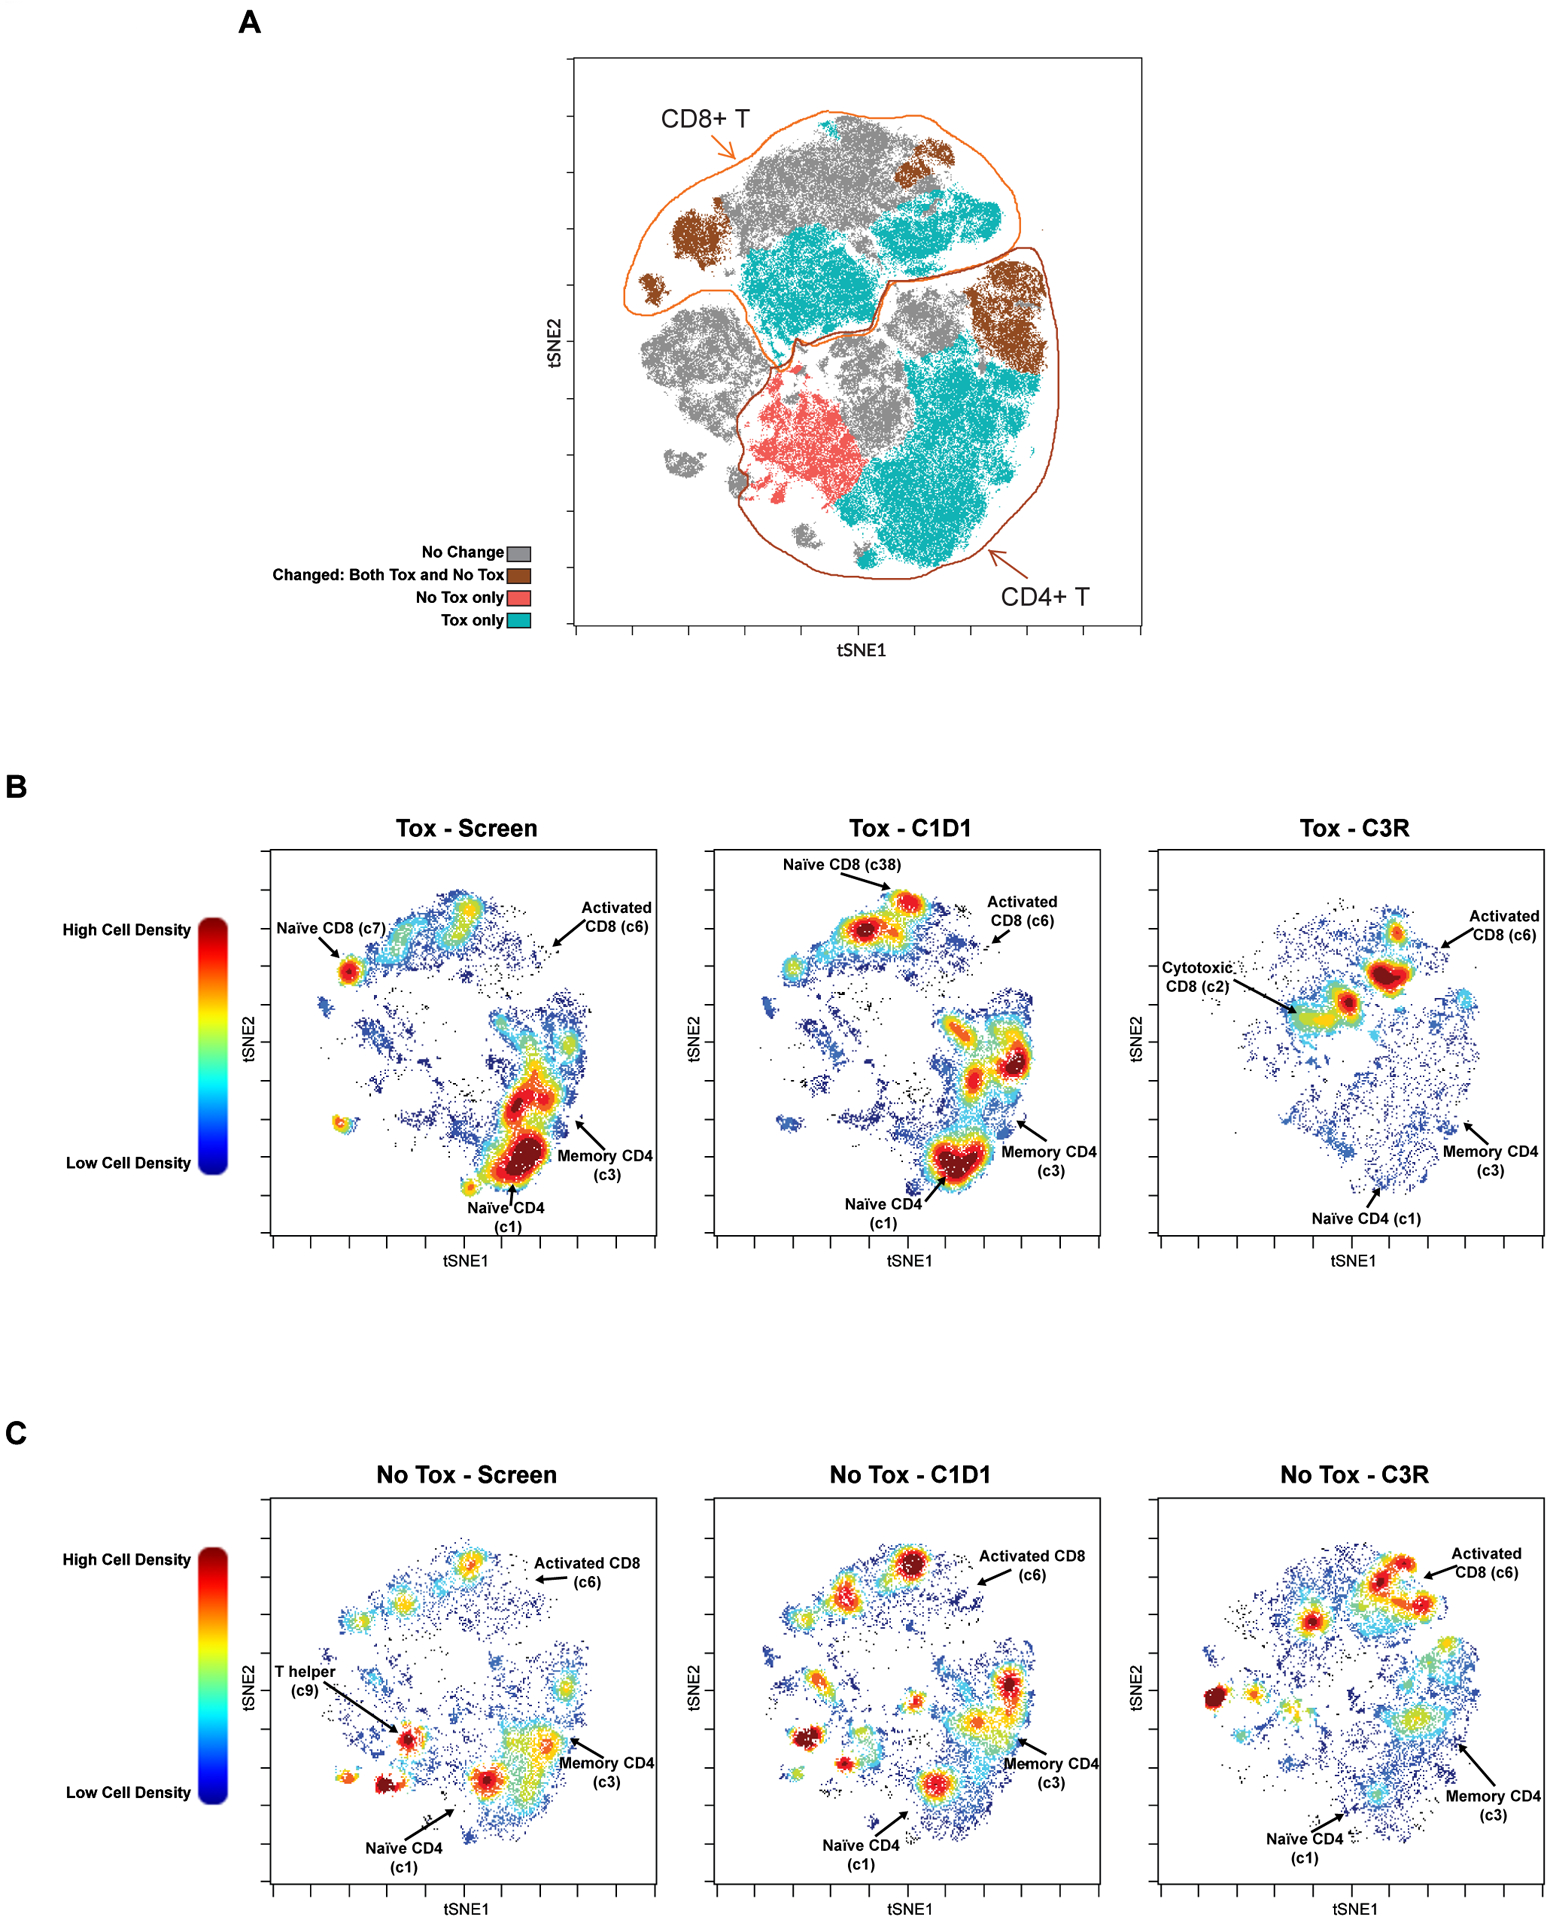
Figure 2. Overview of Changing T Cell Clusters in Patients with and without Toxicity.

A. viSNE plot highlighting the major clusters that are changed in patients with and without toxicity (brown); only in those with toxicity (aqua); only in those without toxicity (red); or unchanged by treatment (gray). Tox=patient subgroup with autoimmune toxicity; No Tox=patient subgroup without autoimmune toxicity. B-C. viSNE plots showing pre and post treatment T cell cluster changes with dFCR, comparing screen, C1D1 and C3R, between patients with (B; N=7) and without (C; N=4) toxicity. Selected clusters showing significant differences are labelled. Plots are colored by relative cell density with red representing more cells and blue representing fewer cells.
