

Abstract
Major advances in genome sequencing and large-scale biosynthetic gene cluster (BGC) analysis have prompted an age of natural product discovery driven by genome mining. Still, connecting molecules to their cognate BGCs is a substantial bottleneck for this approach. We have developed a mass spectrometry-based parallel stable isotope labeling platform, termed IsoAnalyst, which assists in associating metabolite stable isotope labeling patterns with BGC structure prediction in order to connect natural products to their corresponding BGCs. Here we show that IsoAnalyst can quickly associate both known metabolites and unknown analytes with BGCs to elucidate the complex chemical phenotypes of these biosynthetic systems. We validate this approach for a range of compound classes, using both the type strain Saccharopolyspora erythraea and an environmentally isolated Micromonospora sp. We further demonstrated the utility of this tool with the discovery of lobosamide D, a new and structurally unique member of the family of lobosamide macrolactams.
Introduction
Genome sequencing has fundamentally changed the paradigm of natural products research and discovery. With advancing technology and decreasing costs, the accessibility of high-quality genome information has increased exponentially.1–3 Over the last decade, this accumulation of genome sequence data has inspired the development and refinement of computational tools for identifying biosynthetic gene clusters (BGCs),4 predicting structural elements of the compounds they produce,5,6 prioritizing novel BGCs, or a combination thereof.3,7,8 With the recent developments in the accessibility of these tools, BGC databases such as MIBiG9 and IMG-ABC10 will continue to grow in both size and value to the scientific community as annotations and experimental validation of chemical structures are updated. Community efforts such as the Natural Products Atlas11 and Lotus12 databases also enhance our understanding of the “specialized metabolome” by providing curated records linking structures to the taxonomy of their producing organisms.
Bacterial genome analysis is rapidly changing from an effort directed towards a handful of strains, to one focused on thousands of sequences. Large-scale comparisons of BGC families have proven to be powerful tools in leveraging these large datasets for natural product discovery.2,4,13–15 Advances in these computational tools for understanding BGCs have long been promoted as a mechanism to eliminate the most common complications of traditional natural product discovery and facilitate automated, high-throughput workflows.1,2,16 Although bioinformatics approaches are moving rapidly towards a global scale for BGC analysis, efforts to efficiently identify associated chemistry remain technically challenging and time-consuming.17
Another major bottleneck in genome mining is that many organisms suffer from low or no expression of the BGCs of interest under laboratory conditions.18 Host engineering to optimize heterologous expression19 and various other strategies20,21 have addressed this challenge with some successes, but most approaches still face limitations in detecting and identifying cognate products.1 Consequently, new BGCs are typically identified at a higher rate than their associated chemistry because the field lacks tools to quickly establish connections between BGCs and their associated chemistry.17,22,23
Many of the current approaches used for integrating metabolomic and genomic datasets are based on MS/MS fragmentation spectra.15 While these approaches have been successful in identifying new chemistry and streamlining workflows,24–26 there are caveats to relying too heavily on MS/MS fragmentation spectra. The complex chemical phenotype produced by a BGC can include a dozen or more compounds, and small structural changes present between analogues may result in unexpected differences in fragmentation patterns. A number of tools address this issue by presaging MS/MS fragmentation interpretation with de novo prediction of structural motifs from interpretation of BGC modules.24,27,28 The recently released tool NRPminer,28 extends this approach to accommodate post-assembly modifications, greatly increasing the coverage and accuracy of this strategy. However, NRPminer currently only accommodates non-ribosomal peptide synthetase BGCs. Therefore, a generalizable analytical method for characterizing and grouping these structural variants on the basis of a common biosynthetic origin would provide a powerful orthogonal approach for biochemical interpretations of complex metabolic phenotypes.
Historically, isotope labeling has been used to determine the biosynthetic origins of individual compounds through targeted labeled feedstock addition and compound isolation.29–31 However these approaches are not appropriate for system-wide studies because of the need to isolate and acquire NMR spectra or specific activities for each individual compound of interest. Stable isotope labeling has also been used extensively in studies related to primary metabolism and metabolic flux analysis, for which several open source MS data processing packages have been developed,32 including X13CMS33 and mzMatch-ISO.34 However, although these platforms are capable of annotating metabolites with stable isotope label incorporation they do not directly determine the maximum degree of labeling for each metabolite in the sample or do not align compounds between experiments using a variety of different stable isotope labels, limiting their utility for connecting molecules to BGCs.
To address these challenges, we have developed a new analytical platform, termed IsoAnalyst. This platform employs parallel stable isotope labeling (SIL) to categorize specialized metabolites in liquid fermentations based on biosynthetic precursor incorporation, and connects these molecules to candidate BGCs using annotated genome sequence data. Parallel fermentation of the test organism is performed in the presence of either an isotopically labeled precursor or a control culture containing the corresponding unlabeled precursor for a panel of SIL tracers (Fig. 1a; 24-well plates, one condition per column, four replicates per condition). Following workup and UPLC-MS analysis of all samples, the IsoAnalyst pipeline identifies unique MS features present in each condition, and compares mass isotopologue distributions between unlabeled and labeled conditions to determine the degree of labeling by each precursor (Fig. 1b). Experimental precursor incorporation patterns are then manually compared against the theoretical precursor incorporation rates derived from BGC annotations (Fig. 1c) to yield candidate BGC(s) responsible for the production of each labeled metabolite. This approach streamlines the categorization of analytes by their biosynthetic origin and reduces MS metabolic profiles to quickly delineate the complex phenotypes of BGCs. The IsoAnalyst package is freely available under an open access MIT software license (https://github.com/liningtonlab/isoanalyst) and accepts data in a simple format compatible with most major mass spectrometry instrument vendors.
Figure 1: Overview of the IsoAnalyst workflow.
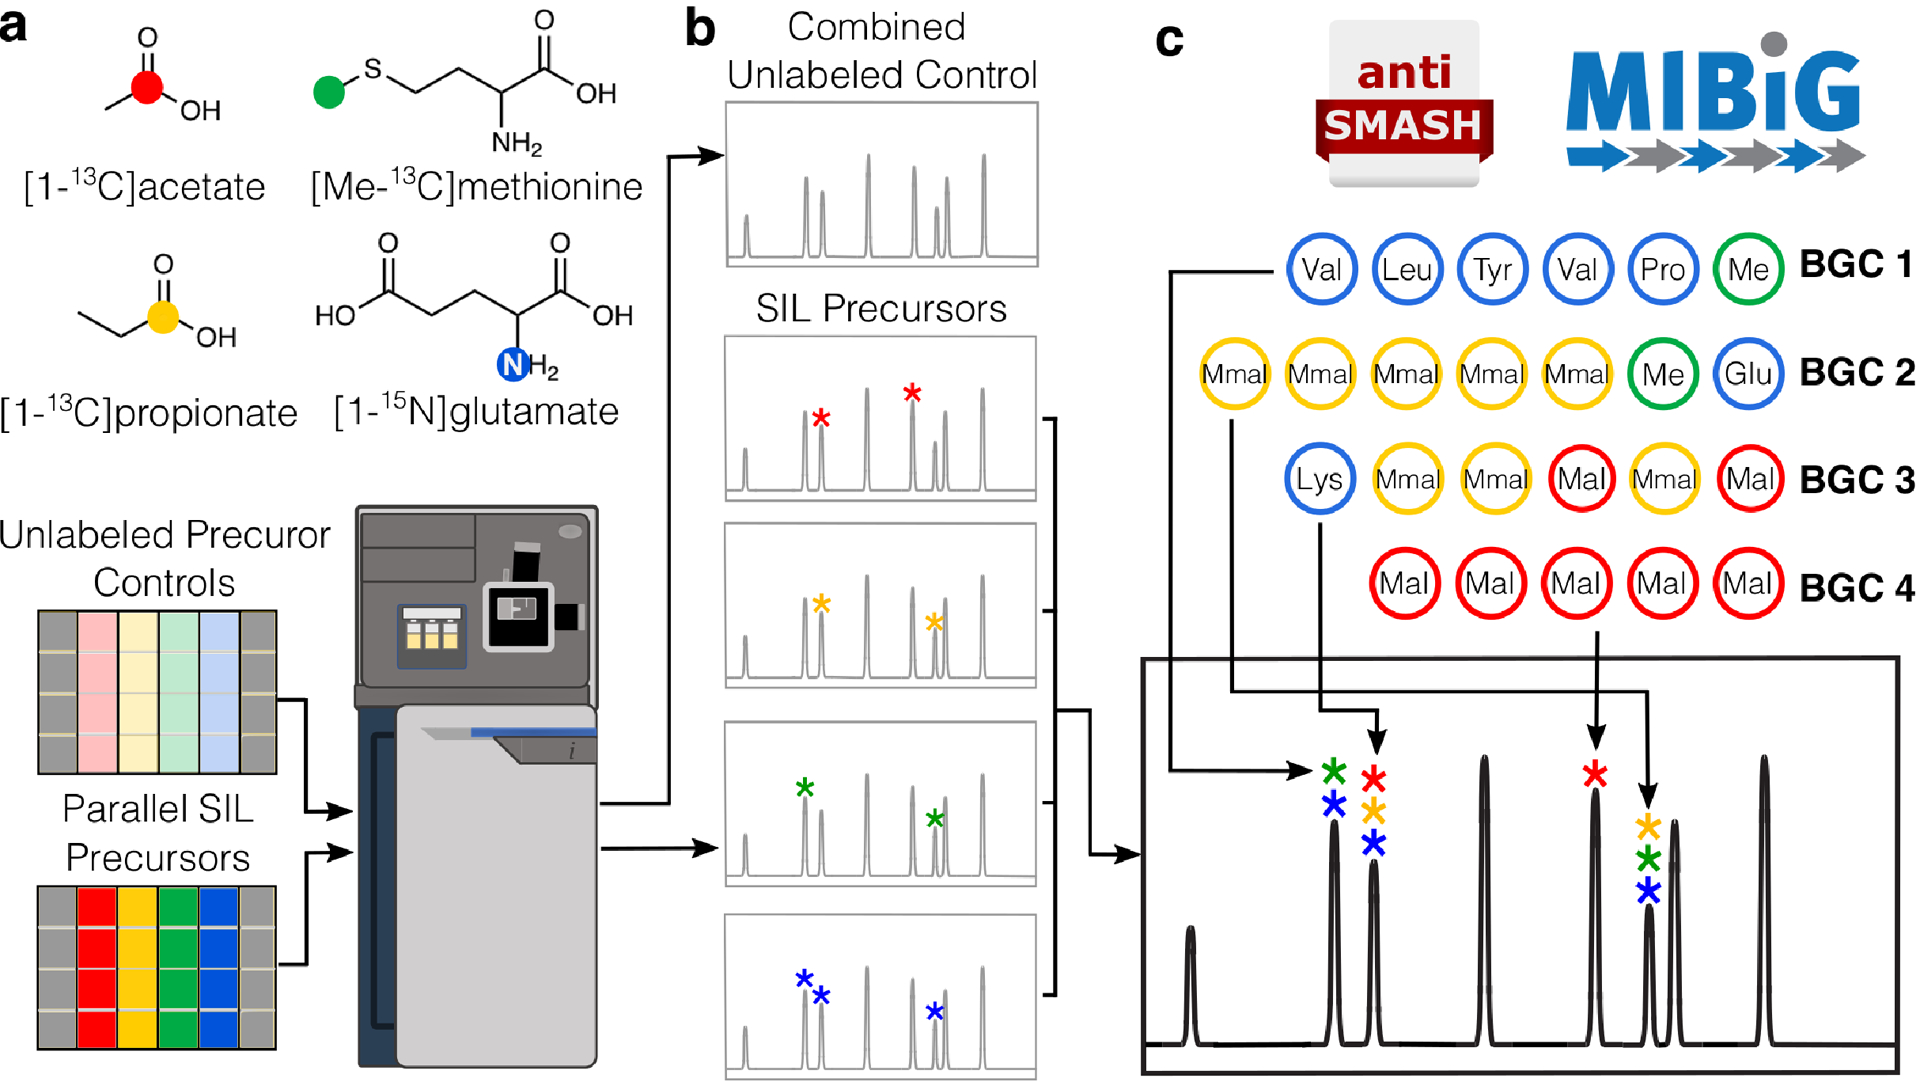
(a) SIL is performed on parallel fermentations using the SIL feedstocks [1-13C] acetate (30 mM), [1-13C] propionate (30 mM), [methyl-13C] methionine (5 mM), and [1-15N] glutamate (10mM) and the corresponding unlabeled feedstocks at the same concentrations. ESI-qTOF-MS analysis is performed on each culture. (b) MS data are processed by IsoAnalyst to determine the degree of isotope labeling under each culture condition by comparing labeled and unlabeled MS datasets. (c) The genome of the organism is evaluated for the presence of BGCs using antiSMASH, and the substrates of each biosynthetic module are predicted using both automatic predictions in antiSMASH and manual review of related MIBiG entries and literature. Labeling patterns from UPLC-MS analysis are aligned across all conditions and substrate predictions from BGC analysis are compared to relate molecules to genes.
Results
Parallel Stable Isotope Labeling in Microtiter Plates
IsoAnalyst was developed to permit flexibility in terms of SIL precursor selection. To demonstrate the scope of IsoAnalyst across a broad cross section of biosynthetic classes, we selected four ‘generalist’ precursors for this study; [1-13C]acetate, [1-13C]propionate, [methyl-13C] methionine, and [1-15N]glutamate. [1-13C]Acetate can be incorporated directly into polyketide products via malonyl-CoA, but can also be incorporated into other biosynthetic monomers such as amino acids through primary metabolism recycling35 (Extended Data Fig. 1). This makes [1-13C] acetate a valuable feedstock for labeling a wide cross-section of natural product classes but it also complicates data interpretation, as we discuss below. [1-13C]Propionate is predominantly used for identifying polyketide pathways, due to its conversion to methylmalonyl-CoA, a common building block in type I and type II polyketide biosynthesis. [methyl-13C]Methionine was selected in order to label compounds methylated by S-adenosyl methionine (SAM). Finally, [1-15N]glutamate was selected to constitutively label all products containing nitrogen atoms.
To reduce costs and improve throughput, we developed a fermentation protocol using a minimal media in 24-well microtiter plates (Methods). To ensure robust and consistent labeling we performed preliminary experiments to determine both the ideal concentration for each SIL feedstock condition (Supplementary Fig. 1; Methods) and the optimal timing for feedstock addition (Supplementary Fig. 2; Methods). Four replicate wells are inoculated for each SIL precursor condition and a matching unlabeled control condition containing the same precursor molecule with a natural isotopic abundance (Fig. 1a). All of these parallel experiments are inoculated on the same day with the addition of appropriate precursors and cultured for five days prior to extraction, UPLC-HRMS analysis, MS data analysis, and precursor incorporation calculation (Methods).
Erythromycin A SIL Incorporation Predicts BGC Origin
We performed the parallel SIL experiment described above with the erythromycin A producer Saccharopolyspora erythraea NRRL 23338 to first demonstrate how IsoAnalyst connects MS isotope patterns with substrates inferred from BGC data under ideal circumstances in which all substrates can be correctly deduced (Fig. 2). The biosynthesis of erythromycin A (1) has been studied extensively as a model system for modular polyketide synthases.36 The macrolide core is formed by the condensation of one propionyl-CoA and six methylmalonyl-CoA units followed by glycosylation with the saccharides desosamine and mycarose37 (Fig. 2a,b). [1-13C]Propionate is directly converted to the substrates propionyl-CoA and methylmalonyl-CoA, however the latter may also be labeled by [1-13C]acetate through conversion to the TCA cycle intermediate succinyl-CoA (Extended Data Fig. 1). The indirect labeling of methylmalonyl-CoA by [1-13C]acetate is included in the BGC labeling prediction as we cannot differentiate analytically between direct and indirect SIL incorporation (Fig. 2a). Desosamine contains a tertiary dimethylamino group which is expected to be labeled by a single position in the [1-15N]glutamate condition, and two positions in the [methyl-13C]methionine condition. The mycarose unit has a single methylation position and is later methylated by an O-methyltransferase following attachment to the macrolide core (Fig. 2a). Initial observation of the MS data for erythromycin A showed appreciable labeling in all of the expected conditions (Fig. 2b). However, a reliable method to identify the largest isotopologue peak with detectable SIL incorporation was needed in order to directly compare these MS results with the predicted labeling pattern.
Figure 2: Overview of IsoAnalyst results for erythromycin A (1).
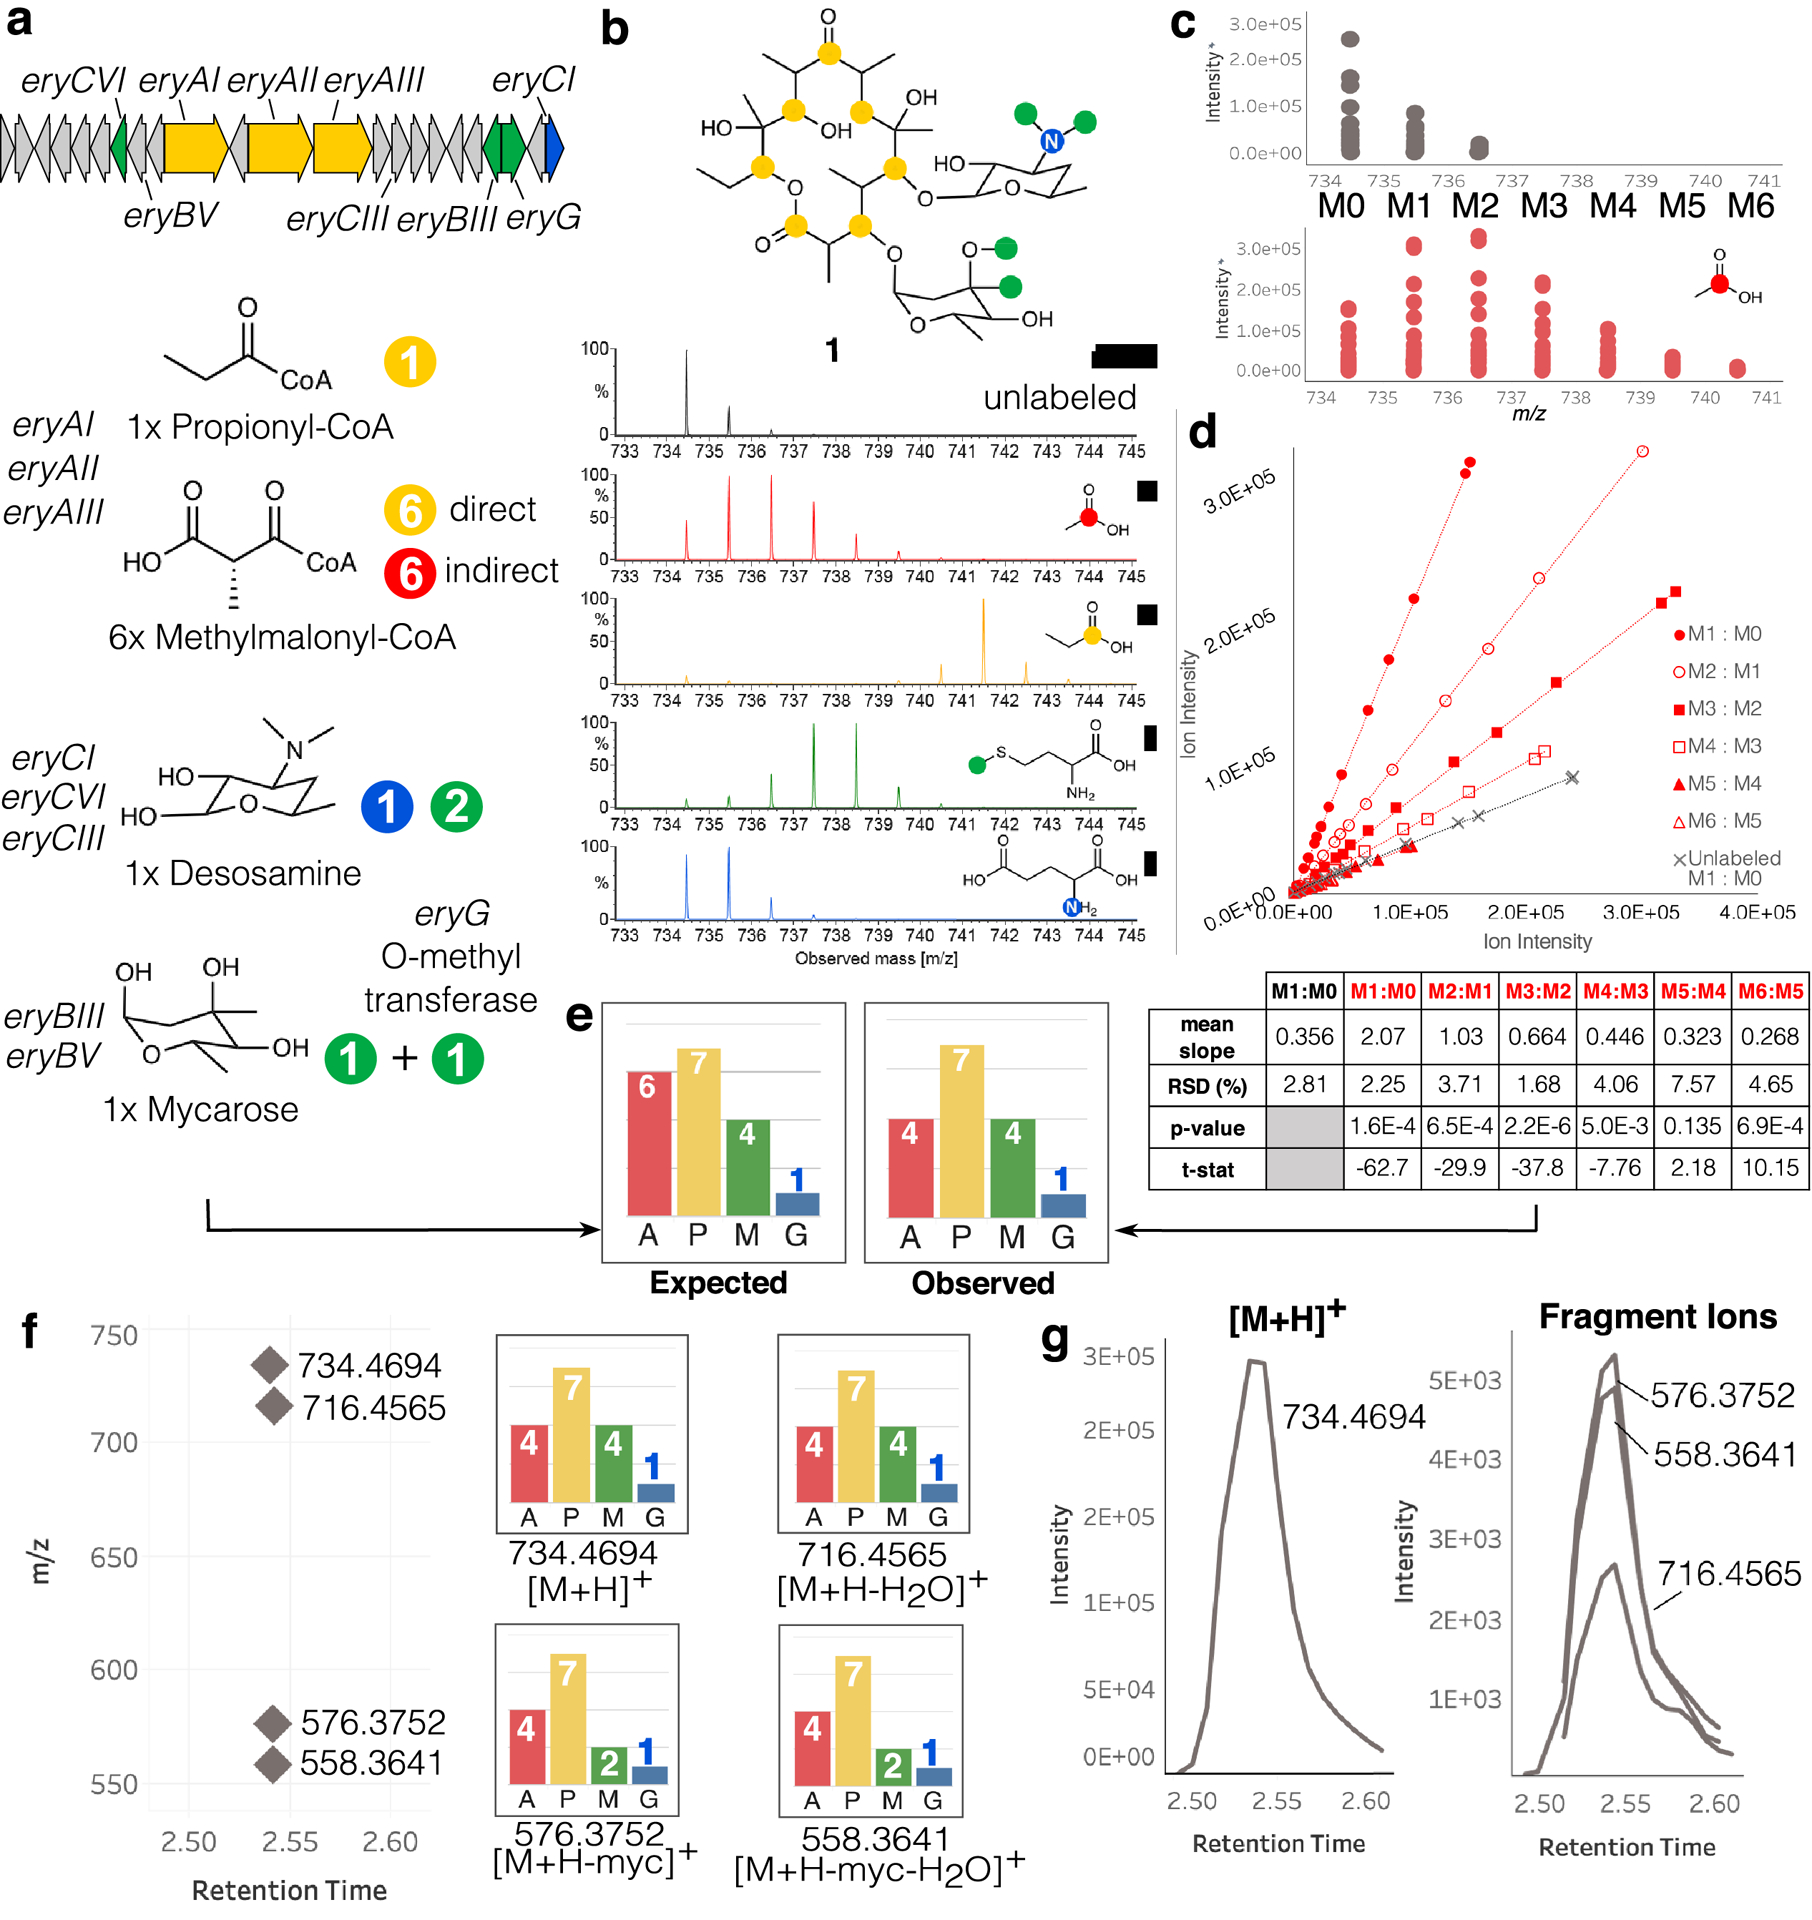
(a) Diagram of the erythromycin BGC, the biosynthetic substrates predicted by antiSMASH, and their expected labeling. The mycarose subunit is methylated once prior to attachment to the polyketide core, and further methylated by a tailoring enzyme once attached to the core. Indirect labeling of methylmalonyl-CoA occurs by transformation of [1-13C]acetate through the TCA cycle (Extended Data Fig. 1). (b) Structure of erythromycin A (1) showing the expected positions of SIL incorporation and MS of 1 under the four SIL conditions. (c) Centroided scan data for mass isotopologues of 1 from one unlabeled control replicate and one [1-13C]acetate labeled replicate plotted as m/z vs. intensity. (d) Centroided scan-by-scan data from (c) plotted as ion intensity of neighboring isotopologues in each scan (i.e. M1:M0, M2:M1 etc.). Only the M1:M0 isotopologue ratio is plotted for the unlabeled sample replicate, while all neighboring isotopologue pairs are shown for the [1-13C]acetate sample replicate. The table below shows the two-tailed Welch’s t-test results comparing the slope of each isotopologue ratio in the [1-13C]acetate condition to the M1:M0 isotopologue ratio of the unlabeled sample. The ratio of M4:M3 is the last isotopologue ration with a significant p-value (< 0.05) and a negative test statistic, indicating four significantly labeled positions of 1 in the [1-13C]acetate condition. The slope values for each isotopologue neighbor pair from each replicate form the basis for the t-tests. (e) Isotopologue ratio analysis is repeated for the same feature in all four conditions and compared to the expected labeling determined by BGC analysis. (f) Four mass features representing adducts and fragments of 1, and the SIL incorporation detected for each. (g) Extracted ion chromatograms of the four features indicated in (f).
To systematically determine the extent of labeling in every feature detected in the MS metabolomics data, we developed a novel algorithm to determine the statistical confidence of SIL incorporation in MS features. This algorithm requires two input file types: a deisotoped feature list for each unlabeled precursor condition, and a centroided scan-by-scan MS peak list for each individual culture condition (labeled and unlabeled). The deisotoped feature list contains averaged m/z and retention time pairs for all features observed in at least three replicates. These features are used as ‘anchor points’ to extract the relevant isotopologue data for each peak from the scan-by-scan peak lists which are in turn used to determine the degree of isotopic labeling in each condition (Extended Data Fig. 2a, Methods).
IsoAnalyst determines the degree of isotopic labeling for each analyte by comparing the relative intensities of the first isotopologue peak (one 13C; M1) and the monoisotopic mass (all 12C; M0) in the unlabeled dataset with sequential pairs of peaks (e.g. M1 vs M0, M2 vs M1 etc.) in the labeled dataset (Fig. 2c,d). To compare isotopologue ratios between unlabeled and labeled peaks we first plot the intensity of the M1 vs M0 peaks for each scan in the chromatographic peak and then derive the slope from the linear regression for these data (Extended Data Fig. 3). We next derive the slope value from analogous plots for each isotopologue pair in the labeled condition, continuing across the isotopologue distribution (Fig. 2c). This analysis is performed independently for all replicates of each labeling condition, giving four slope values per isotopologue pair. Starting with M1 and M0 we ask the question, ‘does this isotopologue ratio differ significantly from the M1 to M0 ratio of the same chemical species having a natural isotopic distribution?’. We answer this question by performing Welch’s two-tailed t-tests between the M1 vs M0 peaks in the unlabeled condition and sequential isotopologue pairs in the labeled condition. Finally we assume that, for every position where this ratio is significantly greater than the M1:M0 ratio of the unlabeled feature, at least that many positions are enriched in that SIL condition (Fig. 2d, Methods). This analysis therefore does not define the precise number of biosynthetic precursors in the structure, but rather the minimum number of detectable incorporation events for each SIL feedstock in a given MS feature. A comparison of the results from the BGC substrate analysis and IsoAnalyst results for the [M+H]+ ion of erythromycin A (1) revealed that the observed labeling matched the predicted labeling in every SIL condition except [1-13C]acetate, which exhibited a lower degree of labeling due to the indirect incorporation into of methylmalonyl-CoA into the core polyketide building blocks that cannot be precisely predicted (Fig. 2e).
A total of four features were detected for 1, corresponding to different fragments of the same compound (Fig. 2f,g). The dehydrated fragment ion m/z 716.4565 had labeling patterns that matched the [M+H]+ ion, while smaller fragments showed decreased labeling from [methyl-13C]methionine due to the loss of the mycarose sugar subunit (Fig. 2f). IsoAnalyst therefore not only accurately detects SIL incorporation in MS features across multiple conditions, but can also group adducts and fragments that derive from the same compound, simplifying interpretation of labeling data for complex samples.
Predicted SIL Incorporation in Products of S. erythraea BGCs
In order to apply the IsoAnalyst workflow to the full metabolome of S. erythraea, we first performed BGC mining on the full S. erythraea NRRL 2338 genome using antiSMASH version 5.2.0–8ecc354 (Methods). The antiSMASH output offers substrate predictions for a broad cross-section of biosynthetic classes using a suite of prediction algorithms including SANDPUMA,38 NRPSPredictor2,39 and RODEO.40 Using these predictions in combination with literature references from the MIBiG database,9 we obtained detailed substrate predictions for all annotatable BGCs in the genome (Supplementary Table 6; Methods). Each column of this table contains predicted substrate counts for a single gene cluster from a list of commonly encountered biosynthetic substrates predicted to be labeled by one or more SIL precursors. A detailed step-by-step protocol for deriving predicted substrates from antiSMASH-discovered BGCs can be found in Supplementary Note 2.
To relate substrate counts to isotopic labeling patterns it is necessary to know the degree of labeling of each biosynthetic substrate by each SIL precursor. A Substrate Labeling Table (Supplementary Table 1) was generated by considering the metabolic fate of each precursor in this organism. Of the SIL feedstocks used in this study, [1-13C]acetate is the most promiscuous due to its incorporation in the TCA cycle (Extended Data Fig. 1). Indirect incorporation of [1-13C]acetate into amino acids and other TCA-derived substrates is significant but variable under different metabolic conditions and therefore requires careful interpretation. By contrast, [1-13C]propionate and [methyl-13C]methionine are expected to label only specific substrates. Finally, the [1-15N] glutamate SIL condition is intentionally designed to be promiscuous and labels all amino acids and other subunits derived from amino acids (Supplementary Table 1).
To predict the labeling patterns for each BGC, we integrated data from the Curated antiSMASH Output (Supplementary Table 6) and the Substrate Labeling Table (Supplementary Table 1) to create a table of predicted precursor labeling for all BGCs in the genome (Table 1). Not all of the BGCs in the S. erythraea genome are as amenable to SIL incorporation in our experiment as erythromycin, which has SIL incorporation in all four conditions. Some well-characterized BGC classes, such as terpenes, do not have sufficient SIL incorporation across the conditions used in this experiment, while products of BGCs with partial predictions may be labeled under these conditions but cannot be reliably associated without additional genetic analysis. We use two criteria to determine the likelihood of identifying the product of a BGC with the SIL precursors used in this study. Firstly, the predicted product of a BGC should be labeled in two or more conditions, as it is not possible to differentiate products of related BGCs on the basis of labeling in a single condition. Secondly, the product must be labeled three or more times in at least one of the conditions, as minor SIL incorporation is likely to occur in off-target compounds involved in primary metabolism. In Table 1 and Supplementary Table 2, BGCs that meet both criteria are highlighted in dark gray, while BGCs that meet only one of the criteria are highlighted in light gray.
Table 1:
Biosynthetic gene cluster labeling prediction for S. erythraea.
| Cluster | Type | A | P | M | G |
|---|---|---|---|---|---|
| 25 | lanthipeptide | 29 | 47 | ||
| 22 | lanthipeptide | 1+ | |||
| 28 | lanthipeptide | 1+ | |||
| 31 | thiopeptide | ||||
| 12 | NRPS | 4 | 6 | ||
| 15b | NRPS | 9 | 7 | ||
| 24a | NRPS | 3 | 9+ | ||
| 2 | NRPS | 2 | 2 | ||
| 6 | NRPS | 2 | 2+ | ||
| 15a | NRPS | 1+ | |||
| 17 | NRPS | 1+ | |||
| 11 | PKS-NRPS hybrid | 6 | 3 | 1 | |
| 13 | PKS-NRPS hybrid | 2 | 2 | 1 | |
| 4 | type I PKS | 7 | 7 | 4 | 1 |
| 23 | type I PKS | 9 | 5 | ||
| 10 | type I PKS | 1 | 1 | ||
| 24b | type I PKS | 1 | 1 | ||
| 9 | type I PKS | 2+ | |||
| 32 | type I PKS | 1+ | 1+ | ||
| 33 | type I PKS | 1+ | |||
| 1 | PKS | 1+ | 1+ | ||
| 5 | type III PKS | 5 | |||
| 27 | other / type III PKS | 1+ | 1 | ||
| 26 | other PKS | 1+ | 1 | ||
| 35 | other PKS/FAS | 4 | |||
| 3 | other PKS/FAS | 1+ | |||
| 14 | other PKS/FAS | ||||
| 8,16, 18,19, 20,21, 24c,36 | terpene | ||||
| 29 | terpene | 1 | 1 | ||
| 30 | terpene / NRPS-like | 1+ | |||
| 15c | betalactone | ||||
| 7 | Indole | 1 | 1 | ||
| 34 | other | 1 |
BGCs highlighted in light gray and dark gray meet one and two selection criteria respectively as indicated in text
SIL in S. erythraea Reveals Compounds from Two Distinct BGCs
The summary of SIL incorporation results from IsoAnalyst is initially generated by filtering for features that have detectable SIL incorporation in two or more feedstock conditions. This file is then manually interrogated to filter features based on chromatographic peak shape and signal intensity. Features were eliminated if either of these factors interfered with the accuracy of the SIL detection. IsoAnalyst identified 98 features in the S. erythraea extracts with SIL incorporation in two or more conditions. Sixty of these features derived from six compounds with very similar SIL incorporation patterns, including erythromycin A (1) (Features represented by diamonds; Fig. 3).
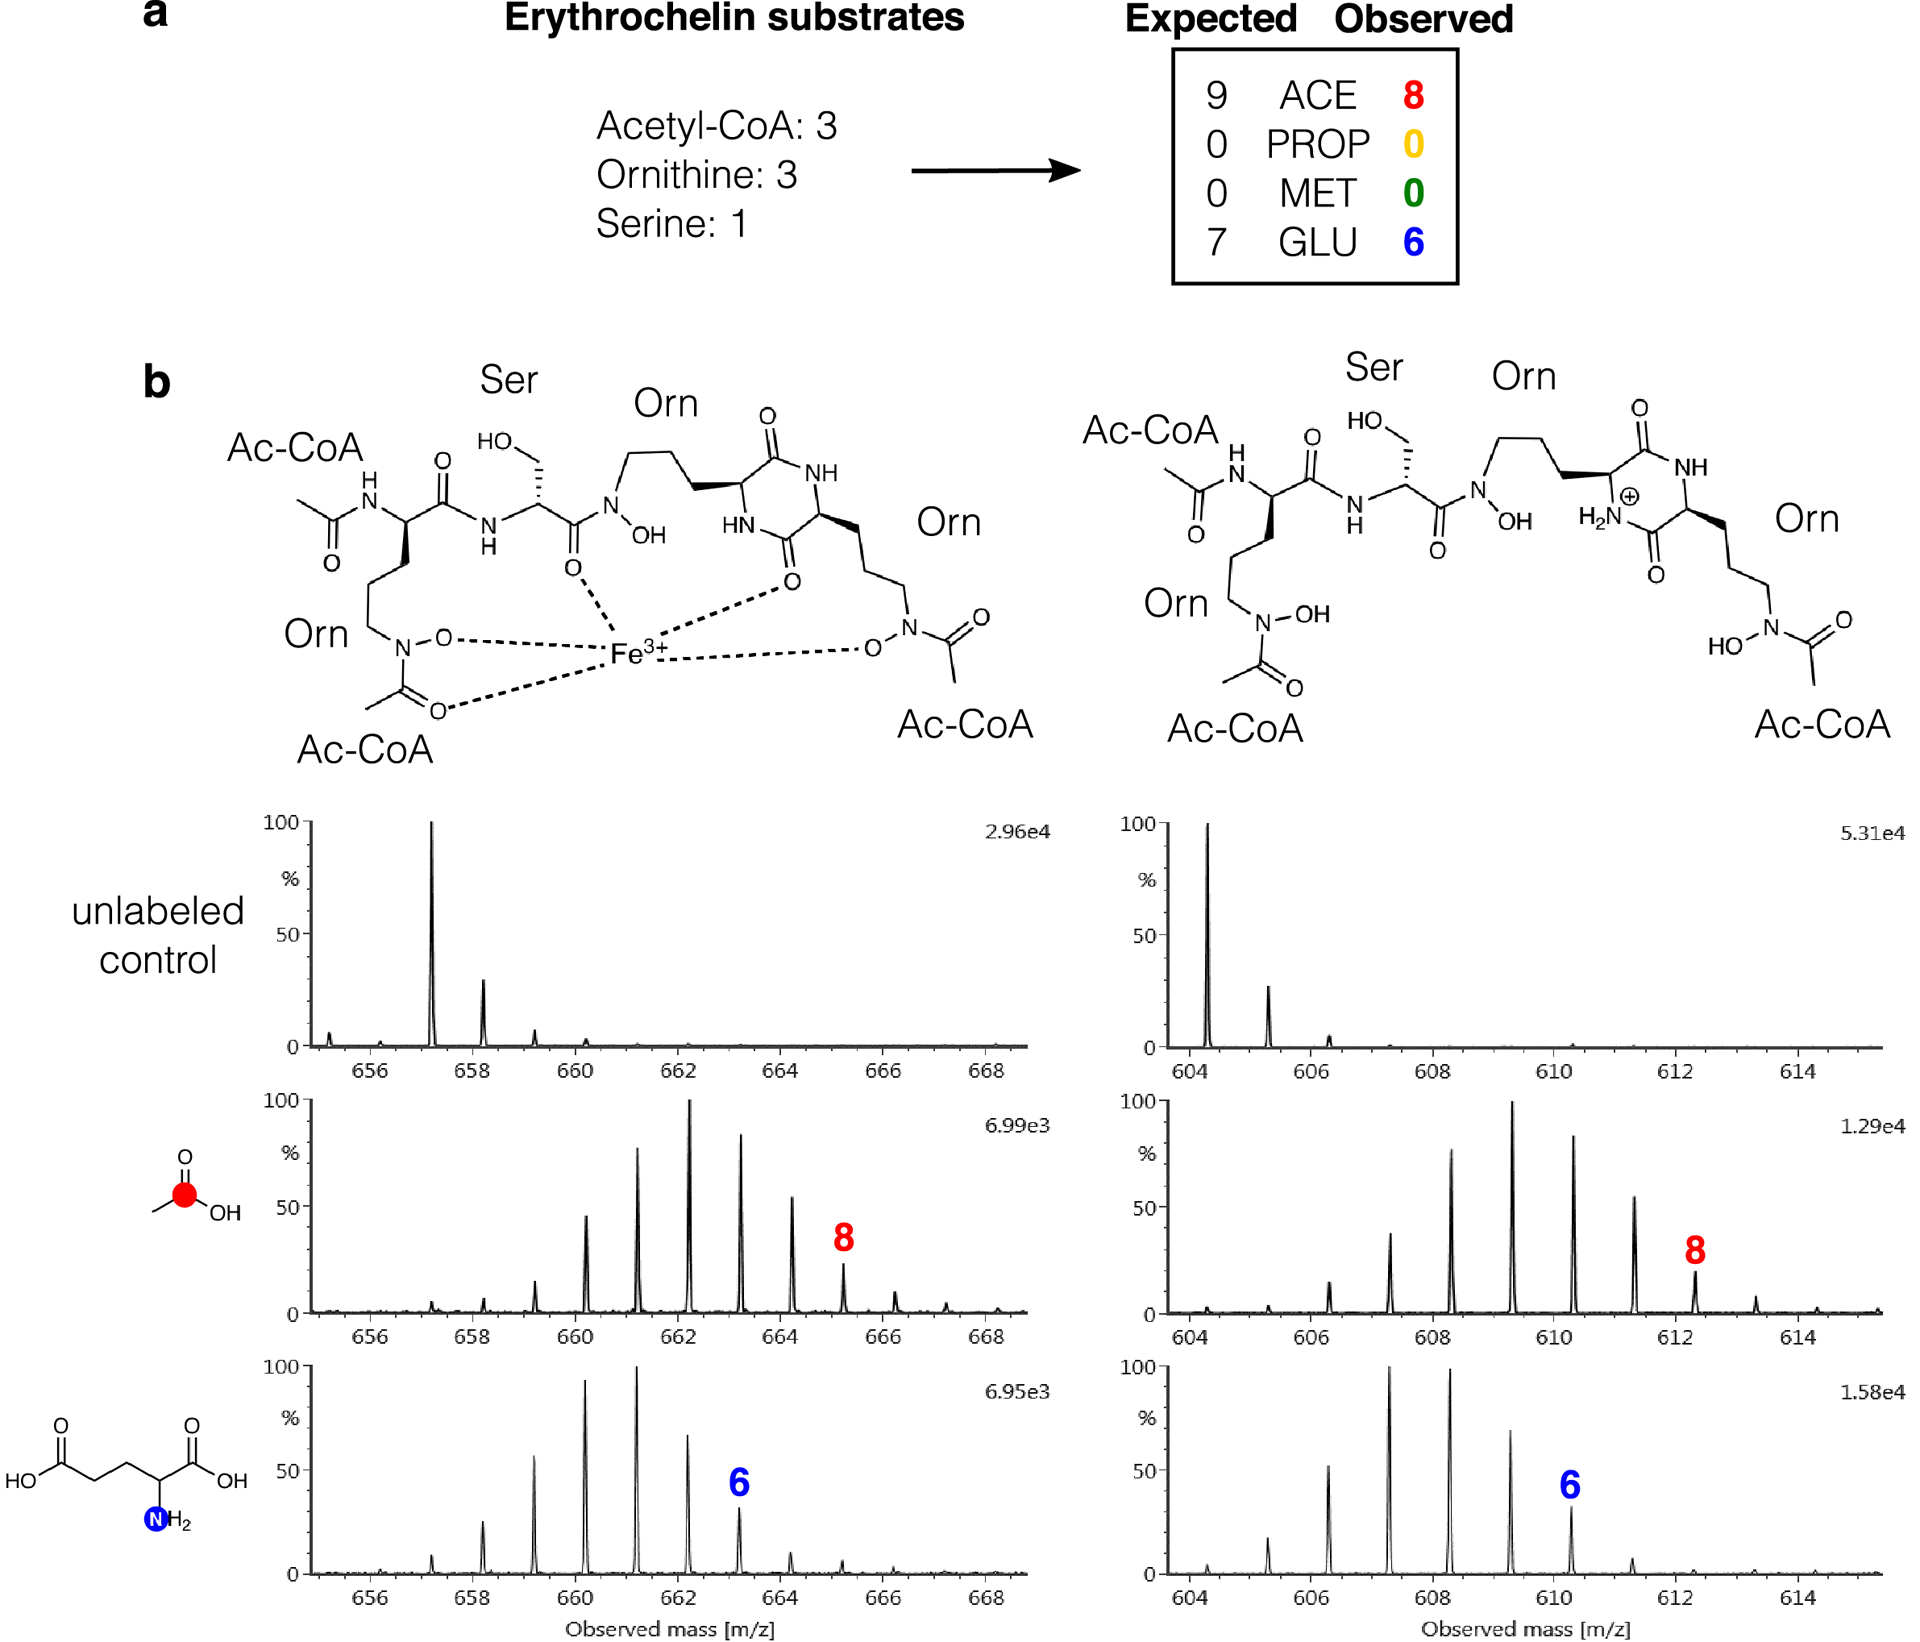
Figure 3: SIL incorporation and structures for selected labeled ions detected in the S. erythraea metabolome.
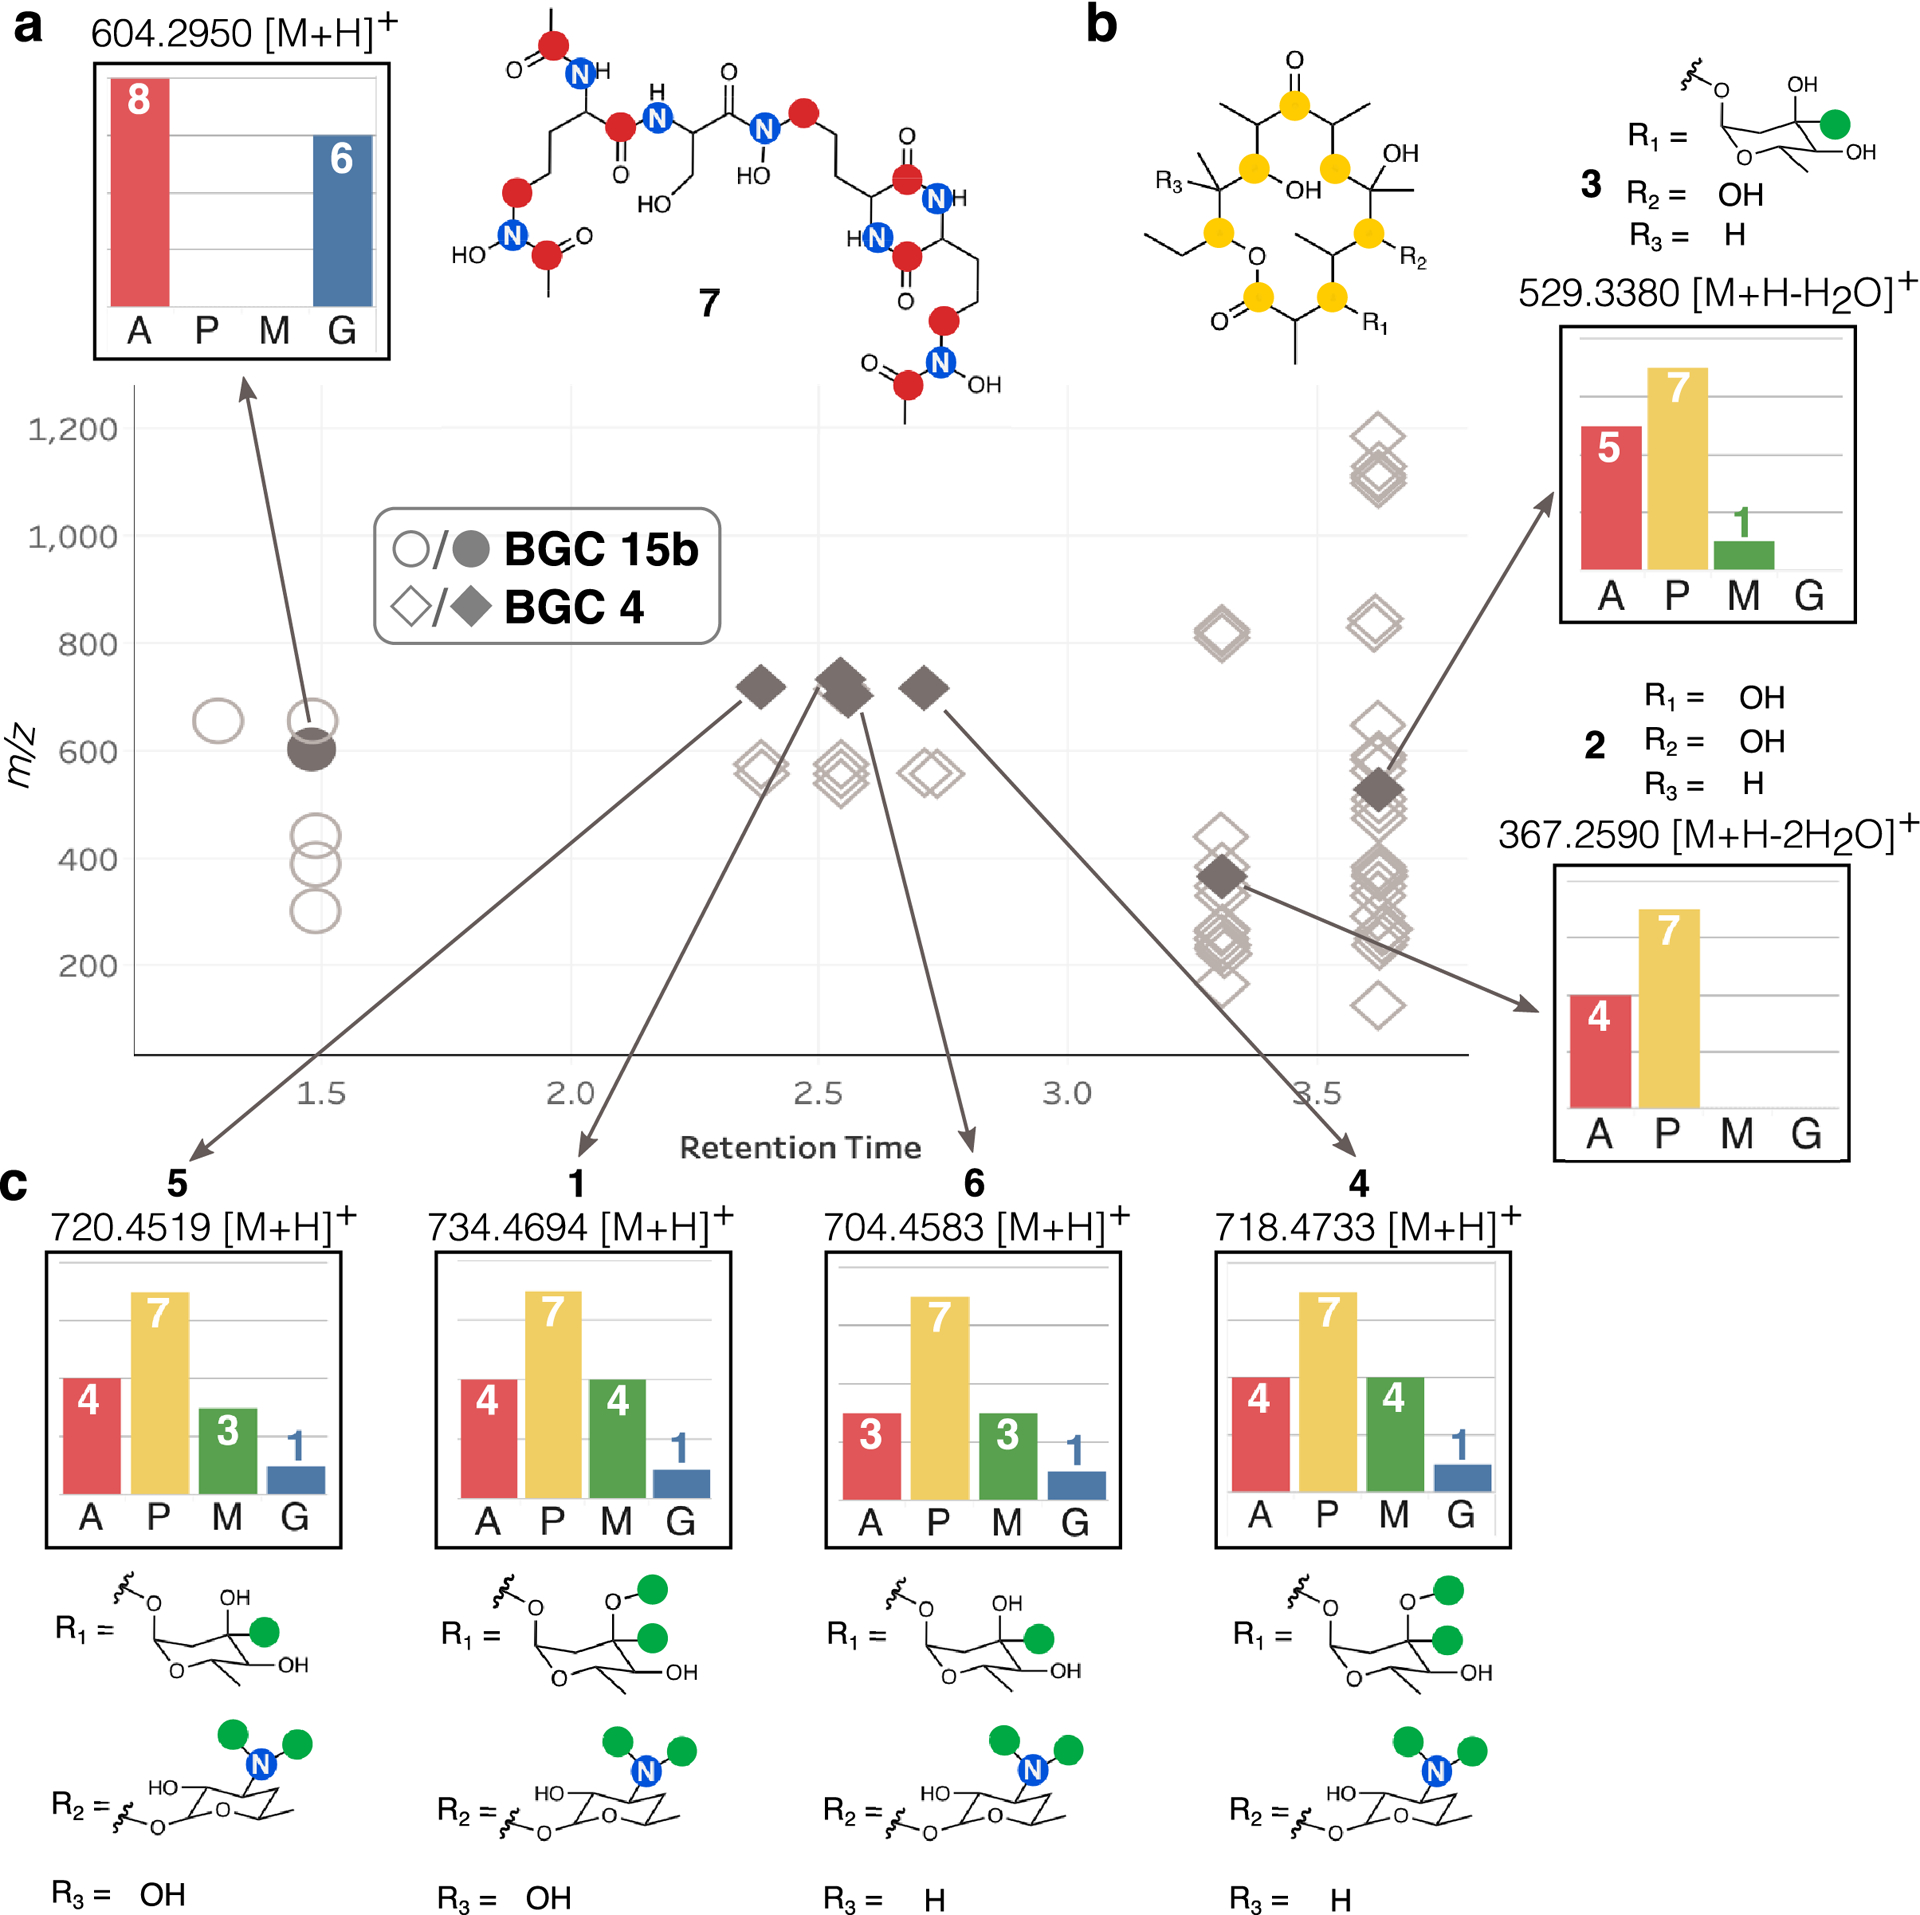
Label incorporation from feeedstocks [1-13C] acetate (A), [1-13C] propionate (P), [methyl-13C] methionine (M), and [1-15N] glutamate (G) are shown. Ions depicted as circles correspond to adducts and fragments of erythrochelin (7). Ions depicted as diamond shapes correspond to adducts and fragments of different intermediate compounds in the erythromycin biosynthetic pathway. (a) SIL incorporation and expected labeled positions in the structure of 7. (b) SIL incorporation and expected labeled positions of the erythromycin biosynthetic precursors, erythronilide B (2) and O-α-mycarosylerythronolide B (3). (c) SIL incorporation in erythromycin A (1), B (4), C (5), and D (6).
All of the erythromycin BGC products identified had related labeling patterns in the [1-13C]acetate and [1-13C]propionate conditions due to the shared polyketide core (Fig. 3b,c). Complete labeling by [1-13C]propionate was detected in all six compounds, while there was slight variation in the detection of [1-13C]acetate incorporation. By contrast, labeling in [methyl-13C]methionine and [1-15N]glutamate varied between the six products, suggesting different degrees of decoration of the polyketide core (Fig. 3b,c). Erythronolide B (2) was not labeled by either [methyl-13C]methionine or [1-15N]glutamate, consistent with the proposed structure containing only the core macrocycle. 3-O-α-mycarosylerythronolide B (3) contained a single labeled position in [methyl-13C]methionine, consistent with the addition of the mycarose sugar, which contains a single site of SAM methylation. The additional methylation position in the mycarose moiety of 1 is derived from tailoring enzyme activity which occurs after the mycarose sugar is attached to the polyketide core (Fig. 3b). The identities of 1, 2, and 3 were confirmed by UPLC-MS co-injection with commercial standards and NMR analysis where applicable (Supplementary Figs. 3–13). The final three steps in the erythromycin pathway are performed in a variable order by tailoring enzymes,37 resulting in the four related products, erythromycin A (1), B (4), C (5), and D (6) (Fig. 3c). We putatively identified 4, 5, and 6 on the basis of the detected m/z values and SIL incorporation patterns indicating glycosylation with desosamine, and O-methylation of the mycarose sugar moiety (Fig. 3c).
Six features with significant labeling in both [1-13C]acetate and [1-15N]glutamate but no incorporation of either [1-13C]propionate or [methyl-13C]methionine were also detected by IsoAnalyst (Features represented by circles; Fig 3a). BGC 15b is the only BGC that has predicted labeling which matches the labeling of this compound (Table 1, Fig. 3a). BGC 15b was identified by antiSMASH as the siderophore erythrochelin BGC (Supplementary Table 6), suggesting the presence of the siderophore erythrochelin (7), previously isolated from S. erythraea.41
[1-13C]Acetate incorporation into 7 was predicted to occur a maximum of nine times, with six of these incorporation events occurring via labeling of the ornithine carbon skeleton (Fig. 3a, Extended Data Fig. 4). A more detailed interrogation of the SIL data confirmed the identity of compound 7 through a combination of fragment m/z values, which matched those previously reported for erythrochelin,41 and the SIL patterns for the fragments, which confirmed [1-13C]acetate labeling of the ornithine-derived subunits (Extended Data Fig. 4–5). Together, these results demonstrated that, under these culture conditions, we were able to detect two main compound families from S. erythraea: the erythromycins and erythrochelin. Interpretation of the SIL data led to the correct prediction of the biosynthetic gene clusters for these compounds in each case. Both of these predictions match the biosynthetic origins that have been previously established,37,41 thus validating the IsoAnalyst approach.
Application of IsoAnalyst to an Environmental Micromonospora sp.
We next applied the IsoAnalyst platform to a fully sequenced Micromonospora sp. isolate from our marine-derived Actinobacterial strain library.42 We analyzed the full genome of this strain using antiSMASH and manually curated substrate predictions (Supplementary Table 7) as described above to produce the predicted BGC labeling table (Supplementary Table 2). Parallel SIL culture followed by MS analysis and data processing with the IsoAnalyst pipeline identified 246 MS features that were labeled in two or more SIL conditions. These were further filtered to 100 MS features based on chromatographic peak shape and signal intensity, as discussed above.
These 100 features could be grouped into two major compound classes based on their isotope labeling patterns (Fig. 4), both of which could be confidently linked to their respective BGCs. The first class possessed significant labeling by both [1-13C]propionate (1–2 positions) and [1-15N]glutamate (5–6 positions) (Fig 4a). The only BGC in Supplementary Table 2 containing two or more [1-13C]propionate labels and six or more [1-15N]glutamate labels is BGC 6. This hypothesis was supported by alignment with the other two SIL precursors, with significant labeling with [1-13C]acetate (2–4 positions) but no observed labeling with [methyl-13C]methionine (Fig. 4a). This group of labeled MS features was consistently associated with iron-adducts and related fragment ions, suggesting a family of related siderophores. BGC 6 was predicted to produce a siderophore by antiSMASH, and had 100% match with the BGC responsible for producing desferrioxamines B (8) and E (9).43
Figure 4: SIL incorporation and structures for selected labeled ions detected in the Micromonospora sp. metabolome.
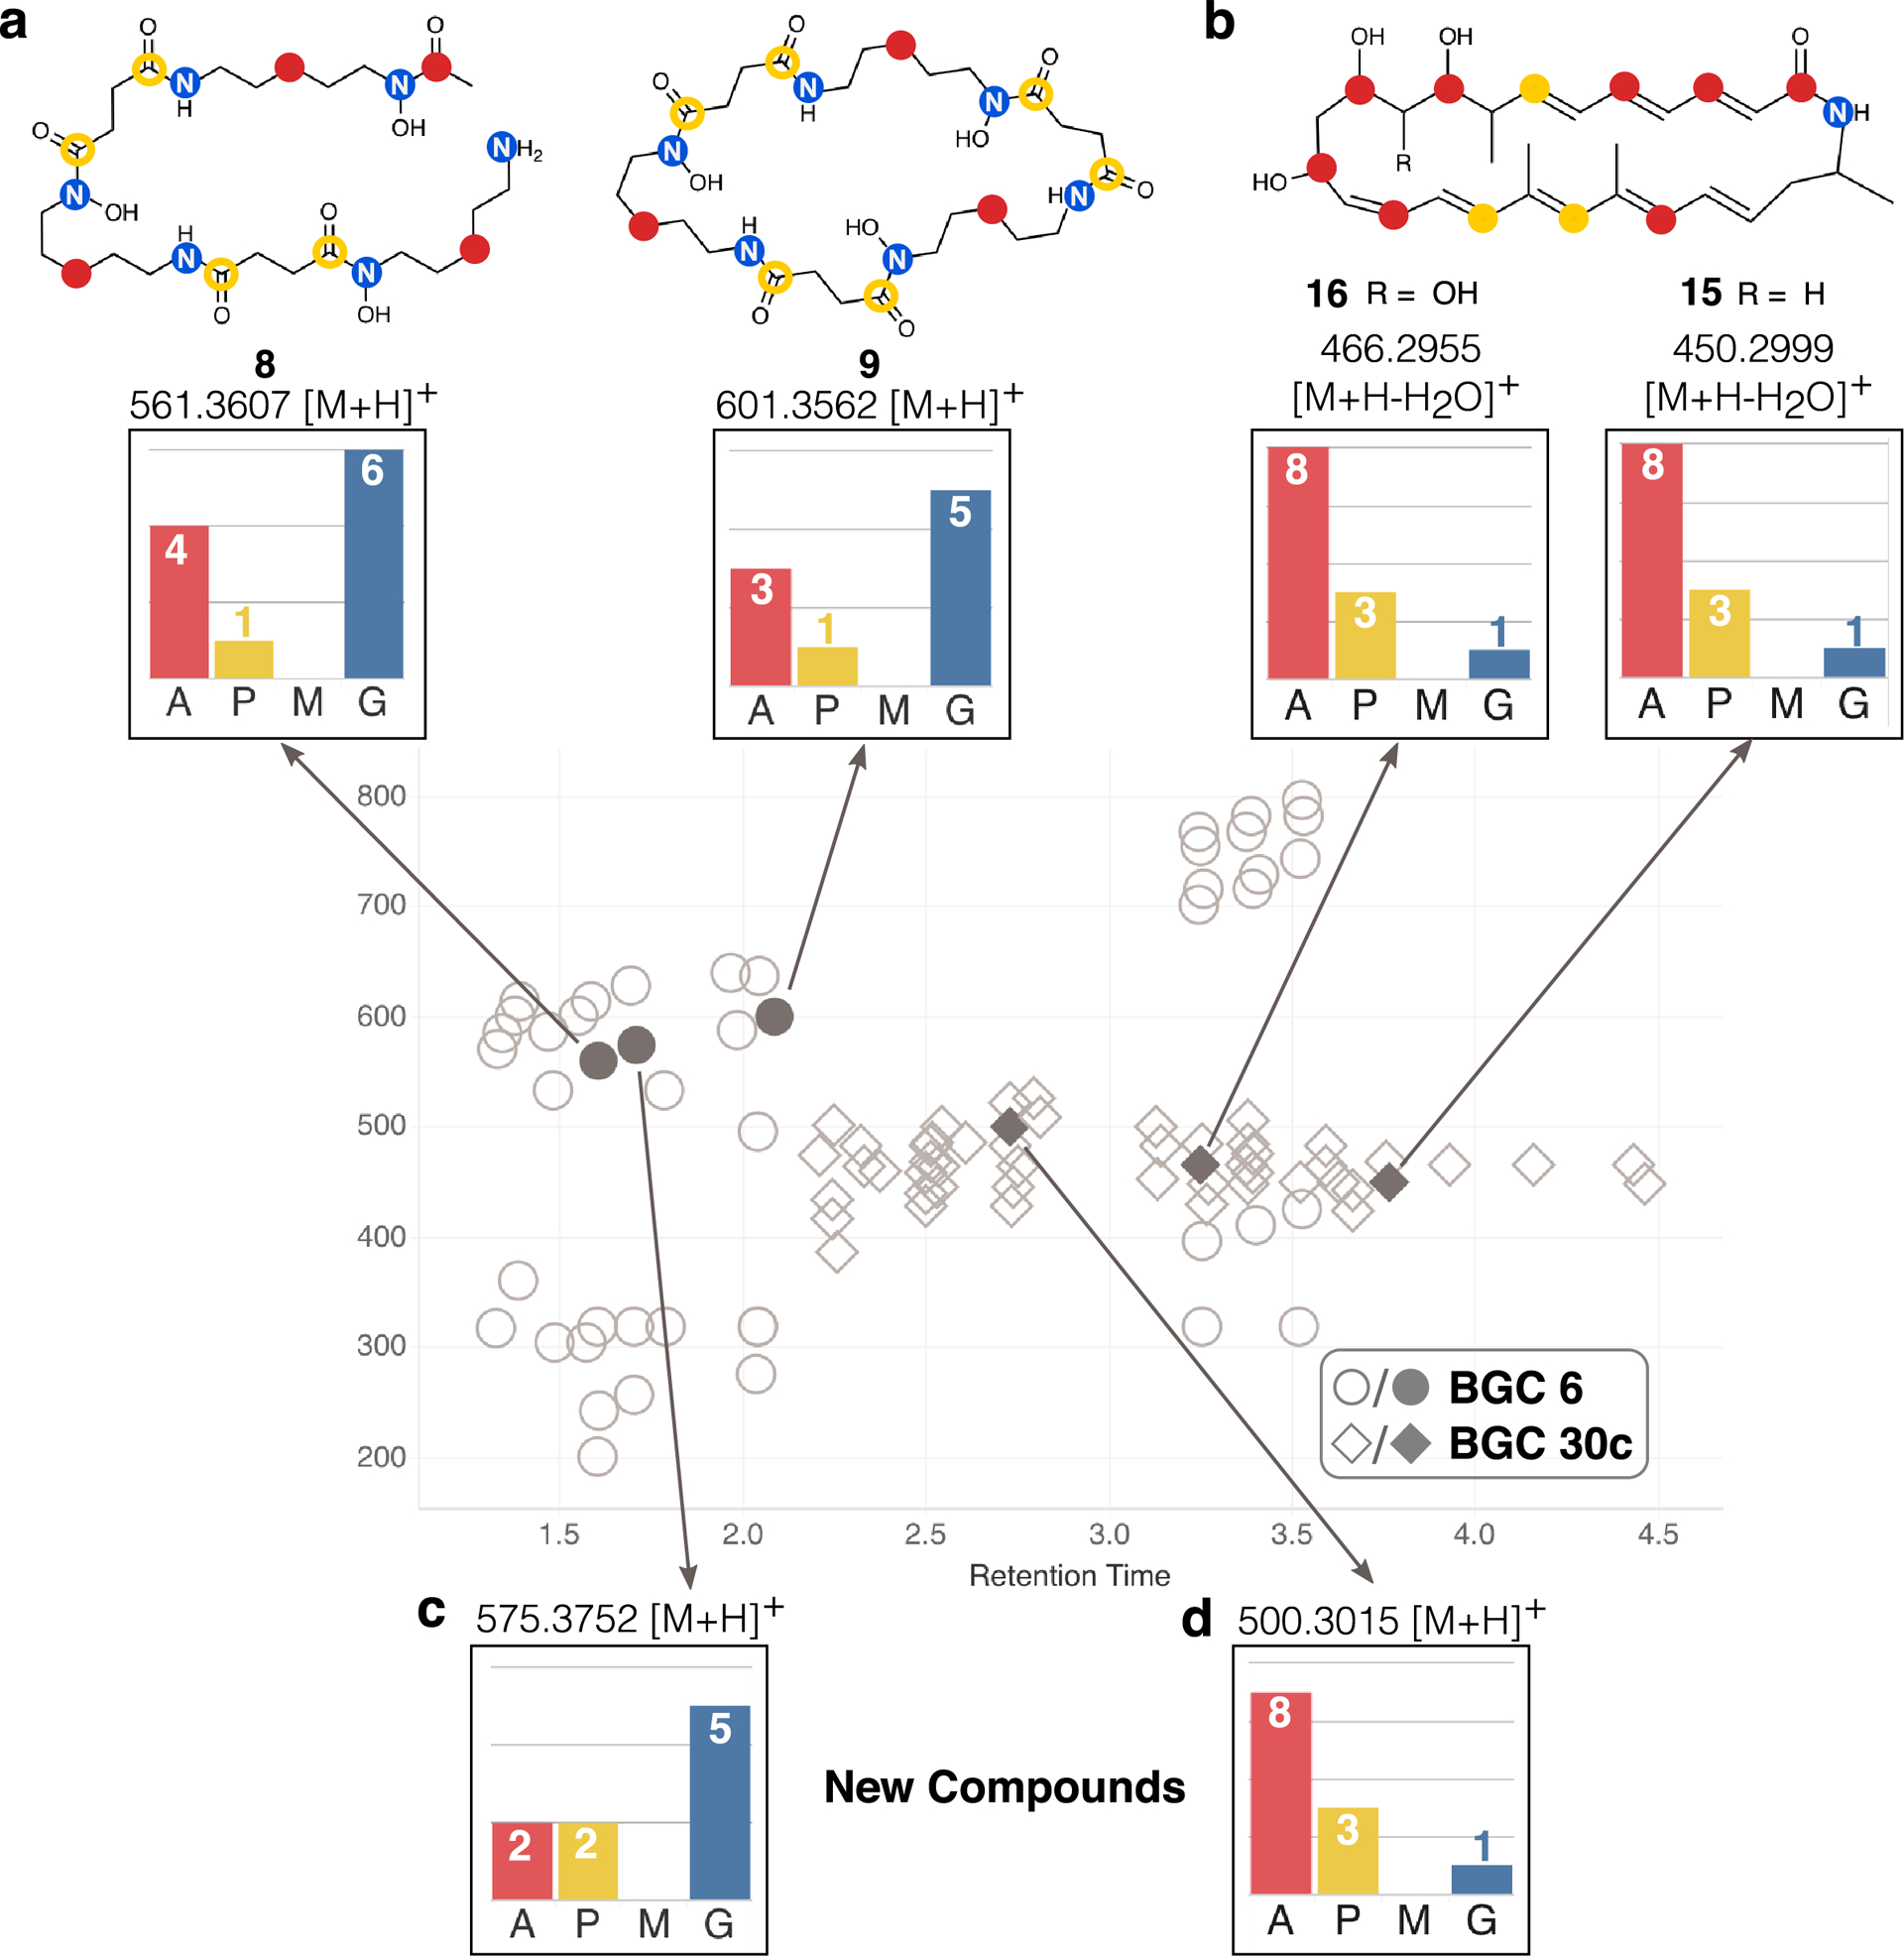
Label incorporation from feeedstocks [1-13C] acetate (A), [1-13C] propionate (P), [methyl-13C] methionine (M), and [1-15N] glutamate (G) are shown. (a) SIL incorporation in ions corresponding to desferrioxamine compounds (represented as gray circles). Open yellow circles on structures represent ambiguous labeling positions, where [1-13C] propionate may be incorporated into either position, but not both, due to the symmetry of succinate which can be interchanged with succinyl-CoA. (b) SIL incorporation in ions corresponding to lobosamide compounds (represented as gray diamond shapes). (c) SIL incorporation detected for an MS feature corresponding to the [M+H]+ ion of an unknown desferrioxamine compound. (d) SIL incorporation detected for an MS feature corresponding to the [M+H]+ ion of an unknown lobosamide compound.
Enrichment of SIL in compound 8 was detected for all six nitrogens derived from lysine in the [1-15N]glutamate condition, four of the six expected subunits in the [1-13C]acetate condition, and one of the two expected subunits in the [1-13C]propionate condition (Fig. 4a). Labeling by [methyl-13C]methionine was not detected in 8 or any related compounds. Six known desferrioxamine derivatives (8 – 13) were identified based on MS spectra, database matching, and the manual interpretation of SIL patterns. The identities of all compounds were confirmed by co-injection with authentic standards (Extended Data Fig. 6, Supplementary Figs. 14–19). Desferrioxamine E (9) and D2 (10) are cyclized derivatives of the ferrioxamine scaffold,44 and microferrioxamines A (11), B (12), and C (13) are linear aliphatic siderophores containing acyl chains of varying lengths45 (Extended Data Fig. 7).
In addition, we observed one molecule with a diagnostic ferrioxamine labeling pattern and iron-adduct that had no match in existing natural products databases (Fig. 4c). This unidentified molecule possessed an [M+H]+ adduct at m/z 575.3752 corresponding to the molecular formula C26H50N6O8 suggesting an analogue of 8 containing an additional CH2 subunit. This putative desferrioxamine derivative (14) showed related labeling to 8, with a nearly identical labeling pattern in the [1-15N]glutamate condition, but decreased labeling by [1-13C]acetate, and increased labeling by [1-13C]propionate (Extended Data Fig. 8a). Detailed examination of the fragmentation data revealed that the terminal acetate subunit in 8 was replaced by a propionate unit in 14 (Extended Data Fig. 8). Together, these results show that this strain can produce a large suite of desferrioxamine derivatives, and that these ions can be easily grouped together by relating SIL patterns detected using the IsoAnalyst platform. In total, we identified seven compounds produced by the desferrioxamine BGC, including the unusual desferrioxamine analogue microferrioxamine E (14).
Discovery of Lobosamide D Using IsoAnalyst
The second major class of labeled molecules in this dataset had closely related labeling patterns in the [1-13C]acetate, [1-13C]propionate, and [1-15N]glutamate conditions (Fig. 4b). Comparison of these labeling patterns (8 × [1-13C]acetate, 3 × [1-13C]propionate, 1 × [1-15N]glutamate) to the annotated BGC list identified two BGCs with an appropriate combination of biosynthetic modules; clusters 30a and 30c (Supplementary Table 2). Both BGCs include a single [1-15N]glutamate incorporation, with BGCs 30a and 30c incorporating five and three [1-13C]propionate units respectively. Based on these data alone, the molecules could derive from either BGC 30a or 30c. However, strong and consistent incorporation of a minimum of eight acetate units in the molecules of this class thus prioritizes BGC 30c as the cluster responsible for the production of this compound family. This prediction is further strengthened by the observation that the predicted direct incorporation for BGC 30c (8 × [1-13C]acetate, 3 × [1-13C]propionate, 1 × [1-15N]glutamate) exactly matches the observed SIL patterns in the compound family (Supplementary Table 2, Fig. 4b).
BGC 30c has previously been associated with the production of the lobosamide family of natural products.42 All the major compounds in this labeled group displayed diagnostic m/z features and distinctive [M+H-H2O]+ in-source fragments consistent with the lobosamide family. The presence of lobosamide C (15) was confirmed by HPLC purification and NMR comparison (Supplementary Figs. 20–22), while lobosamide A (16) was identified in the extracts by UPLC-MS comparison to an authentic standard (Supplementary Fig. 23). Known lobosamide structures only accounted for 6 of the 53 MS features with related SIL patterns. Most of the remaining features were produced in low titer and had mass differences related to the degree of unsaturation and varying oxidations of the known lobosamide scaffold, which suggested a suite of lobosamide analogues.
We isolated a representative molecule from this class with an [M+H]+ MS feature at 500.3012 and a calculated molecular formula of C29H41NO6. Surprisingly, the 1H NMR spectrum bore low similarity to the 1H spectra for the known lobosamides (Fig. 5a), although the new compound did share the distinctive in-source dehydration adducts (Extended Data Fig. 9). No additional structurally informative MS/MS fragmentation was observed for any of the lobosamides, limiting the utility of MS/MS spectral matching for compound family assignment. Using a combination of 1D and 2D NMR experiments (Supplementary Fig. 25–35), we determined the planar structure of this new metabolite (Methods, Fig. 5b,c) as a 5-5-6 fused ring system variant of 16 which we named lobosamide D (17). The full absolute configuration of this new molecule was determined using a combination of extensive 1D-selective and 2D ROESY experiments, coupled with configurational assignments based on sequence data for selected keto-reductase (KR) domains42 (Supplementary Figs. 31–35).
Figure 5: Comparison of lobosamide structures and biosynthesis.
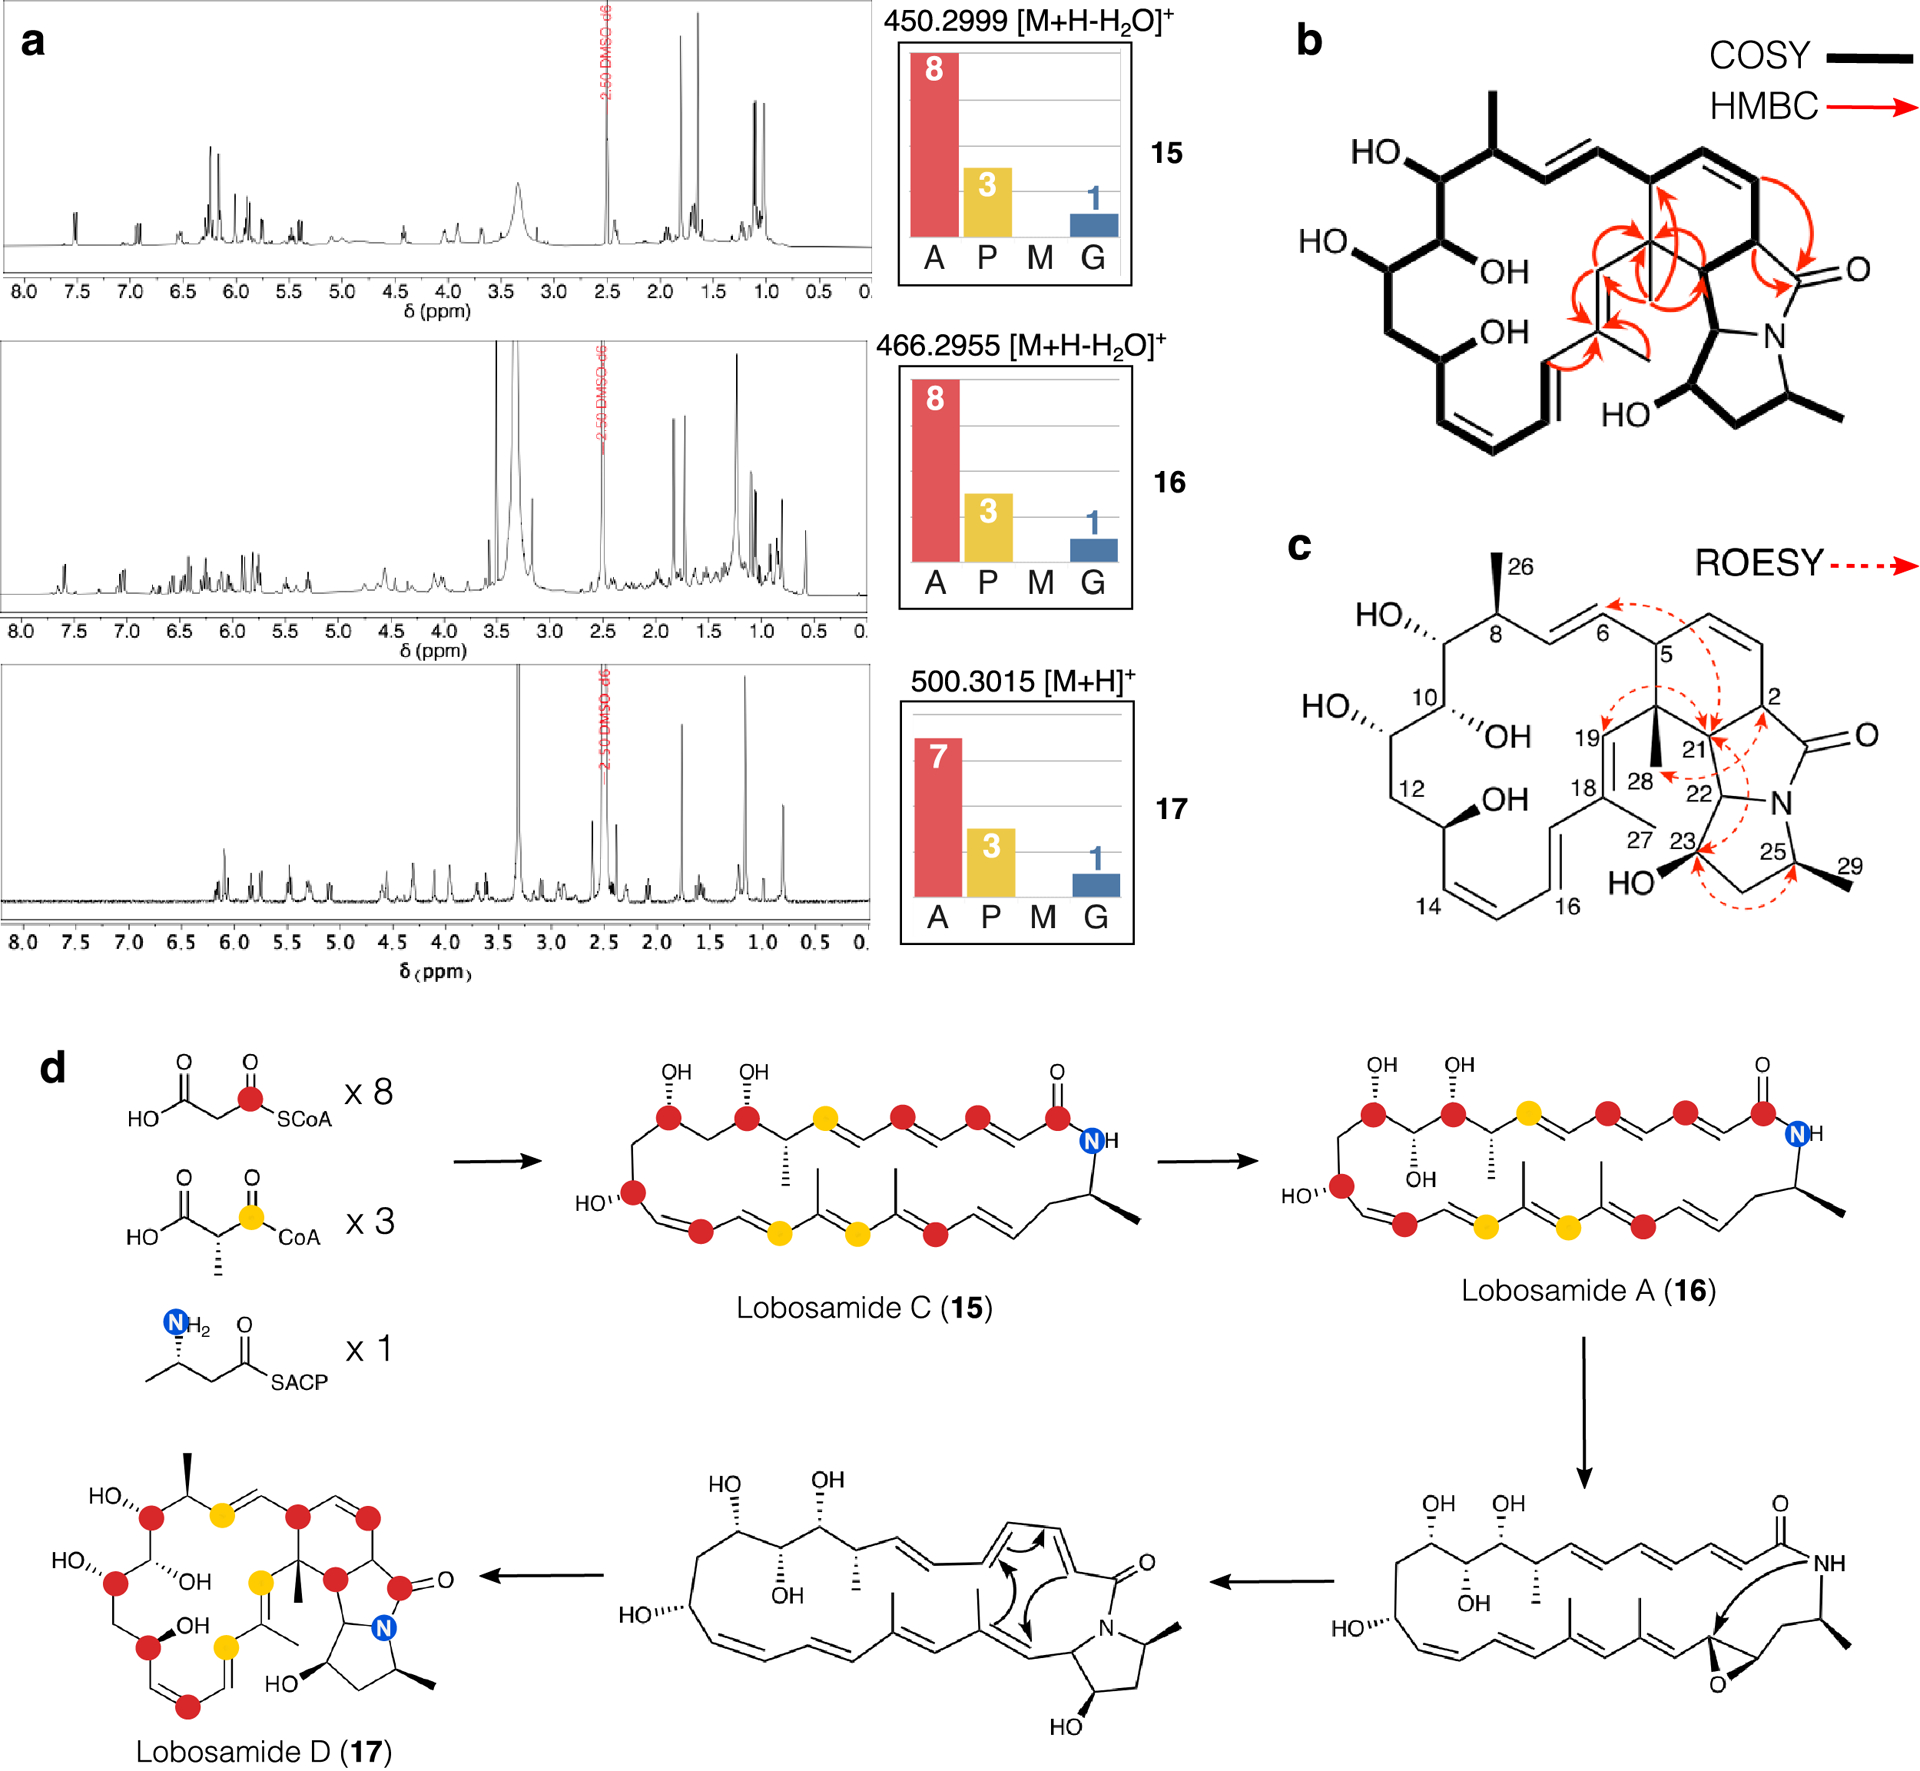
(a) Comparison of the 1H NMR spectra and SIL incorporation in of lobosamides C (15), A (16), and D (17). (b) Key COSY and HBMC correlations for 17. (c) Key ROESY correlations for 17 (d) Biosynthetic scheme for post-PKS tailoring reactions transforming 15 to 17.
The proposed biosynthesis of this new member of the lobosamide family via epoxidation followed by intramolecular cyclization (Fig. 5d) is analogous to the production of dracolactams A and B from a common macrolactam precursor46 and the production of mirilactams C-E from the macrocyclic precursor mirilactam A.47 The discovery of lobosamide D and the determination of the labeling patterns for lobosamides A and C both lend additional evidence to support the connection between this compound class and BGC 30a. Importantly therefore, IsoAnalyst is able to identify biogenetic relationships between molecules even for those which appear more distantly related based on spectral features, highlighting a key advantage of this new platform for identifying novel chemical variants within the complex molecular phenotypes of BGCs.
Discussion
Connecting metabolites to their cognate BGCs has long been a challenge for the field of natural products science. It is difficult or impossible to predict the precise structure(s) produced by most BGCs, which is further complicated by the fact that most BGCs produce a series of related molecules. Similarly, it can be challenging to determine which peaks in untargeted MS metabolomics experiments derive from specialized metabolism, and which of these peaks are biosynthetically related. Using generalist precursors that are incorporated into a wide range of BGC substrates, the IsoAnalyst platform makes it straightforward to highlight major components in the chromatogram that derive from specialized metabolism. For example, in the analysis of the Micromonospora sp. we observed 1,444 MS peaks with intensities greater than 1e4, of which just 246 had detectable labeling in at least two conditions. Among these, 51 had labeling patterns consistent with the lobosamide BGC. Relationships between SIL patterns therefore allow users to group metabolites into compound families and to identify adducts and in-source fragments from the same molecule, further simplifying the description of the specialized metabolome.
IsoAnalyst prioritizes discovery on the basis of biosynthetic relatedness rather than MS/MS profiling or bioactivities, both of which can provide complementary information but may also vary substantially across families of biosynthetically related compounds.48,49 For example, the lobosamide family shares distinctive in-source dehydration adducts, but these signals are not effective for structural characterization by MS/MS due to limited additional fragmentation. Lobosamide D was quickly and definitively associated with other lobosamide compounds on the basis of SIL incorporation, while chemical characterization data such as MS fragmentation and NMR provided only ambiguous evidence for the association of this family of compounds. This illustrates how IsoAnalyst is a powerful approach for characterizing complex chemical phenotypes and discovering novel chemical variants produced by both known and unknown BGCs.
A number of challenges remain that preclude the universal detection of all specialized metabolites in a given culture. The ability to detect and map compounds to BGCs is governed by both BGC annotation and precursor selection. The BGC substrate analyses of the organisms used in this study indicate that NRPS and PKS BGCs are most well suited to discovery using this approach. There are several reasons for this bias. BGC identification and annotation tends to be most reliable for these two well-studied biosynthetic classes. Future improvements in BGC informatics, particularly in the area of substrate prediction for less well studied BGC classes, will increase the coverage of the IsoAnalyst method. Likewise, SIL precursor selection has an important impact on BGC class coverage. For example, terpenes will only have robust SIL incorporation with [1-13C]acetate if the organism possesses the mevalonate pathway. Inclusion of 13C labeled IPP as an additional SIL precursor would substantially improve coverage of compounds in this class. Similarly, chorismate-derived precursors are also common and 13C-labeled chorismate or shikimate could help to prioritize specific BGC products containing these substrates. Additional SIL precursors could be included to provide labeling for specific biosynthetic classes. Future advancements in BGC annotation and SIL precursor availability offer the potential for large-scale assessment of the biosynthetic capacity of bacterial strain libraries. In summary, IsoAnalyst provides a novel and flexible approach to quickly define the overall specialized metabolome of a given bacterial culture on the basis of biosynthetic relatedness, meeting a growing need prompted by large-scale genome mining.
Methods
General Methods
Stable isotopically labeled compounds were purchased from Cambridge Isotope Laboratories, Inc. The corresponding unlabeled compounds were purchased from ThermoFisher Scientific. All solvents used for UPLC and HPLC were Optima grade, and water used for chromatography was purified by a Milli-Q water purification system. High resolution MS for pure compounds and metabolomics experiments were performed on a Water Synapt G2Si q-TOF system. NMR spectra were acquired on a Bruker AVANCE III 600 MHz spectrometer, with a 5 mm TCI cryoprobe, and referenced to residual solvent proton and carbon signals. UV spectra were obtained on an Agilent Cary 300 spectrophotometer. Optical rotations were measured on a Perkin Elmer 341 polarimeter.
Bacterial Strains
Saccharopolyspora erythraea ATCC 11635 (NRRL 2338) was purchased from ATCC (USA). Micromonospora sp. RL09–050-HVF-A was isolated and sequenced as described in Schulze et al. In short, Micromonospora sp. RL09–050-HVF-A was grown in GNZ medium and pellets were collected from a 50 mL culture by centrifugation. DNA was extracted using the Zymo Research ZR Fungal/Bacterial DNA MiniPrep Kit and the Qiagen Genomic Tip 100/G DNA Extraction Kit. DNA was then sequenced at the Institute of Genome Science sequencing facility (IGS, University of Maryland, Baltimore) using a Pacific Bioscience Sequencing machine and a 10KB insert library. The genome was assembled using the PacBio Hierarchical Genome Assembly Process (HGAP v. 07_2014). The Micromonospora sp. RL09–050-HVF-A genome was uploaded to NCBI under the accession number JAGKQP000000000 and the BioProject ID PRJNA718589.
Parallel Well Plate Fermentation and SIL Incorporation
A minimal growth medium was used for all SIL fermentation experiments (10 g of starch, 3.4 g of sodium glutamate, 0.4 g of KH2PO4, 1.2 g of K2HPO4, 1.0 g of MgSO4·7H2O, 2.0 g of NaCl, 1.0 g of CaCO3, 0.01 g of FeSO4·7H2O, 1.5 mg CuSO4·5H2O, 3.0 mg ZnSO4·7H2O, 1.5 mg CoSO4·7H2O, 1.5 mg of MnSO4·H2O, and 1.0 mg of NaMoO4·2H2O per liter of water). This medium was used for all SIL precursor conditions, except for the [1-15N]glutamate and the corresponding unlabeled glutamate control. For these conditions the same minimal medium was prepared with 50% of the standard amount of unlabeled sodium glutamate (1.7 g/L instead of 3.4 g/L), and the remaining 50% was replaced with either [1-15N]glutamate or unlabeled glutamate by sterile filtration at the time of inoculation. The SIL feedstock compounds, [99% 1-13C]acetate, [99% 1-13C]propionate, [99% methyl-13C]methionine, and [98% 1-15N]glutamate, and unlabeled version of each compound were prepared as stock solutions in Milli-Q water and sterilized by filtration (0.2 μm filter). Bacterial inoculum was prepared by first streaking a frozen stock on a GNZ agar plate (10 g glucose, 20 g starch, 5 g N-Z-amine, 5 g yeast extract, 1 g CaCO3, and 14 g agar per liter of water) for Micromonospora sp. and ISP agar plate (3 g yeast extract, 5 g acid hydrolyzed casein, and 14 g of agar per liter of water) for S. erythraea. Single colonies were selected to inoculate a 7 mL liquid culture of either GNZ or ISP media. Once turbid growth was observed in rich media, 50 μL of this culture was used to inoculate a 7 mL culture of the same minimal media to be used in the SIL experiment. After 24 hours of growth, this culture was used for the inoculation of the microtiter plates. The same culture was used as inoculum for all replicate wells of every feedstock condition in a given experiment. The 24-well microtiter plates and sandwich covers used for micro-scale bacterial cultures were purchased from Enzyscreen B.V. (The Netherlands) and the protocol for microtiter well plate fermentations was adapted from Duetz et al..50
The 24-well microtiter plates were cleaned and sterilized according to Duetz et al.,50 and 2 mL of minimal media was added to each well. The first and last columns in each 24-well plate were left with sterile media and the inner 16 wells were inoculated with 80 μL of bacterial inoculum. Following inoculation, either an SIL compound or the corresponding unlabeled compound was added to each well by sterile filtration. Four replicate wells were prepared and inoculated for each condition, including unlabeled controls. Unlabeled control cultures were included for each feedstock condition to account for metabolic changes that may occur as a result of adding the precursor compound. The SIL feedstock compounds were tested at various concentrations as indicated in the following sections. Stock solution concentrations were adjusted according to the final desired concentration of each SIL or unlabeled precursor in the culture so that a minimal volume of 20–100 μL of stock solution was added to each well. The replicate cultures were fermented and analyzed separately and therefore account for technical variation in both the fermentation experiment as well as the analytical variation in the MS data.
Microtiter plates containing SIL supplemented bacterial cultures were shaken at 200 rpm and maintained at 23.0 °C for five days. On the fifth day the cultures were extracted by adding 2 mL of Optima methanol to each well. The contents of each well were then transferred to Eppendorf tubes, sonicated for 5 minutes, and centrifuged for 1 minute at 16,000 g. Methanol/water extracts were injected directly onto the UPLC-qTOF system, or diluted to maintain the most intense signals in the chromatogram in an optimal range for both sensitivity and mass accuracy.
Optimization of Concentration and Timing of SIL Addition
In order to determine the optimal concentration for each of our SIL precursors, we performed an experiment using S. erythraea as described above with replicates of the following concentrations of each SIL: (100 mM, 10 mM, 1 mM, 0.1 mM) [1-13C]acetate, (100 mM, 10 mM, 1 mM, 0.1 mM) [1-13C]propionate, (16.5 mM, 10 mM, 1 mM, 0.1 mM) [methyl-13C]methionine, and (20 mM, 10 mM, 2mM) [1-15N]glutamate. In all conditions the total concentration of glutamate is 20 mM, as glutamate is the only nitrogen source in the minimal media. For the [1-15N]glutamate labeling condition we tested three ratios of [1-15N]glutamate and unlabeled glutamate, so that the total available nitrogen was the same in every condition. Unlabeled controls were performed as four replicates with matching concentrations of unlabeled acetate, propionate, methionine, and glutamate respectively. Erythromycin A (1) was used as a test case to determine the optimal concentrations of each SIL precursor (Supplementary Fig. 1).
To determine the optimal time point for SIL addition we performed an experiment using S. erythraea as described above, in which we added the SIL precursors (30 mM) [1-13C]acetate, (30 mM) [1-13C]propionate, (5 mM) [methyl-13C]methionine, and (10 mM) [1-15N]glutamate and unlabeled control precursors at identical concentrations, to different bacterial cultures at 0, 24, 48, and 96 hours following inoculation. All cultures were extracted and analyzed after 5 days. Erythromycin A (1) was used as a test case to determine the optimal timing for the addition of each SIL precursor (Supplementary Fig. 2). It is important to note that all experiments in this study used the same minimal medium. For experiments using different organisms or base media, precursor concentration and timing of addition should be optimized as described above.
MS Data Acquisition
Following fermentation, biological samples were diluted with an equal volume of methanol and the supernatants were subjected to chromatographic separation and mass spectrometric analysis. Chromatography was performed on a Waters I-Class Acquity UPLC system (Acquity HSS T3 1.8 μm, 2.1 × 100 mm) using a linear gradient (solvent A: H2O + 0.01% formic acid, solvent B: acetonitrile + 0.01% formic acid) of 5–98% B over 5.8 minutes, a hold a 98% B for 0.3 min followed by a 1.8 minute re-equilibration at 5% B. All mass spectra were acquired using a Waters Synapt G2Si qTOF running MassLynx v 4.1 SCN941. MS data were acquired in data-independent acquisition (DIA) mode. The MS detector range was set to 50–1500 m/z in positive mode, with a capillary voltage of 3.5 kV, and a desolvation temperature of 200 °C. IsoAnalyst currently only analyzes MS1 spectra. MS2 spectra may be acquired simultaneously as in a DIA experiment or a DDA experiment to assist in further interpretation of the labeling patterns, however IsoAnalyst does not process MS2 spectra for SIL detection. IsoAnalyst calculates isotopologue ratios using a scan by scan comparison of centroided isotopologue peaks, and therefore requires a relatively high scan rate across the chromatographic peak shape for reliable results. We used a 0.2 second scan rate with alternating MS1 and MS2 scans, resulting in an overall MS1 scan rate of 0.4 seconds. We recommend the use of a similar MS1 scan rate for data processed in IsoAnalyst in order to ensure adequate MS1 coverage across chromatographic peaks for each analyte. In particular, it is important that the number of DDA scans per MS1 scan be kept low (suggested maximum is three) to prevent large delays between MS1 scans that can negatively impact data coverage for small peaks in the chromatogram.
Standard Peak Processing to Generate Input Files for IsoAnalyst
The two types of MS data files that are required as input for IsoAnalyst are centroided scan-by-scan MS peak lists for all samples and deisotoped m/z and retention time aligned feature lists for the unlabeled control samples only (Extended Data Fig. 2a). IsoAnalyst accepts .mzML files for centroided peak lists and .csv files for deisotoped feature lists. The file importer is configured to accept feature lists from the popular open-source MS processing platform MZmine 2 by default. Feature lists from other processing software must be reformatted to match this column layout. Scan-by-scan mzML files can be generated by converting original raw mass spectrometer files to .mzML using the open-source tool MSConvert. Details about both file formats and example files are available in the README.md file in the GitHub repository. The first step of the IsoAnalyst workflow aligns the unlabeled control sample feature lists by mass and retention time to generate a ground truth list of all features detected across the unlabeled conditions. Alternatively, users may perform feature alignment by other methods and submit a ground truth feature list in the second step of IsoAnalyst, with the centroided .mzML files for all samples (Extended Data Fig. 2a).
The aligned feature lists are used to determine the monoisotopic mass (M0) and retention time range for every feature in the downstream processing steps. It is important therefore that settings used for feature detection include a deisotoping step to ensure that all features included are identified only by the M0 mass to prevent redundancy. More information about file input requirements can be found on GitHub (www.github.com/liningtonlab/isoanalyst).
Interrogation of SIL Experimental Data for Complete Isotopologue Information
Because isotope distribution patterns vary significantly between analytes, we found that existing MS analysis software could not correctly identify the M0 peak of extensively labeled features in the SIL conditions. Instead, we used the M0 of each MS feature from the ground truth list as an anchor point to interrogate the labeled MS data for relevant isotopologue distribution patterns. This was accomplished using a custom data processing script that interrogated the scan-by-scan centroided MS data from each experimental condition for the presence of each isotopologue peak (M0, M1, M2, etc) for every feature in the ground truth list (Extended Data Fig. 2b). Because the m/z value for the M0 of each feature is provided in the ground truth list, this approach can identify all isotopologues that are present in the labeled dataset, regardless of whether the M0 for that feature is present in the SIL sample data as it scans for computed m/z values. Isotopologue data are interrogated this way for both unlabeled and labeled control samples.
For identifying isotopologues in the unlabeled datasets, and in the SIL conditions containing only 13C enrichment, the mass difference of 1.00335 m/z is used. The resolving power of the system used for this study is not sufficient to differentiate between the natural occurrence of 13C and the enrichment of 15N, therefore in the [1-15N]glutamate condition the mass isotopomer peaks M1, M2, etc. represent a mixture of isotopologues containing either 15N, 13C, or some combination of both. Throughout this text we refer to all isotopically enriched peaks as ‘isotopologues,’ however we use the mass difference between 14N and 15N (0.99704 m/z) to compute the theoretical isotopologue peaks in the [1-15N]glutamate condition. The contribution of naturally occurring 13C to the isotopologue distribution in the SIL samples is accounted for in the next step, where isotopologue ratios are compared directly between labeled and unlabeled conditions.
Determination of SIL Incorporation into MS Features
In order to determine if an MS feature is isotopically enriched by a given precursor, the IsoAnalyst algorithm first determines the intensity ratio for the M1 (first isotopologue) vs M0 (monoisotopic mass) peaks for that feature in the unlabeled control condition by plotting the intensity values for M1 and M0 in each scan (Extended Data Fig. 3). Because these isotopologue intensity values are compared for a single analyte in a sample, the plot of the M1 intensity to M0 intensity is linear with the slope representing the M1:M0 ratio of that compound. The linear regression statistics were computed using the linear regression function in the scipy.stats package in Python. Any given isotopologue ratio requires a minimum of five scans in order for the linear slope, or isotopologue ratio, to be calculated as a default but this can be modified to require more or less scans.
Due to the natural abundance of 13C, the M1:M0 ratio of a compound in the unlabeled condition can be calculated based on the molecular formula and vice versa. Molecular formula prediction for untargeted MS metabolomics data to assist in compound identification is common; however, it is computationally time consuming to predict molecular formulas for thousands of features, when many of them will not have detectable SIL precursor incorporation. We opted to look directly at the natural M1:M0 ratio for each feature in the unlabeled condition, rather than predicting the molecular formula for every analyte to determine the expected M1:M0 relationship. Because all SIL precursors used in this method are singly labeled, incorporation of any SIL precursor will increase the M1:M0 intensity ratio for that condition. The M1:M0 ratio of each feature in the SIL data is then compared to the natural M1:M0 ratio for the same feature in the unlabeled samples using a two-tailed Welch’s t-test, with a p-value cut off of 0.05 (Fig. 2c,d). Although we perform a two-tailed t-test in this analysis, we only determine an isotopologue peak to be enriched in an SIL precursor if the M1:M0 ratio is significantly greater than the natural M1:M0 ratio. This is effectively a one-tailed t-test (p-value cut off of 0.025), where we use a combination of the two-tailed p-value (< 0.05) and the test statistic (< 0) to decide if a isotopologue is enriched with an SIL precursor (Fig. 2d). If the initial t-test is insignificant, the MS feature is determined to have no isotopic enrichment; if, however, the initial t-test is significant, the MS feature is annotated as isotopically enriched in that SIL precursor condition. When a feature is assigned as isotopically enriched with a given precursor, IsoAnalyst then iteratively compares the intensity ratios for subsequent isotopologue pairs (e.g. M2:M1, M3:M2 etc.) until the isotopologue ratio is no longer statistically distinguishable from the natural M1:M0 ratio. At this point isotopic enrichment can no longer be confidently assigned beyond that position (Fig. 2d). This analysis therefore assigns a minimum degree of isotopic labeling for a given precursor. A brief discussion summarizing why this statistical approach was used over other available analytical platforms for analyzing SIL MS metabolomics data can be found in Supplementary Note 1.
We use four replicates for the unlabeled control and four replicates for each SIL tracer condition in this experiment. However, in the statistical analysis we require a minimum of only three replicates for each isotopologue ratio in the Welch’s t-test to accommodate situations where a given feature is not detected in one of the replicates or is not detected in at least five scans for the linear regression analysis. Supplementary Table 4 shows the power analysis for the data table shown in Figure 2d using the TestIndPower function from the statsmodels library in Python. This analysis is performed on data from just three replicates (due to a technical problem with data acquisition for the fourth replicate for the labeled version of this sample) and was selected in order to evaluate the method with minimal replicates in the experimental condition.
All of the isotopologue ratios which have statistically significant p-values in Supplementary Table 4 also have power values of 1.0 in this analysis. The only isotopologue ratio which was not significant (M5:M4, p-value 0.14) had a power value of 0.52 indicating that these groups cannot be differentiated by a sample size of N = 3. Very small differences that are within the standard deviation of the mean values being compared are not detectable using this sample size, such as the M5:M4 ratio (Supplementary Table 4). However, because the standard deviations are overall very low in these measurements, relatively small differences can still be statistically detected, such as in the M4:M3 and M6:M5 ratios (Supplementary Table 4). Therefore, even in situations where a feature is only observed in three replicates, the analysis has power to support the determination of maximum labeled isotopologue values.
IsoAnalyst evaluates every MS feature in the ground truth list in each labeling condition in order to determine both whether the feature is isotopically enriched in that condition, and how many positions can confidently be assigned as labeled. These data create a profile for each MS feature indicating the extent of labeling in each SIL precursor tested (Fig. 2e). The final step is to combine the labeling information into a summary file with every feature from the ground truth-list and the number of SIL precursors detected in each condition (Extended Data Fig. 2b).
Biosynthetic Gene Cluster Substrate Annotation
The genomes of S. erythraea NRRL 2338 and the Micromonospora sp. isolate were first mined for BGCs using antiSMASH-DB (entry generated with antiSMASH 5.2) and antiSMASH web server v6.0.0 respectively, resulting in the discovery of 36 BGCs for S. erythraea and 26 BGCs for the Micromonospora strain. Predicted BGCs were used to list the type and number of substrates needed to biosynthesize the product. In some cases, such as for NRPS, our analysis provided input for the predicted substrate specificity of each BGC domain detected, which helped to list the various expected amino acids used as a substrate. Likewise, the PKS domain architecture information was used to assess the number of expected acetate, malonate, methoxymalonate, and methylmalonate substrate building blocks incorporated into the polyketide. In some cases, the output from this analysis was further investigated by looking at the closest associated MIBiG entry for each BGC to find more information on the expected substrates and other chemical moieties likely to be incorporated based on similarity of enzyme-coding genes to those found in experimentally characterized pathways. Literature information and uniqueness of enzymatic domains present were taken into consideration in generating the substrate predictions for every BGC in each genome, shown in Supplementary Data 1 and 2. These tables include computationally predicted substrates where possible and expert knowledge on biochemical pathways where needed and possible based on known enzyme functions, for example in the case of methylations by SAMs.
Large-scale fermentation, extraction, and fractionation of S. erythraea and Micromonospora sp.
S. erythraea and Micromonospora sp. were each grown in 2.8 L Fernbach flasks containing 20.0 g of Amberlite XAD-16 adsorbent resin, a stainless-steel spring, and 1 L of the minimal media as described above for use in the SIL experiments. All large-scale fermentations were done without the supplementation of SIL precursors. Cultures were shaken at 200 rpm for 6 days, at which time the cultures were filtered by vacuum filtration on Whatman glass microfiber filters. The cells and resin were collected and extracted with 250 mL of 1:1 methanol/dichloromethane. The organic extract was collected by vacuum filtration and dried by rotary evaporation. The crude organic extract was initially separated into seven fractions by a stepwise methanol/water elution (10, 20, 40, 60, 80, 100 vol/vol) and an additional ethyl acetate wash step on a RediSep Rf C18 cartridge (Teledyne Isco) using a Teledyne Isco CombiFlash Rf flash chromatography system.
Isolation of compounds 2 and 3
Purification of compounds 2 and 3 was performed on a Waters Autopurification system with a SQ Detector 2 quadrupole MS detector. Both compounds were purified from the 60% methanol extract fraction. For all HPLC purification of 2 and 3 solvent A was water with 0.02% formic acid and solvent B was acetonitrile with 0.02% formic acid. The 60% methanol pre-fraction was separated by HPLC (Waters Atlantis T3 prep OBO column 5 μm, 19 × 250 mm) using an elution gradient of 45–83% B over 21 minutes, at a flow rate of 20 mL/min. Erythronolide B (2) was collected at 6.5 minutes by mass detection for the ion m/z 425.4 and 3 was collected at 9.5 minutes by mass detection for the ion m/z 529.4. 3-O-α-mycarosylerythronolide B (3) was further purified using an isocratic gradient of 42% B, with MEB eluting from the column at 11.8 minutes. 2.5 mg of 2 and 4.5 mg of 3 were isolated in total and analyzed by NMR for comparison to authentic standards (Supplementary Figs. 3–12).
Isolation of compounds 15 and 17
Purification of 15 and 17 was carried out using an Agilent 1200 series HPLC system. Lobosamide C (15) (0.7 mg) was isolated from the 100% methanol pre-fraction by HPLC (Phenomenex Kinetix XB-C18 5 μm, 250 × 4.6 mm) using an isocratic separation (45% methanol + 0.02% formic acid, 45% H2O + 0.02% formic acid, and 10% isopropyl alcohol with 0.02% formic acid) with a flow rate of 1.2 mL/min for 20 minutes. Lobosamide C (15) was eluted from the column at 34.4 min and was collected by UV detection at 300 nm. Lobosamide D (17) (0.4 mg) was isolated from the 40% methanol pre-fraction by HPLC (Phenomenex Kinetix XB-C18 5 μm, 250 × 4.6 mm) using an isocratic separation (23% acetonitrile + 0.02% formic acid and 77% H2O + 0.02% formic acid) with a flow rate of 1.2 mL/min for 20 minutes. Lobosamide D (17) was eluted from the column at 15.0 min and was collected by UV detection at 280 nm.
Lobosamide D (17) chemical characterization
[α]D = −166.7 (c 0.042, MeOH); UV (MeOH), λmax 275 nm, log Ɛ = 3.45; HRMS (m/z): [M+H]+ calcd. for C29H41NO6, 500.3007; found, 500.3012. (see Supplementary Table 3 for NMR shifts), SMILES: C[C@H]1C[C@@H](O)[C@]2([H])[C@@]3([H])[C@]4(C)/C=C(C)/C=C/C=C\[C@H](O)C[C@H](O)[C@@H](O)[C@H](O)[C@@H](C)/C=C/[C@@H]4C=C[C@]3([H])C(N12)=O
Extended Data
Extended Data Fig. 1. TCA cycle labeling by [1-13C]acetate.
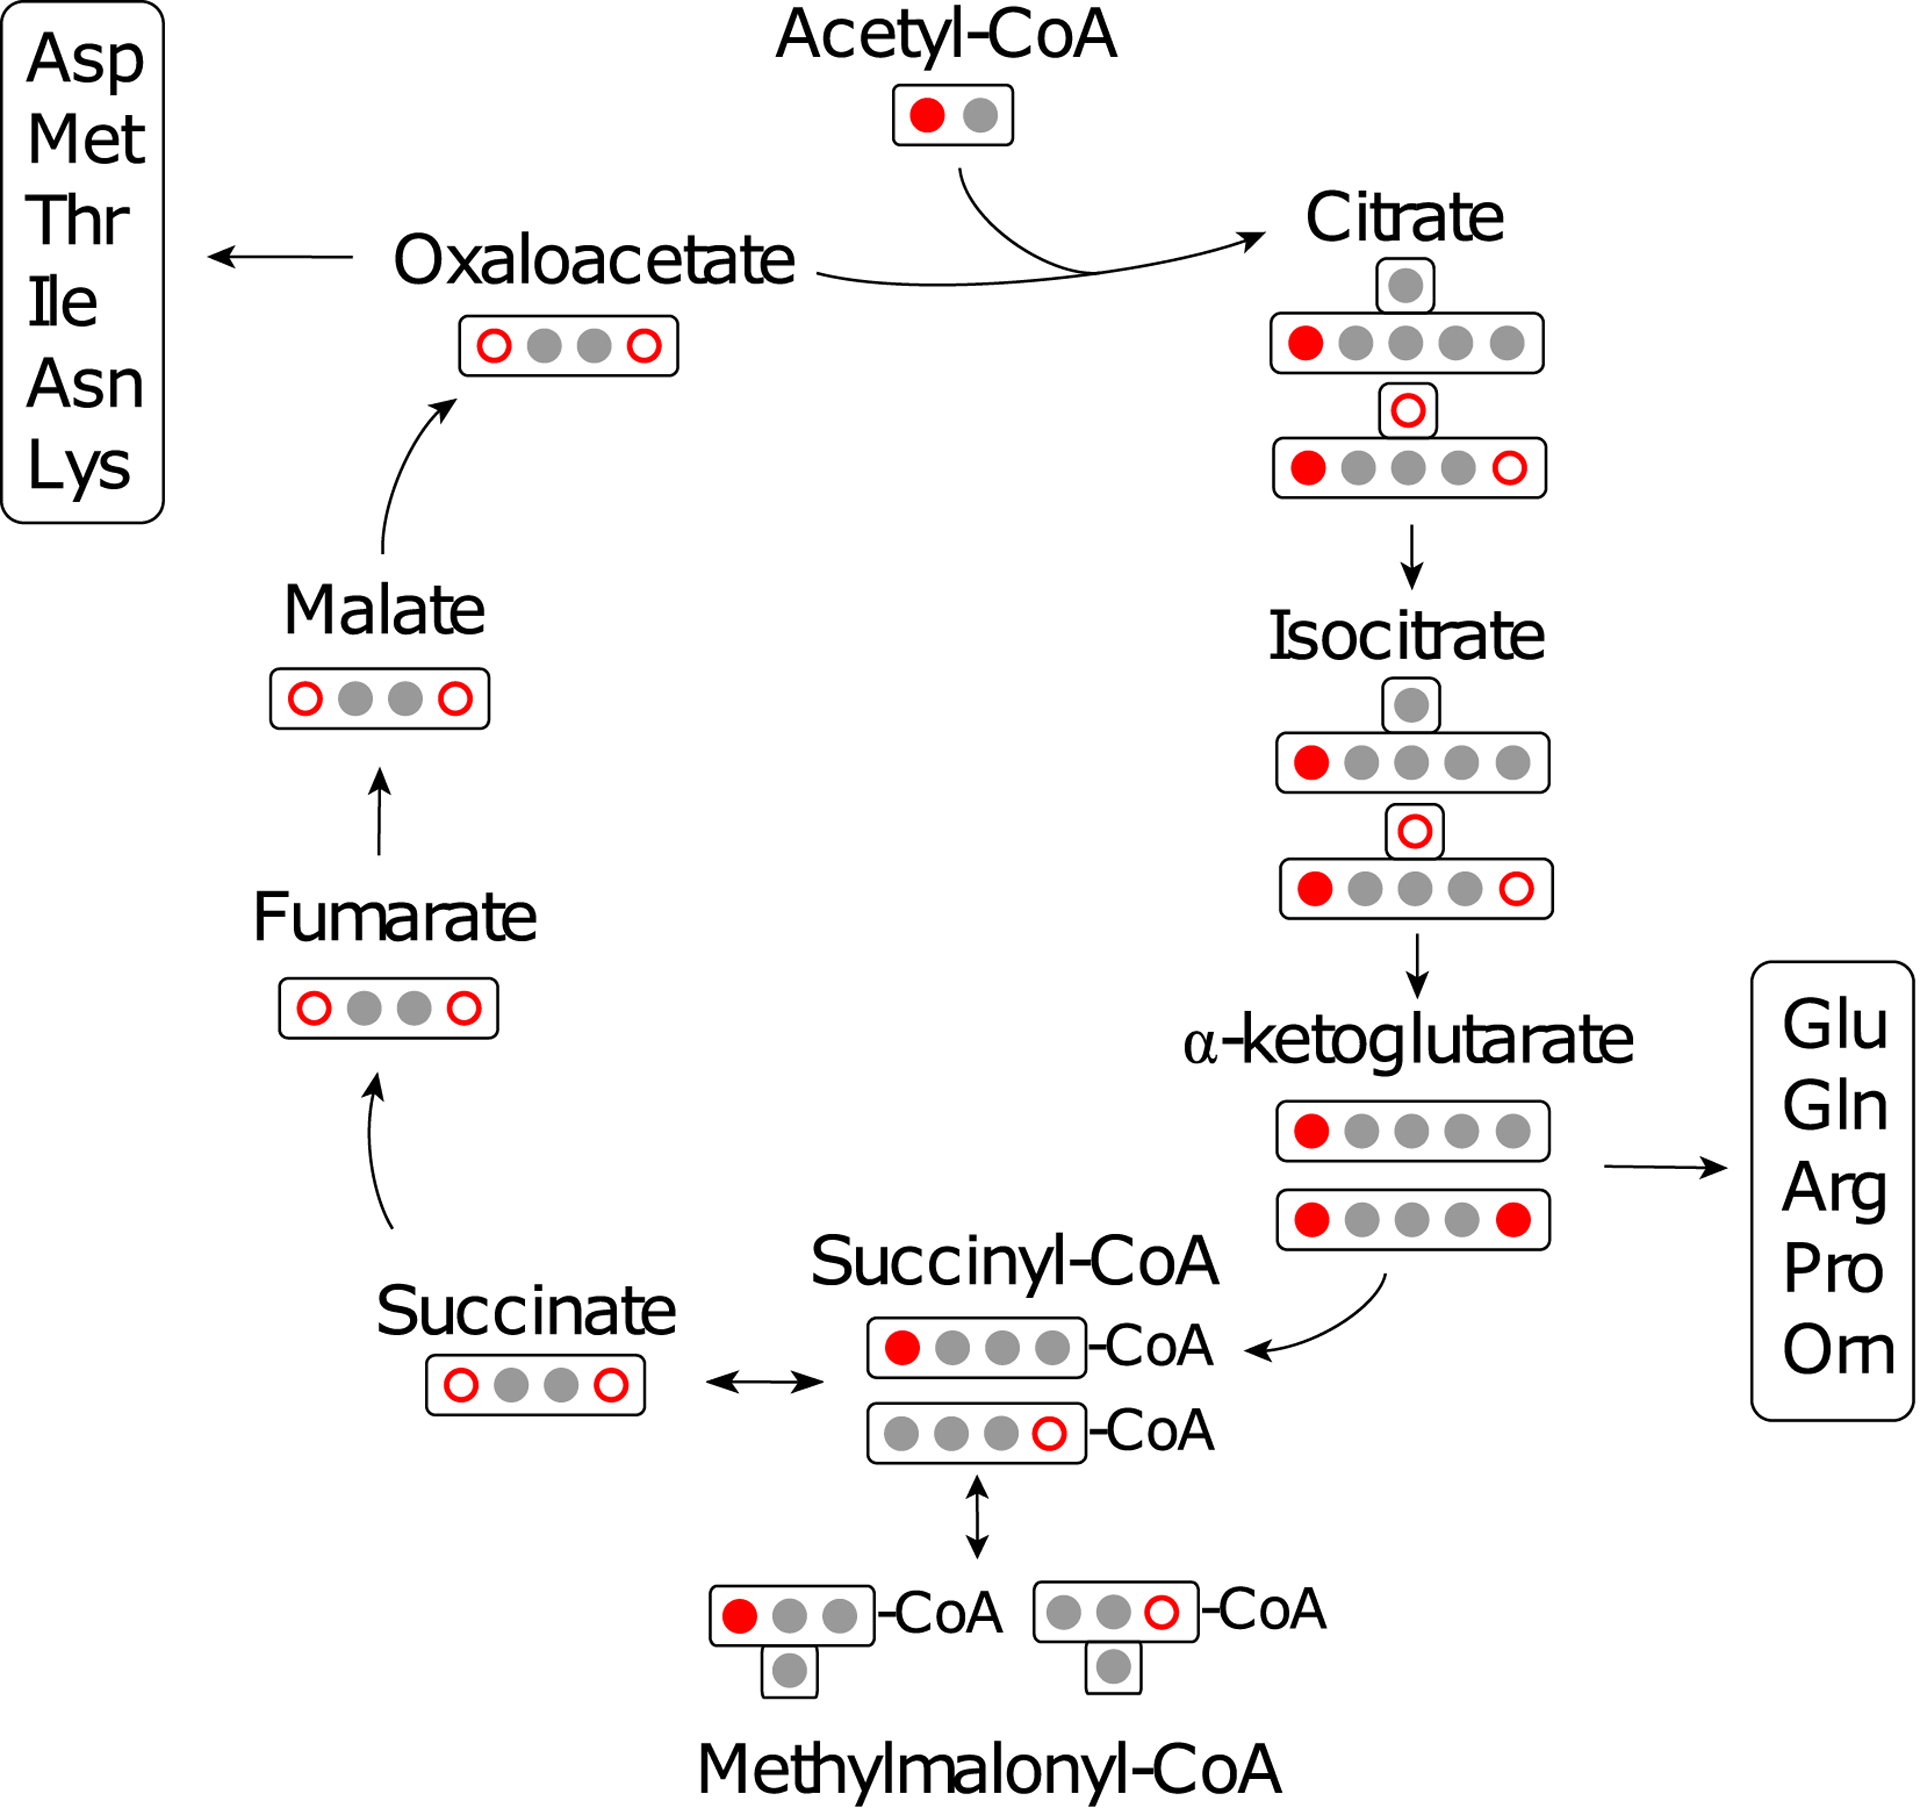
Red filled circles represent 13C derived from [1-13C]acetate following its direct transformation to acetyl-CoA. When a 13C labeled succinyl-CoA is converted to succinate, the position of the 13C label becomes ambiguous due to the symmetry of succinate, represented by open red circles, indicating that either position has an equal chance of being labeled. Labeled oxaloacetate re-enters the TCA cycle resulting in up to two 13C incorporation events in citrate, isocitrate, and a-ketoglutarate. Groups of amino acids that are derived from TCA cycle biosynthetic precursors are indicated. The interconversion of succinate and succinyl-CoA leads to the indirect incorporation of 13C into the C1 position of methylmalonyl-CoA as indicated by an open red circle while the direct labeling of the C4 position of methylmalonyl-CoA is lost to decarboxylation during the PKS condensation of methylmalonyl-CoA units.
Extended Data Fig. 2. IsoAnalyst MS data processing workflow.
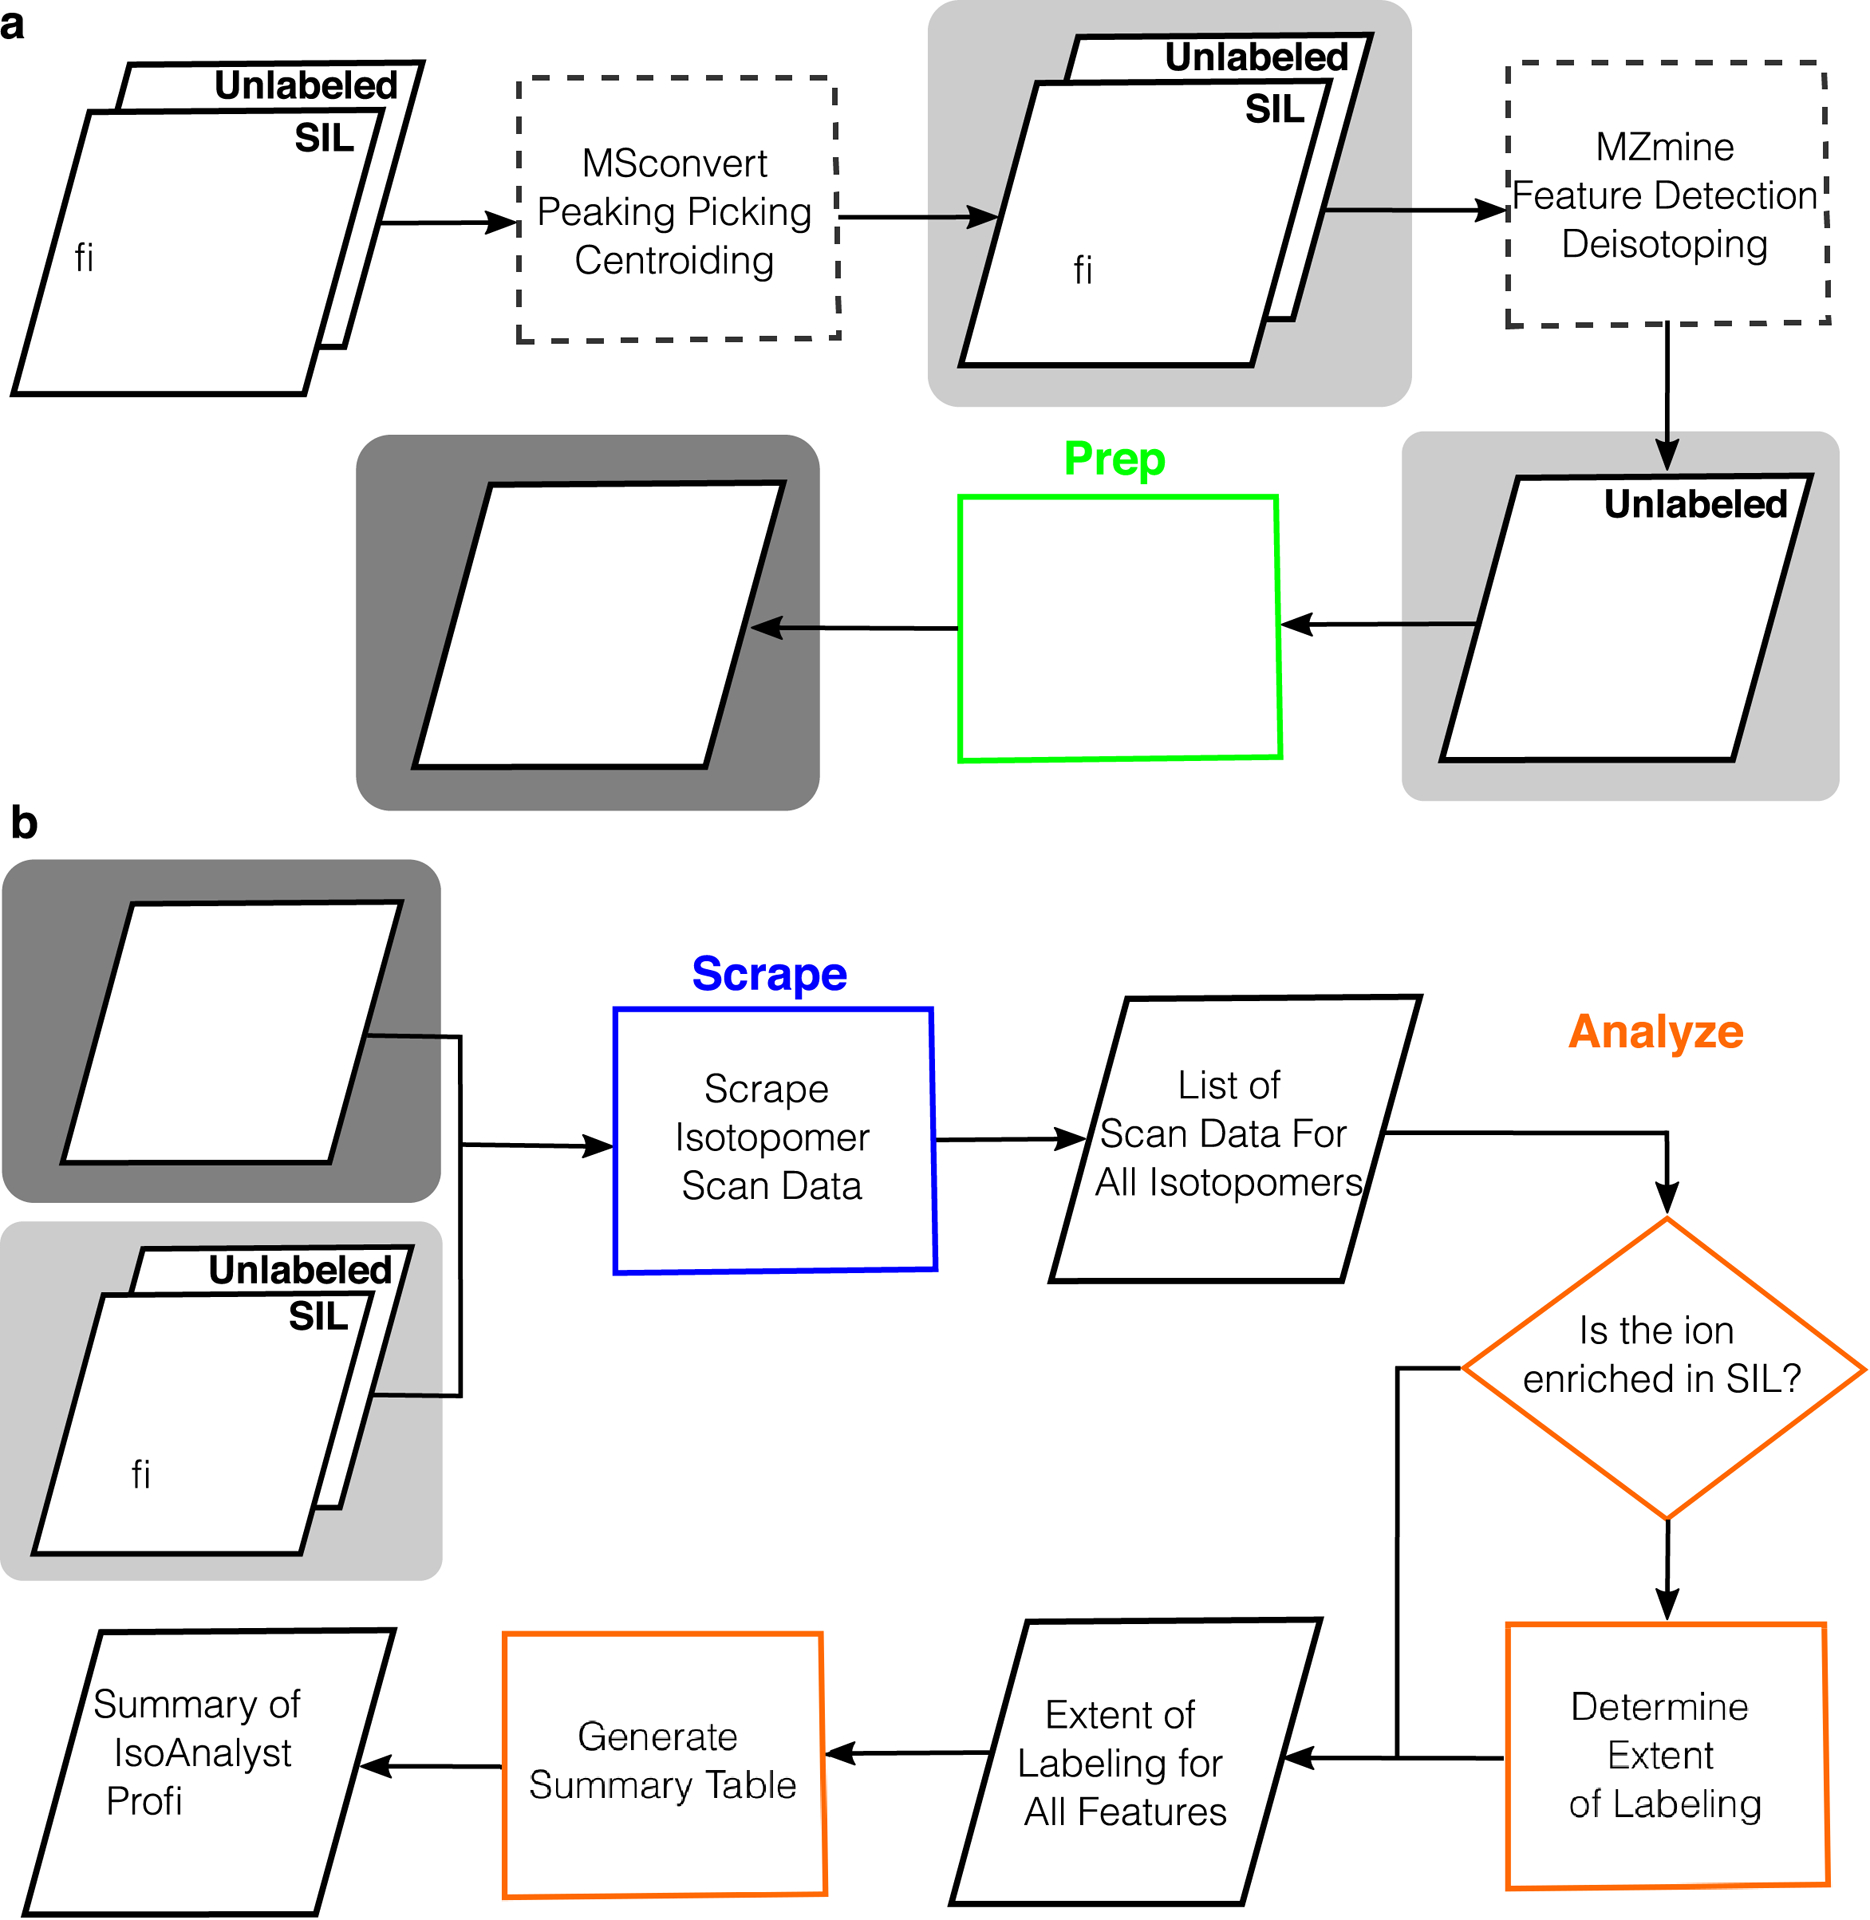
(a) Required data pre-processing steps to generate input files for IsoAnalyst. Files (indicated as parallelograms) highlighted with a light gray box are required input files generated by third party tools that can perform the processes shown in dashed rectangles. We recommend MSconvert and MZmine for these processes however other programs may be used as long as the .csv input meets the requirements described in the software documentation available in the GitHub repository. The ground truth feature list of features aligned across samples is highlighted in a dark gray box and may be generated by the ‘Prep’ step of the IsoAnalyst program (highlighted in green) or by third party tools (e.g., MZmine). (b) IsoAnalyst performs the following steps: all isotopologue peak information for every feature is first scraped from the .mzML data files in the ‘Scrape’ step (highlighted in blue). In the ‘Analyze’ step (highlighted in orange), the isotopologue ratios are compared for every feature in each SIL condition to determine the extent of labeling. Finally, a summary file is generated containing all of the SIL incorporation profiles for every feature that contains labeling in two or more conditions.
Extended Data Fig. 3. MS Data centroiding and isotopologue ratio plotting.
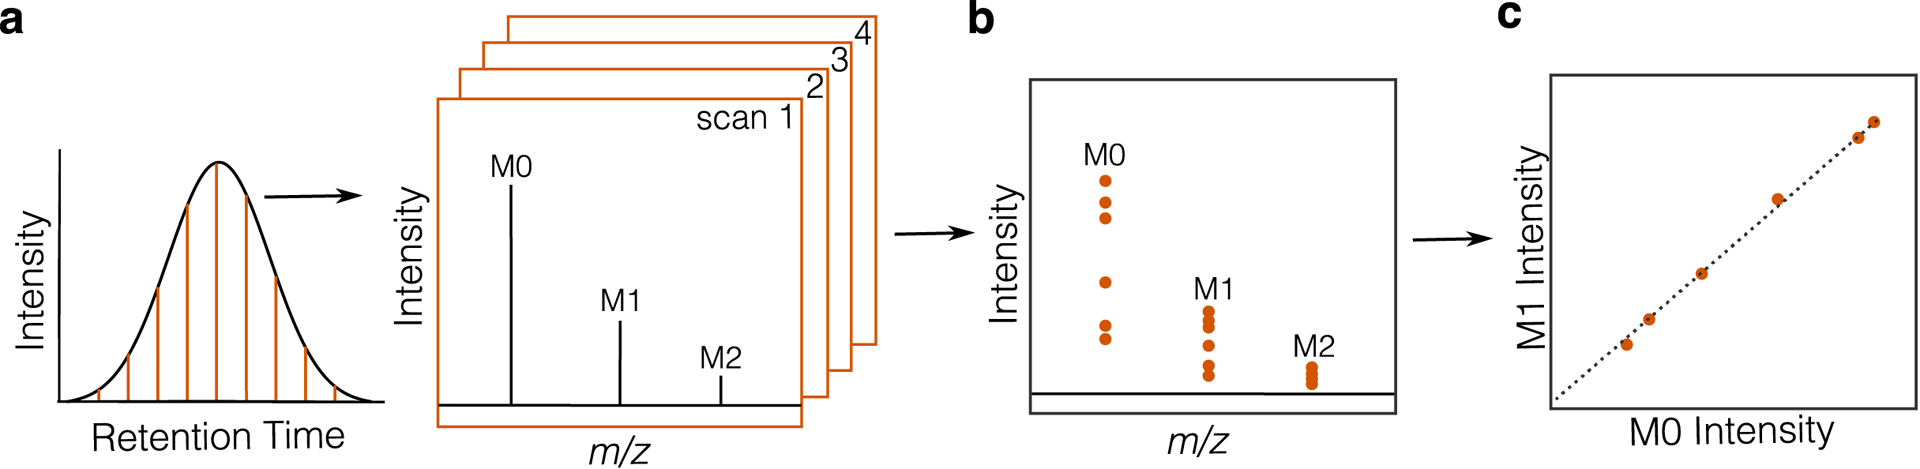
(a) Diagram of LC-MS data acquisition showing mass spectra collected at regular time intervals across a chromatographic peak. Each orange line represents a single mass spectrum, or scan, containing m/z vs. intensity values across the instrument’s range. Data are first centroided, or peak picked, to give a single data point corresponding to the intensity of every m/z value in a scan. (b) All centroided scan data for a given feature plotted together as single points. (c) All centroided scan data for the first two isotopologue peaks, M1 and M0, plotted by matching scans. The slope of the linear trend line in (c) is the isotopologue ratio used in the analysis step of the IsoAnalyst workflow.
Extended Data Fig. 4. SIL incorporation for erythrochelin (7).
(a) Substrates used in the biosynthesis of 7, and both the expected and observed labeling of 7. (b) Structures and mass spectra for the iron adduct (m/z 657.2064) and the protonated adduct (m/z 604.2950) of 7 in the [1-13C]acetate and [1-15N]glutamate conditions. [1-13C]Propionate and [methyl-13C] methionine conditions are not shown as 7 was not produced under the [1-13C] propionate condition and no SIL incorporation occurred under the [methyl-13C]methionine condition.
Extended Data Fig. 5. SIL incorporation in fragments of 7.
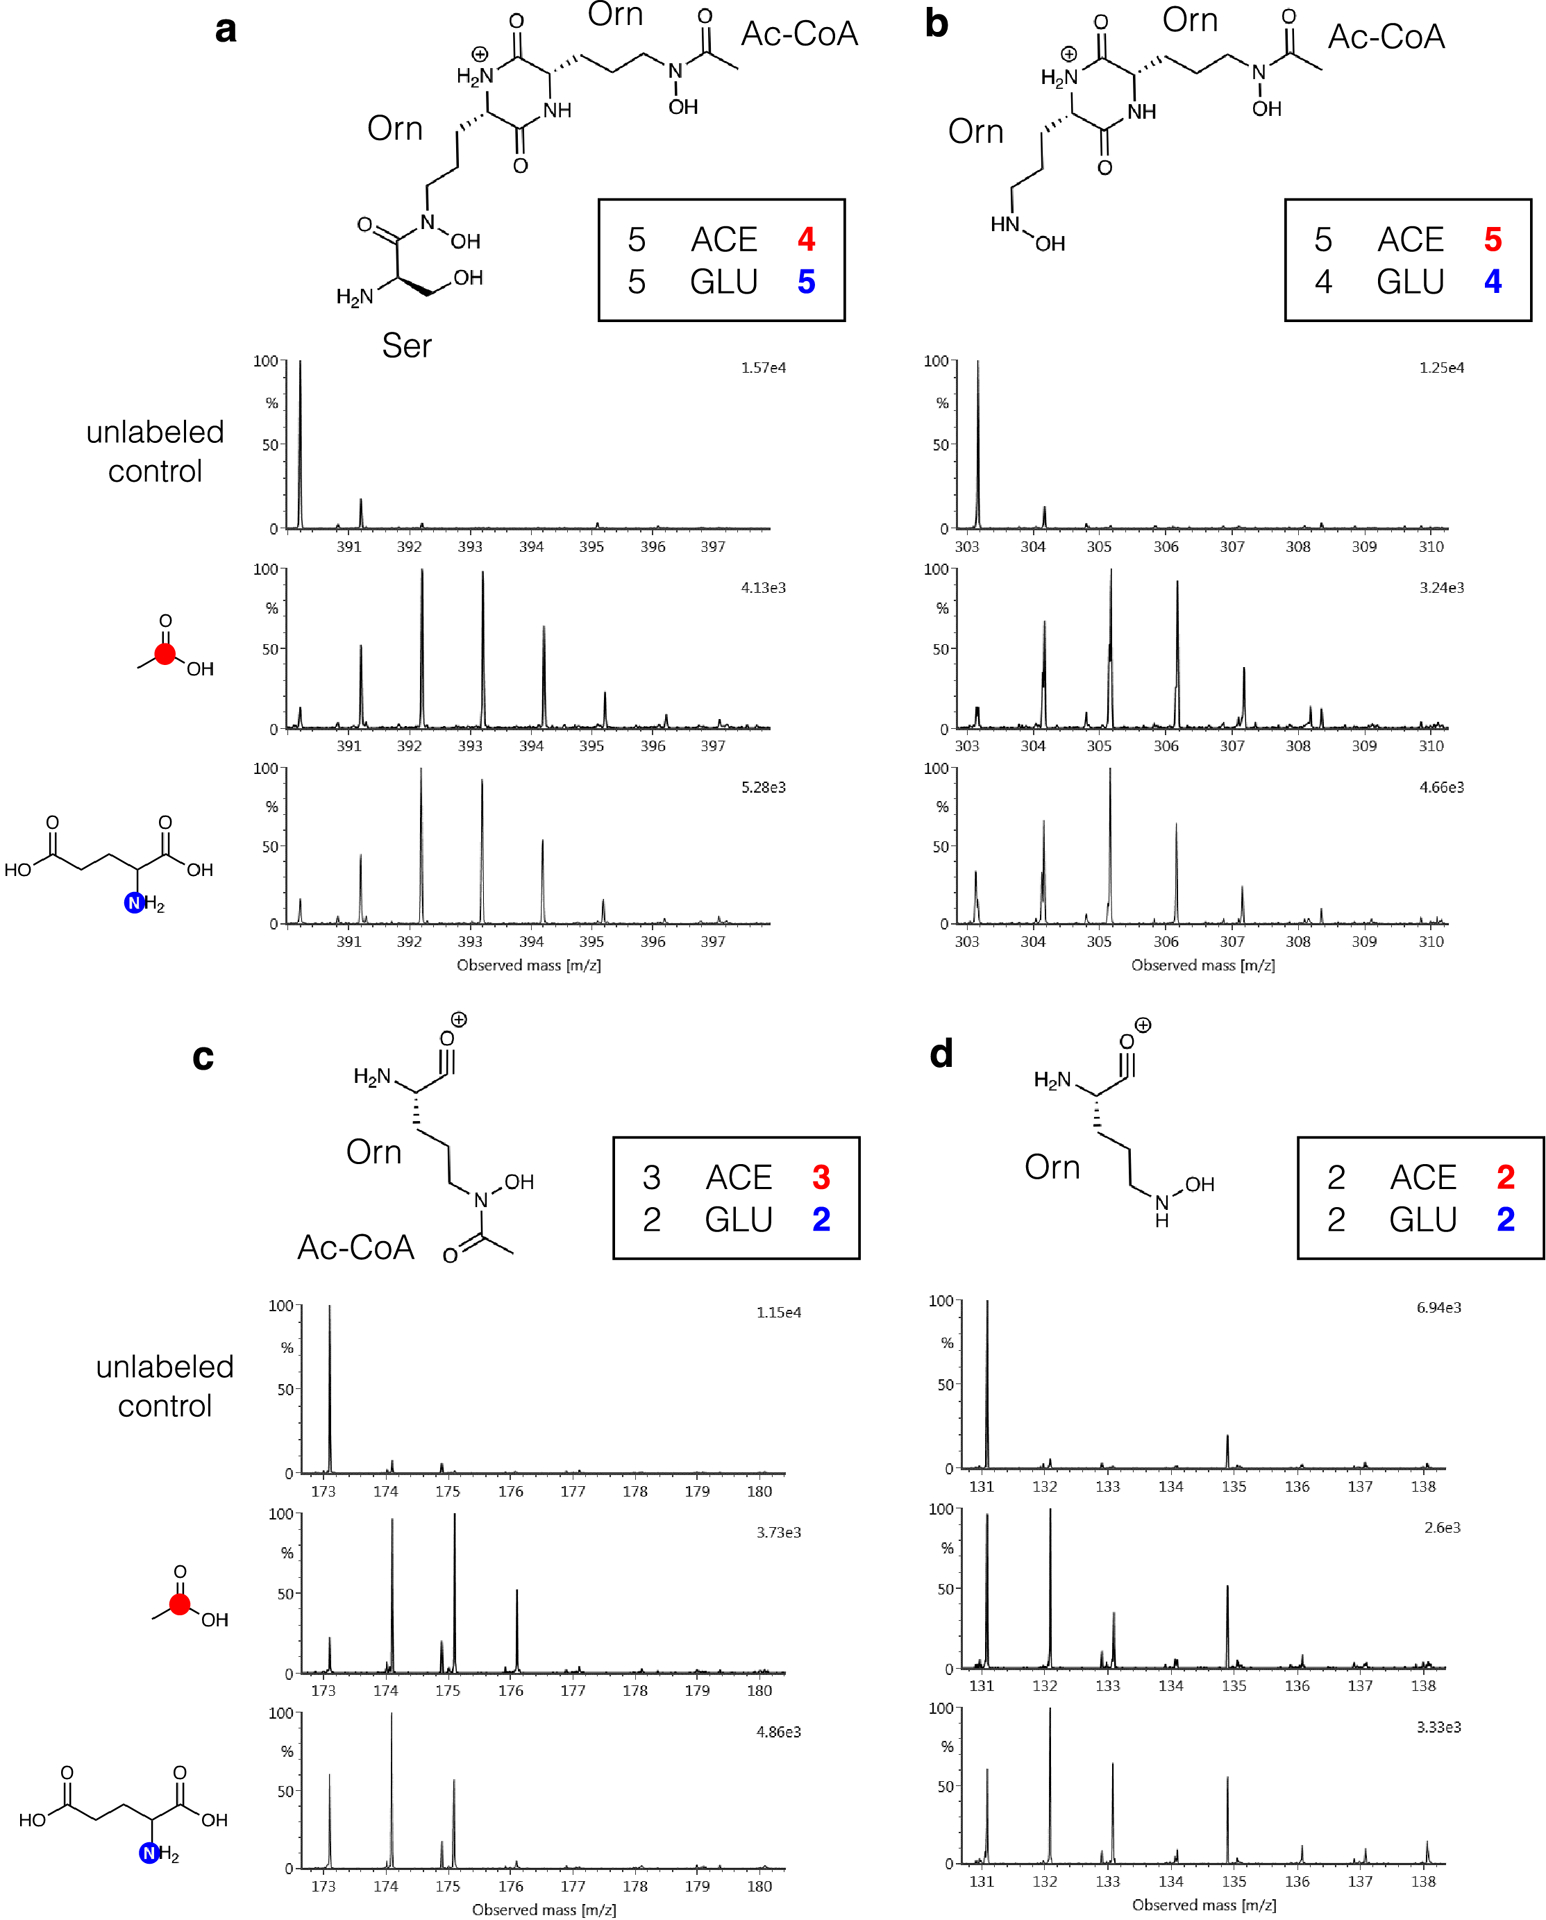
Mass spectra of fragments m/z 390.1990 (a), m/z 303.1666 (b), m/z 173.0932 (c) and m/z 131.0827 (d) under [1-13C]acetate and [1-15N]glutamate conditions indicate that the detected SIL incorporation is within the expected labeling maximums for the biosynthetic subunits derived from ornithine and acetyl-CoA.
Extended Data Fig. 6. IsoAnalyst profiles for desferrioxamine analogues.
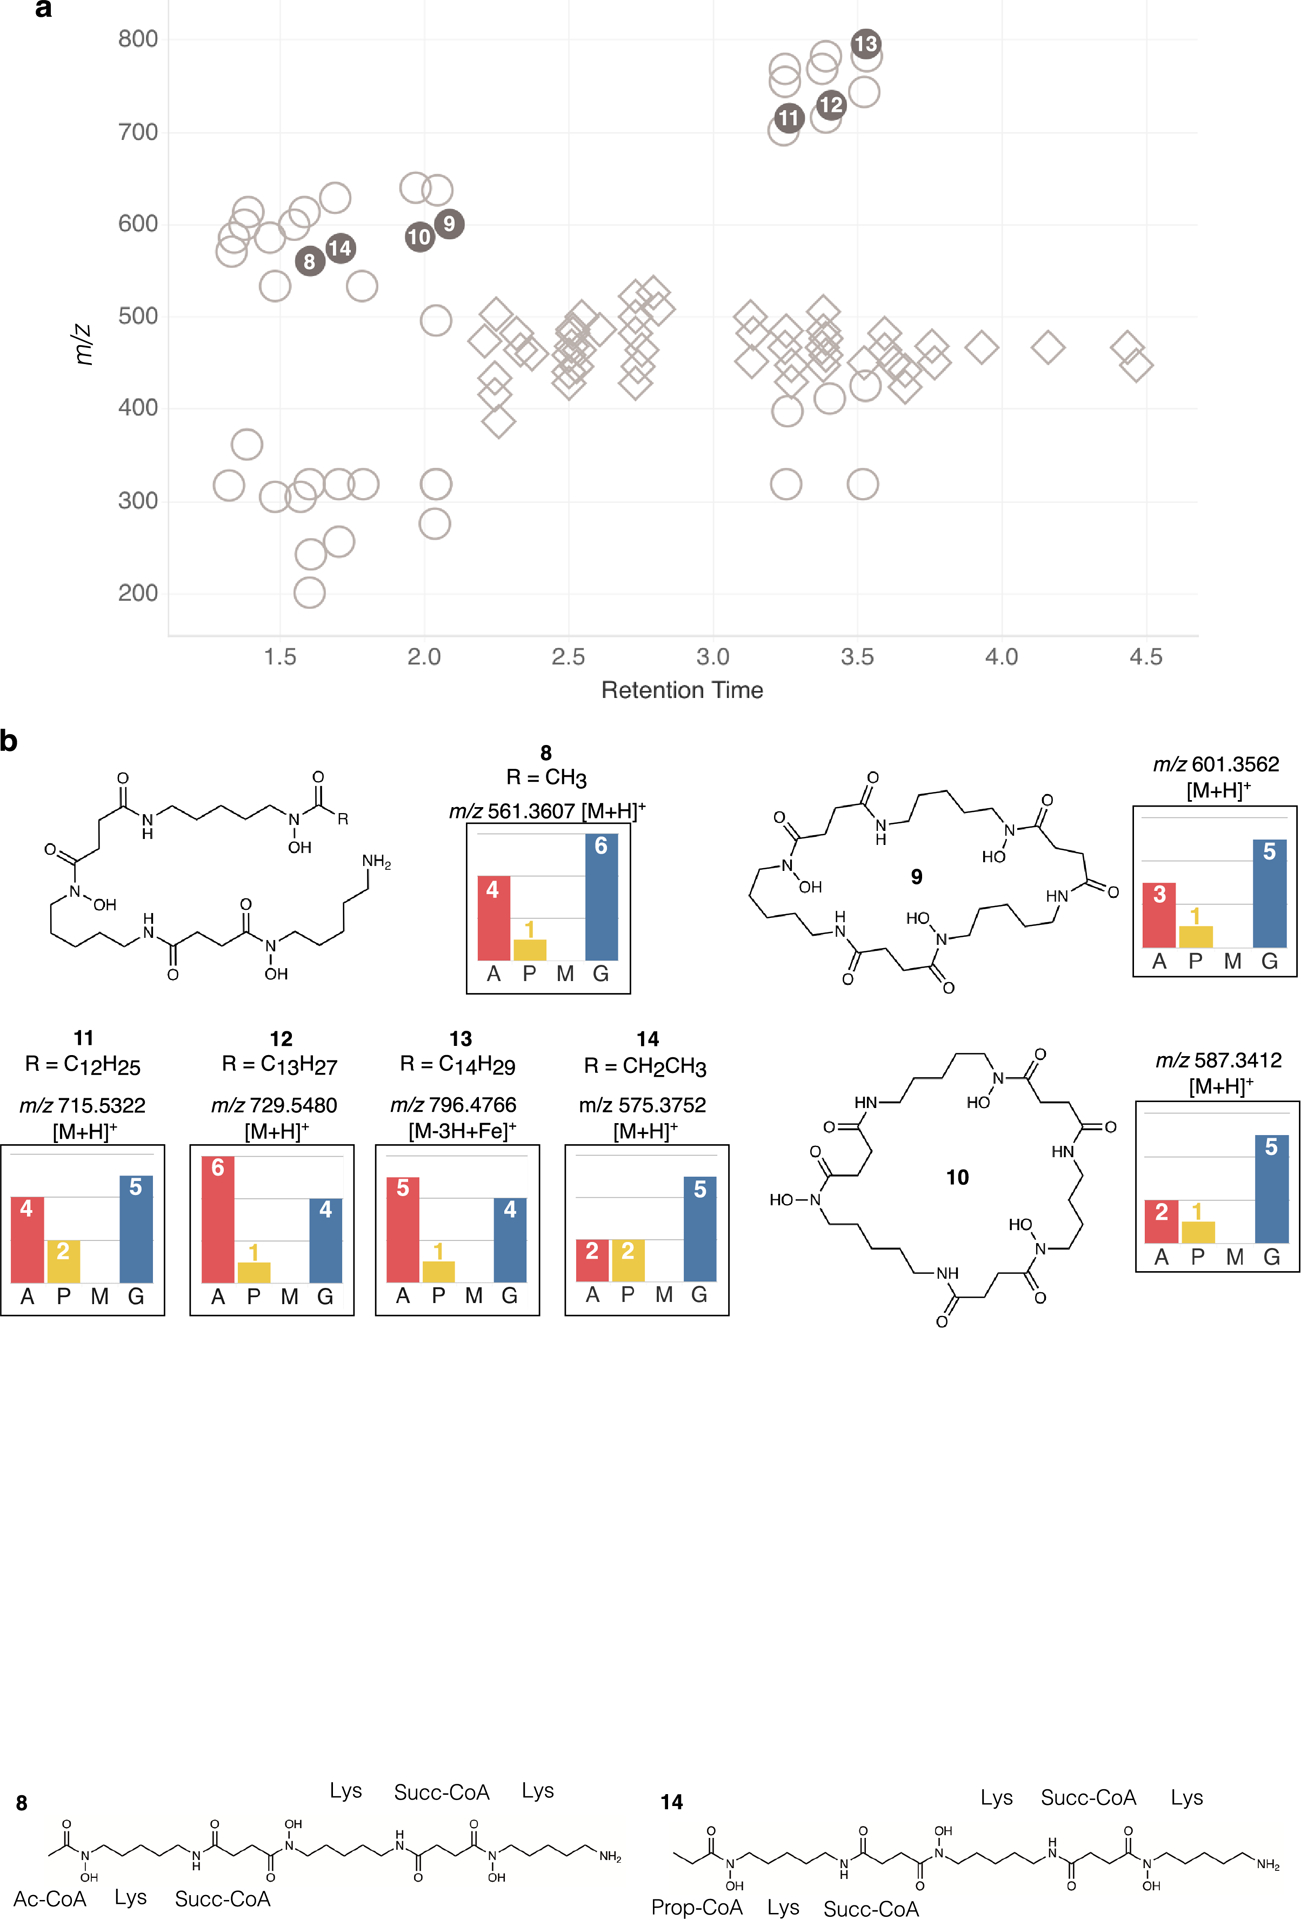
(a) Diagram showing all labeled MS features detected in the metabolome of Micromonospora sp. Circles represent features with IsoAnalyst profiles resembling the desferrioxamines. Diamonds represent features with IsoAnalyst profiles resembling the lobosamides. (b) Structures and IsoAnalyst profiles for desferrioxamine compounds indicated by filled gray circles in (a).
Extended Data Fig. 7. IsoAnalyst profiles of microferrioxamines and their fragments.
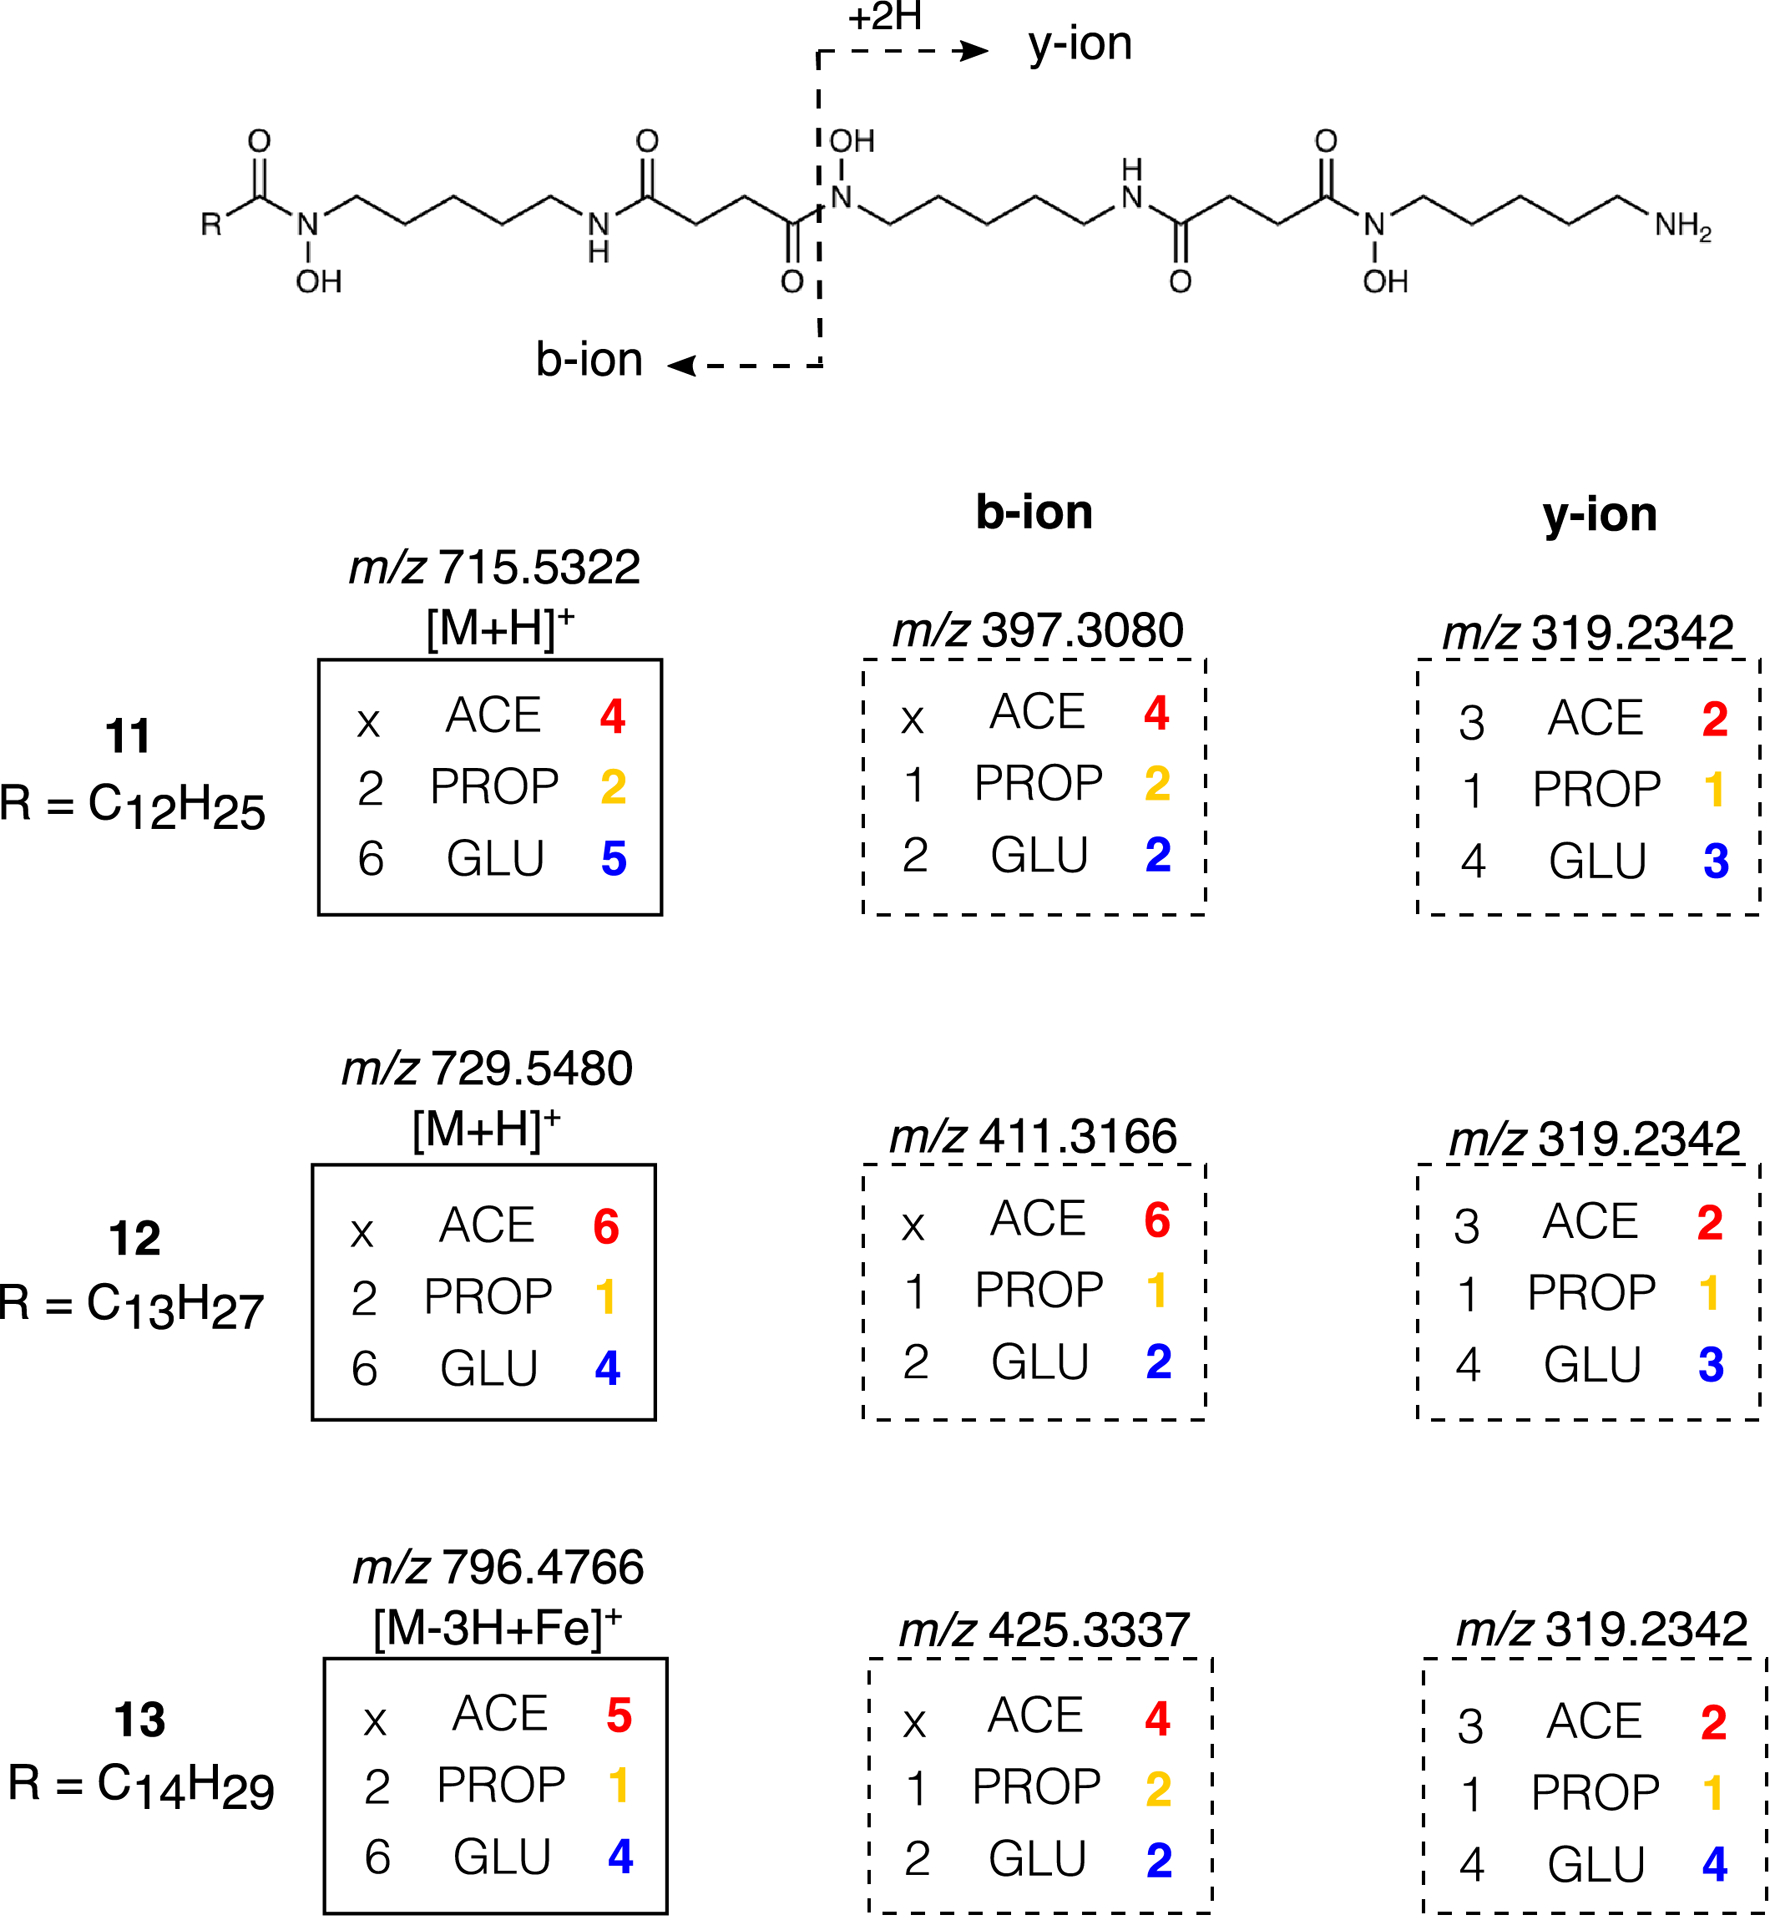
Each box contained the expected and observed SIL incorporation for various ions associated with compounds 11, 12, and 13. Due to the substrate flexibility of the acyl transferase DesC,39 the exact number of acetate-derived subunits cannot be accurately predicted.
Extended Data Fig. 8. IsoAnalyst profiles of desferrioxamines and their fragments.
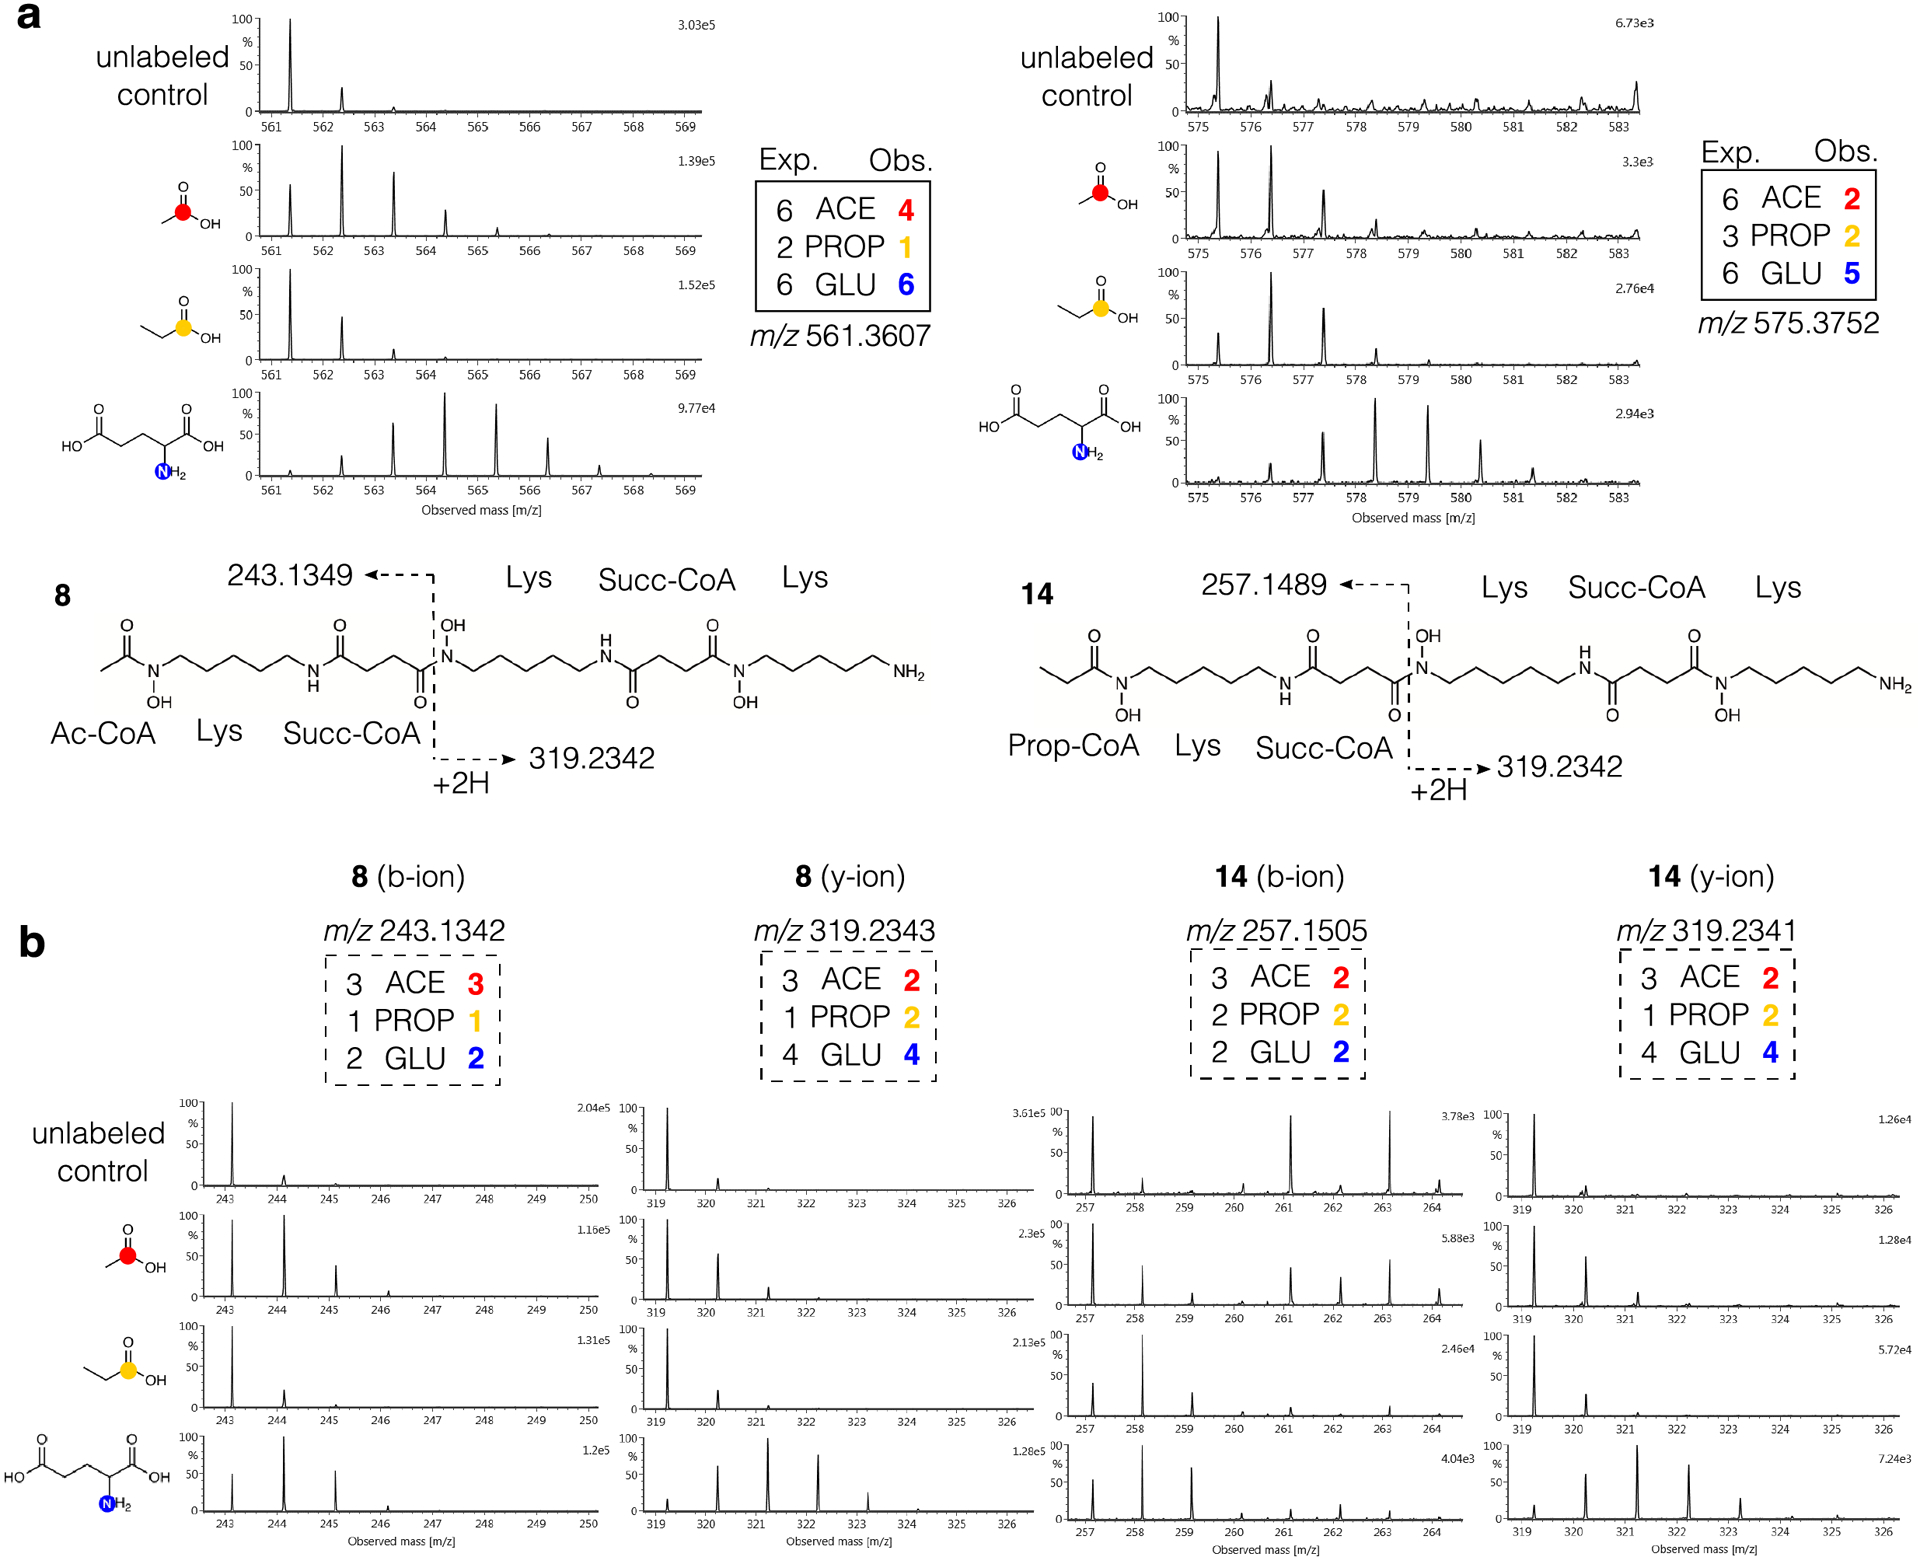
(a) Structures with observed fragmentation indicated and mass spectra for [M+H]+ ions of 8 and 14. Expected (Exp.) and observed (Obs.) labeling for 8 and 14 in each condition is indicated in boxes. (b) Mass spectra of observed b-ion and y-ion fragments for 8 and 14. Expected and observed labeling for fragments indicated in boxes.
Extended Data Fig. 9. Lobosamide MS adducts.
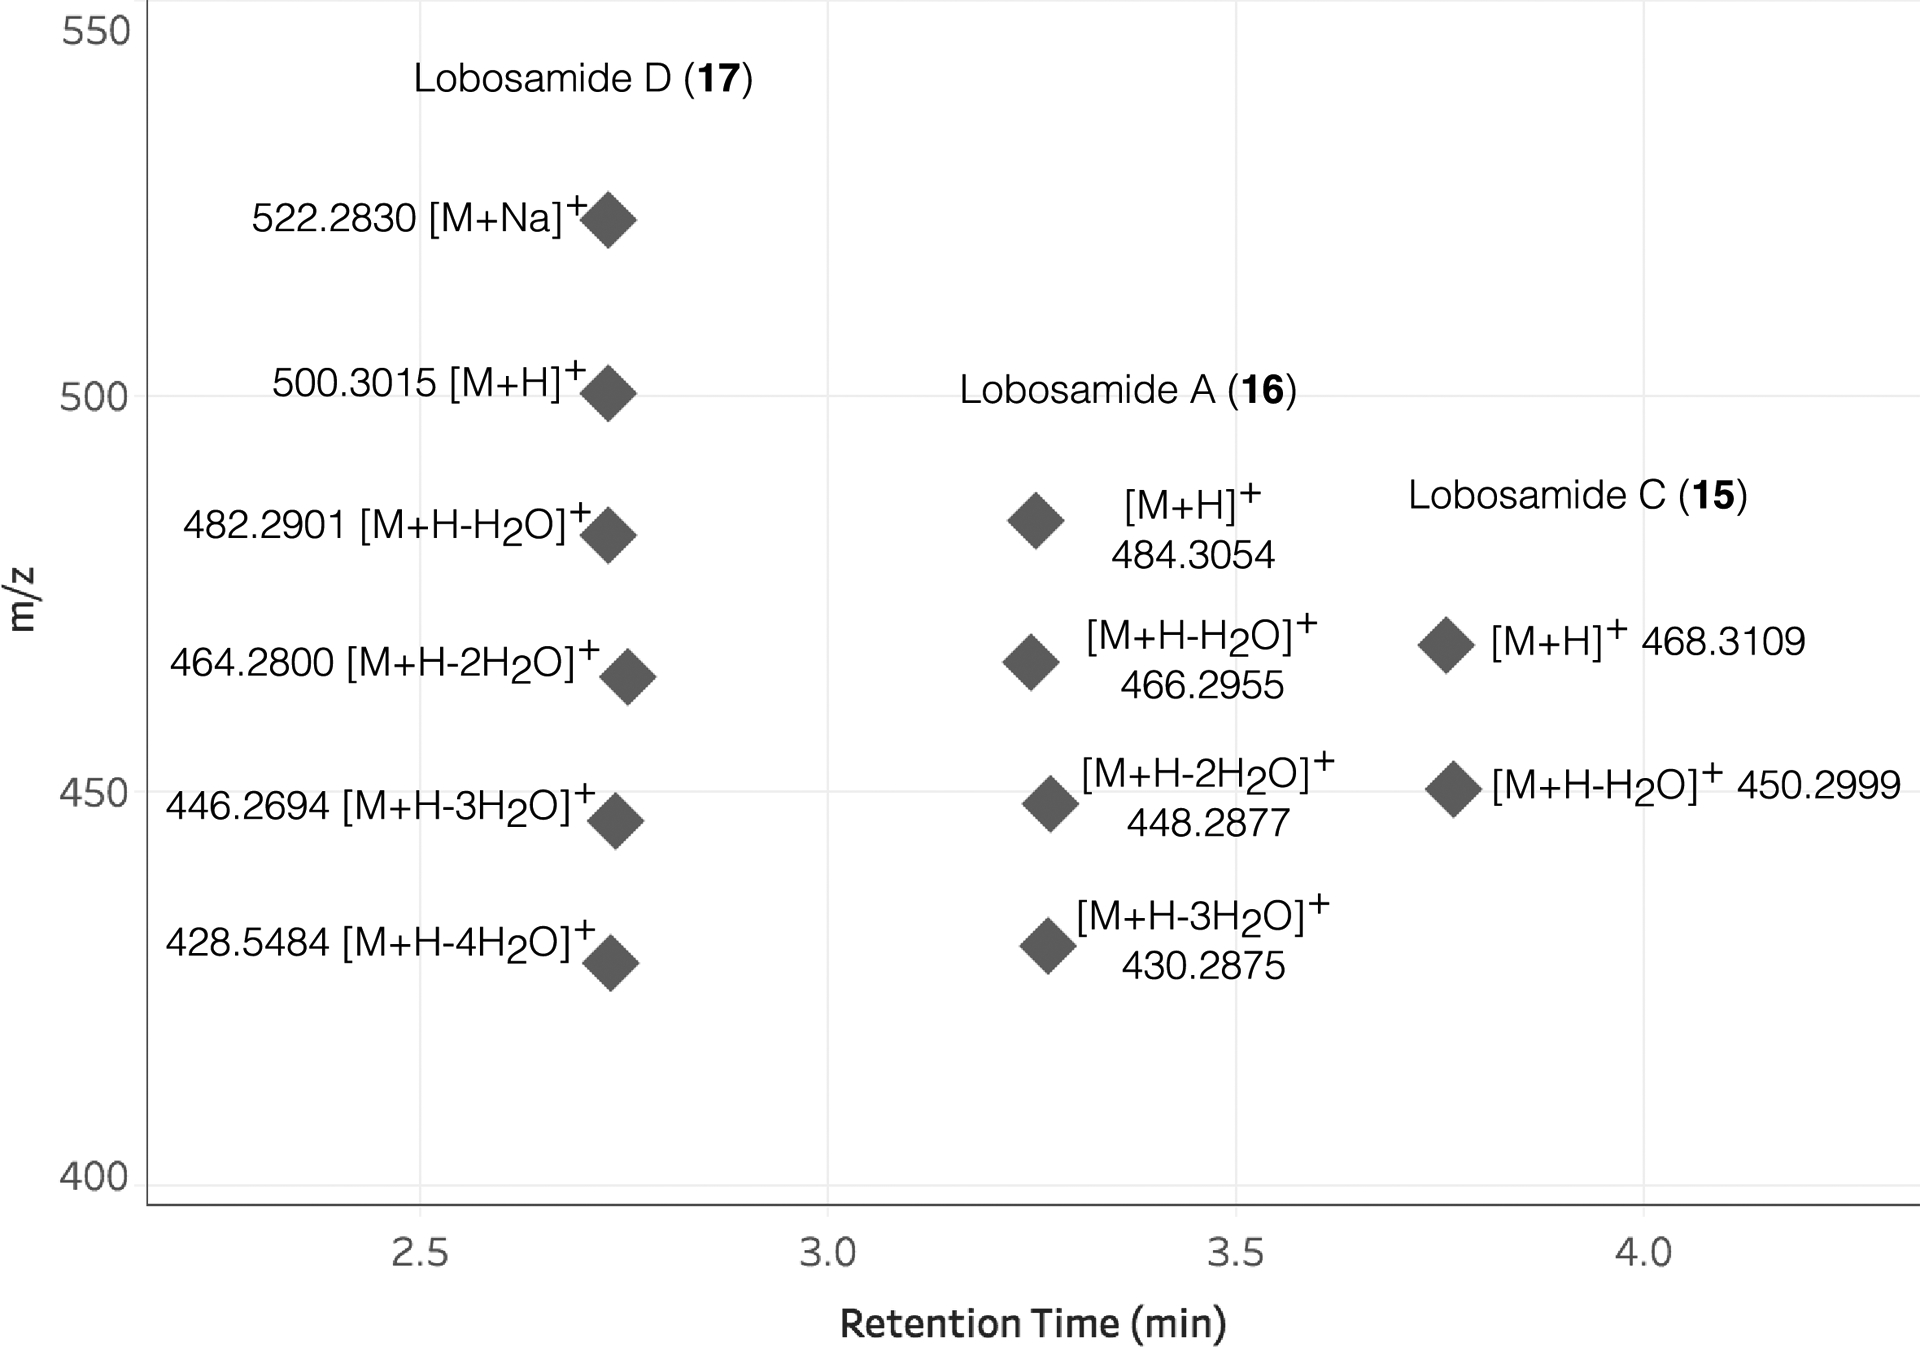
Adducts and in-source fragment ions corresponding to compounds 15, 16, and 17, which had SIL incorporation detected by IsoAnalyst.
Supplementary Material
Acknowledgements
We thank E. Ye for assistance with NMR experiments, J. Shoults for fabricating 24-well plate holders, K. Kurita for discussion about label incorporation rates, and T. Clark for providing desferrioxamine compound standards.
Funding was provided by the Natural Sciences and Engineering Research Council of Canada (NSERC) Discovery program (RGL), the National Institutes of Health (AT008718 to RGL) and the Netherlands eScience Center (NLeSC) Accelerating Scientific Discoveries Grant (ASDI.2017.030, to JJJvdH & MHM).
Footnotes
Code Availability
The IsoAnalyst package is freely available via GitHub under an open access MIT software license (https://github.com/liningtonlab/isoanalyst).
Competing Interests Statement
JAvS is a consultant for Unnatural Products Inc.. M.H.M. is a member of the Scientific Advisory Board of Hexagon Bio and co-founder of Design Pharmaceuticals.
Data Availability
Whole genome sequence (WGS) data for Micromonospora sp. RL09-050-HVF-A was uploaded to NCBI GenBank under the accession number JAGKQP000000000 and the BioProject ID PRJNA718589. The version described in this paper is version JAGKQP010000000. WGS data for Saccharopolyspora erythraea are available in NCBI with the accession code NC_009142. The processed mass spectrometry data, antiSMASH output for Micromonospora sp. RL09-050-HVF-A, and IsoAnalyst output files that support the findings of this study have been deposited in Zenodo [10.5281/zenodo.4711483]. The MIBiG database used in this study is available at https://mibig.secondarymetabolites.org/. Raw mass spectrometry data have been deposited to MassIVE under the accession numbers MSV000087824 (S. erythraea) and MSV00008723 (Micromonospora sp.). The structure of lobosamide D has been deposited to the Natural Products Atlas (www.npatlas.org). The NMR data for lobosamide D have been deposited to the Natural Products Magnetic Resonance Database (NP-MRD; www.np-mrd.org) under accession number NP0044012. MS/MS spectra for lobosamides C and D have been deposited to the Global Natural Products Social molecular networking database (GNPS; https://gnps.ucsd.edu) under accession numbers CCMSLIB00006685341 and CCMSLIB00006709936 respectively.
References
- 1.Kalkreuter E, Pan G, Cepeda AJ & Shen B Targeting bacterial genomes for natural product discovery. Trends in Pharmacological Sciences 41, 13–26 (2020). [DOI] [PMC free article] [PubMed] [Google Scholar]
- 2.Medema MH & Fischbach MA Computational approaches to natural product discovery. Nat. Chem. Biol 11, 639–648 (2015). [DOI] [PMC free article] [PubMed] [Google Scholar]
- 3.Skinnider MA et al. Comprehensive prediction of secondary metabolite structure and biological activity from microbial genome sequences. Nat. Commun 11, 6058 (2020). [DOI] [PMC free article] [PubMed] [Google Scholar]
- 4.Cimermancic P et al. Insights into secondary metabolism from a global analysis of prokaryotic biosynthetic gene clusters. Cell 158, 412–421 (2014). [DOI] [PMC free article] [PubMed] [Google Scholar]
- 5.Helfrich EJN et al. Automated structure prediction of trans-acyltransferase polyketide synthase products. Nat. Chem. Biol 15, 813–821 (2019). [DOI] [PMC free article] [PubMed] [Google Scholar]
- 6.Del Carratore F et al. Computational identification of co-evolving multi-gene modules in microbial biosynthetic gene clusters. Commun. Biol 2, 83 (2019). [DOI] [PMC free article] [PubMed] [Google Scholar]
- 7.Blin K et al. AntiSMASH 5.0: Updates to the secondary metabolite genome mining pipeline. Nucleic Acids Res. 47, W81–W87 (2019). [DOI] [PMC free article] [PubMed] [Google Scholar]
- 8.Séelem-Mojica N, Aguilar C, Gutiéerrez-García K, Martínez-Guerrero CE & Barona-Gómez F Evomining reveals the origin and fate of natural product biosynthetic enzymes. Microb. Genomics 5, (2019). [DOI] [PMC free article] [PubMed] [Google Scholar]
- 9.Kautsar SA et al. MIBiG 2.0: A repository for biosynthetic gene clusters of known function. Nucleic Acids Res. 48, D454–D458 (2020). [DOI] [PMC free article] [PubMed] [Google Scholar]
- 10.Palaniappan K et al. IMG-ABC v.5.0: An update to the IMG/Atlas of Biosynthetic Gene Clusters Knowledgebase. Nucleic Acids Res. 48, D422–D430 (2020). [DOI] [PMC free article] [PubMed] [Google Scholar]
- 11.Van Santen JA et al. The Natural Products Atlas: An open access knowledge base for microbial natural products discovery. ACS Cent. Sci 5, 1824–1833 (2019). [DOI] [PMC free article] [PubMed] [Google Scholar]
- 12.Rutz A et al. Open natural products research: curation and dissemination of biological occurrences of chemical structures through Wikidata. bioRxiv 2021.02.28.433265 (2021). doi: 10.1101/2021.02.28.433265 [DOI] [Google Scholar]
- 13.Navarro-Muñoz JC et al. A computational framework to explore large-scale biosynthetic diversity. Nat. Chem. Biol 16, 60–68 (2020). [DOI] [PMC free article] [PubMed] [Google Scholar]
- 14.Kautsar SA, Blin K, Shaw S, Weber T & Medema MH BiG-FAM: The biosynthetic gene cluster families database. Nucleic Acids Res. 49, D490–D497 (2021). [DOI] [PMC free article] [PubMed] [Google Scholar]
- 15.Van Der Hooft JJJ et al. Linking genomics and metabolomics to chart specialized metabolic diversity. Chem. Soc. Rev 49, 3297–3314 (2020). [DOI] [PubMed] [Google Scholar]
- 16.Kloosterman AM et al. Expansion of RiPP biosynthetic space through integration of pan-genomics and machine learning uncovers a novel class of lantibiotics. PLoS Biol. 18, e3001026 (2020). [DOI] [PMC free article] [PubMed] [Google Scholar]
- 17.Jensen PR Natural products and the gene cluster revolution. Trends Microbiol. 24, 968–977 (2016). [DOI] [PMC free article] [PubMed] [Google Scholar]
- 18.Ziemert N, Alanjary M & Weber T The evolution of genome mining in microbes – a review. Nat. Prod. Rep 33, 988–1005 (2016). [DOI] [PubMed] [Google Scholar]
- 19.Zhang MM, Wang Y, Ang EL & Zhao H Engineering microbial hosts for production of bacterial natural products. Nat. Prod. Rep 33, 963–987 (2016). [DOI] [PMC free article] [PubMed] [Google Scholar]
- 20.Xu F et al. A genetics-free method for high-throughput discovery of cryptic microbial metabolites. Nat. Chem. Biol 15, 161–168 (2019). [DOI] [PMC free article] [PubMed] [Google Scholar]
- 21.Zhang MM et al. CRISPR-Cas9 strategy for activation of silent Streptomyces biosynthetic gene clusters. Nat. Chem. Biol 13, 607–609 (2017). [DOI] [PMC free article] [PubMed] [Google Scholar]
- 22.Kenshole E, Herisse M, Michael M & Pidot SJ Natural product discovery through microbial genome mining. Curr. Opin. Chem. Biol 60, 47–54 (2021). [DOI] [PubMed] [Google Scholar]
- 23.Soldatou S, Eldjarn GH, Huerta-Uribe A, Rogers S & Duncan KR Linking biosynthetic and chemical space to accelerate microbial secondary metabolite discovery. FEMS Microbiology Letters 366, fnz142 (2019). [DOI] [PMC free article] [PubMed] [Google Scholar]
- 24.Ernst M et al. Molnetenhancer: Enhanced molecular networks by integrating metabolome mining and annotation tools. Metabolites 9, 144 (2019). [DOI] [PMC free article] [PubMed] [Google Scholar]
- 25.Mohimani H et al. Dereplication of peptidic natural products through database search of mass spectra. Nat. Chem. Biol 13, 30–37 (2017). [DOI] [PMC free article] [PubMed] [Google Scholar]
- 26.Duncan KR et al. Molecular networking and pattern-based genome mining improves discovery of biosynthetic gene clusters and their products from salinispora species. Chem. Biol 22, 460–471 (2015). [DOI] [PMC free article] [PubMed] [Google Scholar]
- 27.Mohimani H et al. NRPquest: Coupling mass spectrometry and genome mining for nonribosomal peptide discovery. J. Nat. Prod 77, 1902–1909 (2014). [DOI] [PMC free article] [PubMed] [Google Scholar]
- 28.Behsaz B et al. Integrating genomics and metabolomics for scalable non-ribosomal peptide discovery. Nat. Commun 12, (2021). [DOI] [PMC free article] [PubMed] [Google Scholar]
- 29.Rittenberg D & Bloch K The utilization of acetic acid for the synthesis of fatty acids. J. Biol. Chem 160, 417–424 (1945). [PubMed] [Google Scholar]
- 30.Bloch K & Rittenberg D On the utilization of acetic acid for cholesterol formation. J. Biol. Chem 145, 625–636 (1942). [Google Scholar]
- 31.Kaneda T, Butte JC, Taubman SB & Corcoran JW Actinomycete antibiotics. III. The biogenesis of erythronolide, the C-21 branched chain lactone in erythromycin. J. Biol. Chem 237, 322–328 (1962). [PubMed] [Google Scholar]
- 32.Chokkathukalam A, Kim D-H, Barrett MP, Breitling R & Creek DJ Stable isotope-labeling studies in metabolomics: new insights into structure and dynamics of metabolic networks. Bioanalysis 6, 511–524 (2014). [DOI] [PMC free article] [PubMed] [Google Scholar]
- 33.Huang X et al. X13CMS: Global tracking of isotopic labels in untargeted metabolomics. Anal. Chem 86, 1632–1639 (2014). [DOI] [PMC free article] [PubMed] [Google Scholar]
- 34.Chokkathukalam A et al. MzMatch-ISO: An R tool for the annotation and relative quantification of isotope-labelled mass spectrometry data. Bioinformatics 29, 281–283 (2013). [DOI] [PMC free article] [PubMed] [Google Scholar]
- 35.Tang JKH, You L, Blankenship RE & Tang YJ Recent advances in mapping environmental microbial metabolisms through 13C isotopic fingerprints. J. R. Soc. Interface 9, 2767–2780 (2012). [DOI] [PMC free article] [PubMed] [Google Scholar]
- 36.Khosla C, Tang Y, Chen AY, Schnarr NA & Cane DE Structure and mechanism of the 6-deoxyerythronolide B synthase. Annu. Rev. Biochem 76, 195–221 (2007). [DOI] [PubMed] [Google Scholar]
- 37.Zhang H, Wang Y, Wu J, Skalina K & Pfeifer BA Complete biosynthesis of erythromycin A and designed analogs using E. coli as a heterologous host. Chem. Biol 17, 1232–1240 (2010). [DOI] [PubMed] [Google Scholar]
- 38.Chevrette MG, Aicheler F, Kohlbacher O, Currie CR & Medema MH SANDPUMA: Ensemble predictions of nonribosomal peptide chemistry reveal biosynthetic diversity across Actinobacteria. Bioinformatics 33, 3202–3210 (2017). [DOI] [PMC free article] [PubMed] [Google Scholar]
- 39.Röttig M et al. NRPSpredictor2 - A web server for predicting NRPS adenylation domain specificity. Nucleic Acids Res. 39, W362–W367 (2011). [DOI] [PMC free article] [PubMed] [Google Scholar]
- 40.Tietz JI et al. A new genome-mining tool redefines the lasso peptide biosynthetic landscape. Nat. Chem. Biol 13, 470–478 (2017). [DOI] [PMC free article] [PubMed] [Google Scholar]
- 41.Robbel L, Knappe TA, Linne U, Xie X & Marahiel MA Erythrochelin - a hydroxamate-type siderophore predicted from the genome of Saccharopolyspora erythraea. FEBS J. 277, 663–676 (2009). [DOI] [PubMed] [Google Scholar]
- 42.Schulze CJ et al. Genome-directed lead discovery: biosynthesis, structure elucidation, and biological evaluation of two families of polyene macrolactams against Trypanosoma brucei. ACS Chem. Biol 10, 2373–2381 (2015). [DOI] [PMC free article] [PubMed] [Google Scholar]
- 43.Barona-Gómez F, Wong U, Giannakopulos AE, Derrick PJ & Challis GL Identification of a cluster of genes that directs desferrioxamine biosynthesis in Streptomyces coelicolor M145. J. Am. Chem. Soc 126, 16282–16283 (2004). [DOI] [PubMed] [Google Scholar]
- 44.Lee H-S et al. Cyclic peptides of the nocardamine class from a marine-derived bacterium of the genus Streptomyces. J. Nat. Prod 68, 623–625 (2005). [DOI] [PubMed] [Google Scholar]
- 45.Schulze CJ et al. ‘Function-first’ lead discovery: Mode of action profiling of natural product libraries using image-based screening. Chem. Biol 20, 285–295 (2013). [DOI] [PMC free article] [PubMed] [Google Scholar]
- 46.Hoshino S et al. Mycolic acid containing bacterium stimulates tandem cyclization of polyene macrolactam in a lake sediment derived rare actinomycete. Org. Lett 19, 4992–4995 (2017). [DOI] [PubMed] [Google Scholar]
- 47.Hoshino S et al. Mirilactams C–E, novel polycyclic macrolactams isolated from combined-culture of actinosynnema mirum NBRC 14064 and mycolic acid-containing bacterium. Chem. Pharm. Bull 66, 660–667 (2018). [DOI] [PubMed] [Google Scholar]
- 48.Mosey RA & Floreancig PE Isolation, biological activity, synthesis, and medicinal chemistry of the pederin/mycalamide family of natural products. Nat. Prod. Rep 29, 980–995 (2012). [DOI] [PubMed] [Google Scholar]
- 49.Karas JA et al. Structure-Activity Relationships of Daptomycin Lipopeptides. J. Med. Chem 63, 13266–13290 (2020). [DOI] [PubMed] [Google Scholar]
- 50).Duetz WA et al. Methods for intense aeration, growth, storage, and replication of bacterial strains in microtiter plates. Appl. Environ. Microbiol 66, 2641–2646 (2000). [DOI] [PMC free article] [PubMed] [Google Scholar]
Associated Data
This section collects any data citations, data availability statements, or supplementary materials included in this article.
Supplementary Materials
Data Availability Statement
Whole genome sequence (WGS) data for Micromonospora sp. RL09-050-HVF-A was uploaded to NCBI GenBank under the accession number JAGKQP000000000 and the BioProject ID PRJNA718589. The version described in this paper is version JAGKQP010000000. WGS data for Saccharopolyspora erythraea are available in NCBI with the accession code NC_009142. The processed mass spectrometry data, antiSMASH output for Micromonospora sp. RL09-050-HVF-A, and IsoAnalyst output files that support the findings of this study have been deposited in Zenodo [10.5281/zenodo.4711483]. The MIBiG database used in this study is available at https://mibig.secondarymetabolites.org/. Raw mass spectrometry data have been deposited to MassIVE under the accession numbers MSV000087824 (S. erythraea) and MSV00008723 (Micromonospora sp.). The structure of lobosamide D has been deposited to the Natural Products Atlas (www.npatlas.org). The NMR data for lobosamide D have been deposited to the Natural Products Magnetic Resonance Database (NP-MRD; www.np-mrd.org) under accession number NP0044012. MS/MS spectra for lobosamides C and D have been deposited to the Global Natural Products Social molecular networking database (GNPS; https://gnps.ucsd.edu) under accession numbers CCMSLIB00006685341 and CCMSLIB00006709936 respectively.