

Abstract
In this review, we highlight the role played by metal nanoparticles (NPs) in photocatalytic oxidation with titania as a support. This is presented in two parts, namely, partial photo-oxidation in which an organic sacrificial agent is oxidised in anaerobic conditions to produce hydrogen (photo-reforming), and photo-oxidative mineralisation of organics in aerobic conditions. We present some rules for such reactions that dictate which organic molecules can react readily, and which metals are likely to be useful for such reactions. Generally, the presence of metal NPs enhances enormously the ability of titania to yield hydrogen from photo-reforming, and a wide range of molecules can be used, including biomass. The metal NPs most used are those that are easily reduced, that is, the precious metals. The large enhancement in rate seen with metal for hydrogen production is not so extreme for the oxidation reactions, but is still significant. An important factor in all of this catalysis is the nature of the interaction between the metal NPs, which can play a multiplicity of chemical and electronic roles, and the photoactive support. A sharp dependency of rate on loading of metal is found, with maximum rates at ~0.5–2 wt% loading, depending on the metal used. The source of this dependency is the bifunctional nature of the system, in which the intimacy of both materials is crucial to performance. This rate variation is linked to the interface between the two, which is then linked to the size of the metal NPs. In fact, the rate is proportional to an area adjacent to the metal particles that we call the expanding photocatalytic area and overlap (EPAO) kinetic model. This model describes the dependence well. Rising rates with increasing coverage of particles is associated with increase in this total area but, at the maximum, these areas overlap and at higher loadings the available active area diminishes, reproducing the observed behaviour well.
Keywords: Photocatalysis, Metal nanoparticles, Solar energy, Photoreforming, Photooxidation, Hydrogen production
Introduction
The global climate is threatened by the activities of mankind. Global warming resulting from the excessive use of fossil fuels and consequent increase of CO2 in the atmosphere has now increased by about 60% compared with pre-industrial levels. Figure 1 shows the relationship between CO2 level in the atmosphere [1] and coal production at the beginning of the industrial revolution [2] and shows the close relationship between coal burning and global warming. The acceleration of CO2 levels in more recent times, from around 310 ppm in 1960 to about 420 ppm now, is still associated with industrialisation around the world, linked mainly with economic growth in the far East [3]. In Western countries, especially the European Union (EU), coal production has declined significantly in very recent times, and the United Kingdom (UK) has essentially none. And yet mankind persists in digging up dirty coal and burning it. The negative effect of this warming has been seen just recently, in the last year, with record temperatures in Canada and deadly floods in Germany and China. We can have no doubt that Nature will correct the negative impact of humans on the atmosphere in the Le Chatelier sense, that is, when a constraint is applied to a system (at equilibrium), the system will respond to re-balance it. The constraint in this case might be seen as the human race.
Fig. 1.

Showing that the rise in atmospheric CO2 levels is closely linked to the beginning of industrialisation and the use of coal-fired steam engines associated with it [1, 2]
So, new technologies are required to change the energy profile of humans. We need to develop, and have already developed, some of these—for instance solar power and wind power—and their application is expanding. However, these sources are intermittent and a variety of routes for storing their power at peak production times, for use at low production times, is being considered and developed. One of these is hydrogen production by electrolysis, with subsequent storage in a denser chemical form, such as methanol (Eq. 1) or ammonia. These may then be directly used as fuel, or the hydrogen can be re-extracted from them.
| 1 |
In this article, we consider another way to produce hydrogen, by direct photocatalysis. This can be done using water only, though much of the work in the literature makes use of sacrificial agents to give water splitting, and at least some the hydrogen can also often be produced from the sacrificial agent. For example, and as described in more detail below, methanol can be photo-reformed with water to produce hydrogen from both molecules. This then is also a route back from methanol synthesis from CO2 and H2 in which 33% of the hydrogen is lost as water, and which then regains that hydrogen back. This may be useful in relation to storage/de-storage systems. Thermally, the reaction is a little difficult since it is endergonic, but is enabled using sunlight as energy input, as can be seen below.
Besides the use of photocatalysis in the energy and chemicals scene, it can also be used to remove pollutants. Despite the well-established nature of the subject area and the development and use of a wide variety of different materials, semiconductor photocatalysis (SPC), continues to be dominated by the photocatalyst, titanium dioxide, TiO2, as it is physically, chemically and photochemically stable, photocatalytically active and inexpensive [4]. Indeed, TiO2 is the photocatalyst used in all current commercial photocatalytic products, which include self-cleaning glass [5], concrete [6], plastic tent/awning/curtain materials [7, 8], tiles [9] and paint [10–12]. Thus, this review will focus on the role of metal nanoparticles (NPs) in promoting photocatalysis by TiO2, usually P25 TiO2—which is a 80:20 mixture of anatase and rutile TiO2, with a specific surface area of ca. 50 m2 g–1 [13]—unless stated otherwise.
Hydrogen Production
Introduction
The modern era of photocatalysis for hydrogen production perhaps began with the much-cited, but extremely brief, note of Fujishima and Honda [14, 15]. This proposed oxygen evolution from a Pt and reduced TiO2 hybrid electrode system with electrolyte present, though with no data for gas evolution: this was photo-electro-catalysis. It is notable that Sato and White [16, 17] reported that hydrogen evolution could be observed when light is admitted to a reduced TiO2 sample, but this was due simply to a photo-induced re-oxidation of the titania. However, they did show evidence of water photolysis when metal, in their case Pt, was present on the TiO2 [17]. This theme then continued over the years, with metals, often Pt, used as so-called co-catalysts, and reviews of this type of work are given elsewhere [18–20].
Hence the following sections report on hydrogen production using such metal-doped catalysts.
Hydrogen Production Using Hole Scavengers and Metal/TiO2 Catalysts
Most of the work in this area uses methanol as the hole scavenger, combined with a photoactive support, such as titania, which then limits the useable wavelength of solar radiation, and a so-called co-catalyst, usually metal NPs [21–27]. An example of results from such a system is given below, in this case with Pd as the metal (Fig. 2) [28]. Here it can be seen that both hydrogen and CO2 are evolved coincidently. The catalyst is stirred in the liquid phase with water and methanol, with an inert atmosphere above. Note, though, that if the ratio of the gas phase volume above the liquid to the liquid volume is high, then most of the CO2 will dissolve and will be observed to be under-stoichiometric in the gas phase [28, 29], as can be seen in this figure. However, if the solution volume is reduced, then the reservoir for CO2 absorption is reduced and so more CO2 is seen (Fig. 3).
Fig. 2.

H2 and CO2 evolution from methanol/water reforming. Using a 0.5 wt% Pd loading catalyst in the liquid phase with 100 ml water and 1% vol methanol. Reprinted with permission from [28];
Copyright 2021 IOPscience
Fig. 3.

The ratio of H2:CO2 evolution, and H2: (CO2 + CO) after 3 h photocatalysis, using different volumes of water. As the water volume decreases, so the reservoir for CO2 absorption into the liquid phase diminishes, and so the ratio of gas evolution approaches that of stoichiometry (Eq. 2). Reprinted with permission from [28];
Copyright 2021 IOPscience
The stoichiometry of the photocatalytic reaction is as follows:
| 2 |
Here, two moles of hydrogen derive from methanol and one from, effectively, water splitting.
So—is it possible to find a sacrificial system where more of the hydrogen evolved comes from water splitting? Yes, it is; for instance, if the sacrificial is a series of polyols, then as the chain length increases (and hence the number of associated OH groups), so the rate of hydrogen evolution increases (Fig. 4) and the ratio of hydrogen derived from water itself increases (Table 1). The percentage asymptotically approaches 50% with increasing chain length [30]. The equation for this is as follows, and, effectively, when chain length n is large, then the ratio of hydrogen deriving from water to that from the alcohol approaches 1.
| 3 |
Fig. 4.
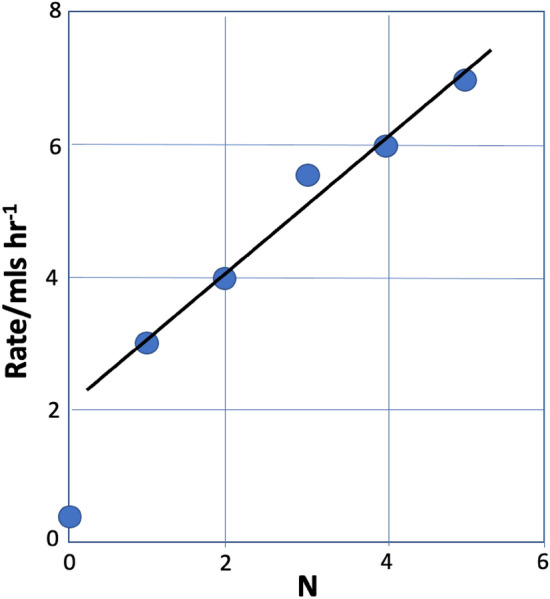
Rate of hydrogen evolution from alcohols as a function of carbon number N in the molecule [29]. N = 0 corresponds to CO, which is hydrogen produced solely from water in the photocatalytic water gas shift reaction
Table 1.
Moles of hydrogen per mole of alcohol during photo-reforming of various polyols and the percentage of total hydrogen evolved that is derived from water
| Alcohol | Molar fraction | Percentage hydrogen from water |
|---|---|---|
| Methanol | 3 | 33.3 |
| Ethanol | 5 | 40.0 |
| Glycerol | 7 | 42.8 |
| Erythritol | 9 | 44.4 |
| Xylitol | 11 | 45.5 |
A range of alcohols work for such photo-reforming, except that the stoichiometry generally changes to give 50% of the hydrogen evolved coming from water [31–33]. For instance, for n-alcohols, see Eq. 4 below—here the alkyl chain is evolved as the respective alkane.
| 4 |
Even further—is it possible to find systems where all of the hydrogen evolved derived from water? Again, the answer is yes. For instance, if acetaldehyde is used as the sacrificial agent, then the stoichiometry is as follows [31, 32], the hydrogen is evolved is solely from water and the carbon chain is evolved as the respective alkane, just like the corresponding alcohol as described above. The difference is that all the hydrogen evolves from water.
| 5 |
As can be seen from the above, a wide variety of organic molecules can be used as hole scavengers, aldehydes and alcohols of various kinds [31–33], saccharides [30] and others, such as amines [30]. This even extends to polysaccharides that occur widely in nature, and that are themselves the subject of intense scrutiny regarding re-use and recycling from waste. These include cellulose and even raw biomass. We showed in 2016 [34] that not only solid cellulosic powder can be converted, with light and a Pt/TiO2 catalyst, into hydrogen, but that even grass could work, as seen below in Fig. 5, with the result that, as can be seen in the figure, rather over-the-top headlines appeared in a wide spectrum of publications!
Fig. 5.

Hydrogen evolution from the photo-reforming of cellulose and grass using Pt/TiO2 catalysts;
Adapted from Ref. [34] with permission from the Royal Society
Although a wide variety of organics can be used, not all can, since there are some basic rules that must be followed regarding the structure of the organic, which are:
it must have an active functional group (e.g., alcohol, carbonyl);
it must have a hydrogen alpha to that active group.
Hence, organics that are ineffective are those without the alpha hydrogen, and these include ketones and carboxylic acids [29–33].
Mechanism of Reaction
So, we need to ask ourselves, exactly how does this work, what is the role of the sacrificial agent and of the co-catalyst? If we turn to the literature, we can find various approaches to this, but our view is illustrated in Fig. 6. Common to all mechanistic views is the initial photoexcitation of the semiconductor oxide, in this case TiO2, by electron–hole excitation (Fig. 6, 2). However, prior to this, and before light is admitted, we have the catalyst (Fig. 6, 1), which can be either in a reduced state as metal NPs (by pre-reduction [35], or made by sol immobilisation for instance [36]), or as oxide (after the usual calcination and cooling in air), or can be photo-deposited by having the metal precursor in the solution with the photoactive support [37]. Depending upon the environment of the photocatalysis experiment, the surface may then be covered by adsorbate. In Fig. 6, 1 we show the example where the Pd surface is covered by an adsorbate, in this case CO groups, left adsorbed by dehydrogenation of the molecule, which has been shown to occur at ambient temperature on precious metals [38–41]. As mentioned, when the light is turned on, so the photocatalysis is initiated by electron–hole excitation to promote an electron from the valence band (VB) to the conduction band (CB), creating a hole (often, and somewhat confusingly, labelled as h+, whereas it is effectively O–). We originally proposed in 1999 [42] that the main role of the photoexcitation is to provide the hole to oxidise the adsorbate on the Pd [30, 33, 42, 43], with CO2 then released from the surface, which is otherwise blocked by strongly held CO (Fig. 6, 3). This then leaves two sites on the surface of the catalyst: the vacant site on Pd left by the CO loss, and the anion vacancy on the TiO2 formed by CO2 evolution. The vacancy on the Pd is refilled by methanol in the liquid (or gas [30]) phase, while we contend that the highly reactive anion vacancy is filled by water reduction, producing hydrogen into the gas phase and completing the photocatalytic cycle (Fig. 6, 4 and 5).
Fig. 6.
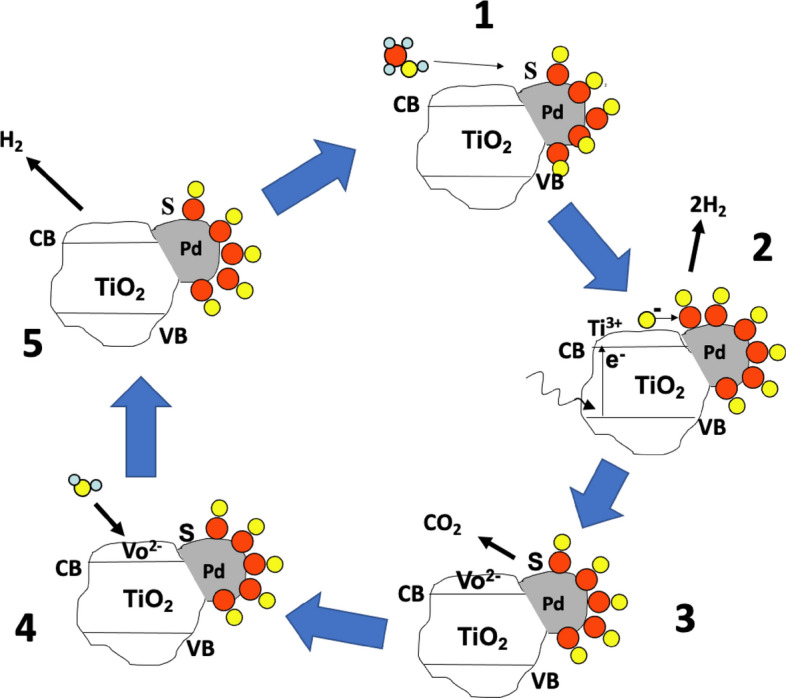
A pictorial scheme of the mechanism of photocatalytic conversion of methanol on Pd/TiO2. S Vacant site on the metal surface, VB valence band of the oxide, CB conduction band of the oxide, Vo2– anion vacancy in the titania lattice. Atoms: red circles carbon, yellow circles oxygen, small blue circles hydrogen. The steps are (1) methanol adsorption at a vacant site on the metal nanoparticle (NP), with dehydrogenation in (2) to give hydrogen into the gas phase and adsorbed CO on the metal. Also shown is electron–hole excitation by incoming light, to create the active surface species on the titania—the hole, O–. In (3), the hole has attacked the CO to give CO2 in the gas phase and leave a vacant site on the metal, and an anion vacancy on the oxide, which reacts with water in (4) and (5) to yield more hydrogen and to heal the anion vacancy at the surface. That completes the photocatalytic cycle
Photocatalytic processes need to be also chemically and electrically balanced, something that is relatively rarely reported in the literature, so the mechanism shown in Fig. 6 above can also be written as follows:
| 6 |
| 7 |
| 8 |
| 9 |
| 10 |
And similar balanced equations can be written for the other sacrificial agents described above. The 3:1 stoichiometry of the reaction was shown in the early papers [42, 44] and confirmed more recently by others [45].
Thus, in this mechanism, the metal plays a pivotal role in the whole process, by adsorbing and dehydrogenating/decarbonylating the incoming molecules, a property that Pd is known to possess [38–42, 44, 46, 47]. Others have provided different descriptions of the role of the metal. So, for instance, Joo et al. [48] propose that the role of the metal is merely to recombine hydrogen, which is produced on the titania, by reverse spillover, and which would otherwise be a slow step in the process. Others claim a kind of nano-electrical circuit in which H+ desorbs into the liquid phase and then interacts with OH– to produce H2. However, it must be noted that the reaction proceeds well in the gas phase, and often better than in the liquid phase [28, 49], and it is difficult to envisage this mechanism being involved in that case. A further role proposed is that the presence of the metal traps the light-excited electron for a time and thereby extends the lifetime of the e–h pair, giving them more chance to react [50–52]. It may well be that this role is combined with the other mechanisms described above.
One of the notable features of these reactions is a very strong dependence of reactivity upon loading of the metal. Often it is found that very low loadings of metal are quite effective at promoting the reaction, see Fig. 7. The maximum rate here is at ~ 0.5–1% weight loading of Pd on the titania, but even as low as 0.01% is still quite effective, which is a useful property if these were used commercially, since precious metals, especially Pd at present, are extremely expensive. We will return to this point later when comparing the reactivity of other metals. This maximum is also reported for studies by other workers and for different metals. The maximum is shifted for some metals, but the maximum is generally at quite low loadings. So why is there this maximum?
Fig. 7.

Dependence of hydrogen evolution rate upon weight loading. The arrangement of NPs on the surface is shown schematically. At low loading they are separate, at the maximum rate they are touching, and above that the particles begin to merge.
Adapted from reference [42]
In our original work on this subject, we proposed that the reason for this maximum was that the reaction took place at the interface between the metal and the support [44]. Geometrically, then, there is a relationship between the weight loading and the perimeter length, which has a maximum. However, this model produces a maximum at too high a loading of metal compared with experiment, assuming hemispheres, and is even still too high if we imagine that the particles are flat, circular monolayer islands. So, the model was modified to include an active perimeter that is somewhat remote from the particle edge [44], and has been refined recently to incorporate the area around the metal particles, and this is described in more detail in the section “The EPAO Kinetic Model” below.
Variation with Metal
Most of the above dealt with photocatalytic reforming of methanol on Pd/TiO2 catalysts. Although Pt and Pd appear to be the most active for this reaction, other metals also show activity. This is shown in Fig. 8. The general trend seen here is that the most easily reduced metals tend to show the highest rates (Fig. 8a), and there is thus a relationship to the enthalpy of reduction of the oxide with methanol [35]. Figure 8b shows that rates are usually lower at high loadings of metal, and Fig. 8c shows that, at least to some degree, low rates are due to difficulty of reducing the metal from its oxide in situ. It also shows us that more earth-abundant metals can be used, even if they are not as yet the most efficient. Copper in particular shows good rates if prepared in the right way.
Fig. 8.

a Hydrogen evolution from 0.5% metal/TiO2 (P25) during solar simulator irradiation: b for 5% metal/TiO2 (P25): c 0.5% Ni/TiO2(P25) after external reduction at 350 °C, followed by passivation in air at two different temperatures. Courtesy of Elsevier from Ref. [35]
Hydrogen Production—Conclusion
Here we have shown that a variety of organic molecules can be used to produce hydrogen. The types of oxygenate molecules that can be converted is wide-ranging and that range is governed by some simple rules—the molecule must have an active functional group, such as an alcohol or aldehyde function, coupled with an adjacent C–H bond. Thus, carboxylic acids and ketones are ineffective sacrificial agents for anaerobic photocatalysis. Such photocatalysis can be extended to other molecules, such as amines, and to bio-products such as cellulose and even biomass (grass) itself directly.
Here we have dealt with only TiO2 as a support, and its limitations are well known. Before we describe these, let us remind ourselves that it still the most versatile photoactive material around, due mainlyits relative cheapness, abundance, and photo-hydro stability in UV–visible light. Hence its use in many photo-related applications as outlined above in the “Introduction” to this section. The presence of certain metals as NPs on the surface generally enhances activity.
Nonetheless, this process does have a number of disadvantages. Although it is often very quantum efficient in the use of the photons it can absorb, that photon range is limited to that shorter than ~370 nm wavelength. So much work has been carried out with materials that have an absorption range extending into the visible, including doped titanias and materials such as carbon nitride. Good recent reviews of this kind of work are given elsewhere [53, 54]. The ultimate aim, of course, is to make hydrogen-producing systems that can split water directly, without the use of any sacrificial agents (thermodynamically extremely uphill), using a wide range of visible light, possibly with two photon absorption and with long-term stability and good quantum efficiency. So far this has not been achieved, though there are reports of demonstrator systems of this type in development [55].
Here, the focus has been on partial oxidation of organics for hydrogen production using anaerobic photo-reforming, but in what follows we will consider other aerobic oxidation routes including total oxidation.
Photocatalytic Oxidation of Organic Pollutants
As we have seen in the previous section, the ultimate source of electrons, if not the hydrogen itself, in the photocatalytic production of H2 is usually an easily oxidised species that is present in the photosystem; the latter species is often referred to as a sacrificial electron donor (SED). A typical, general, simplified form of the reaction equation for the photocatalysed production of H2 by platinised TiO2, Pt/TiO2, is as follows:
| 11 |
where SED+ is the oxidised form of the SED, which is usually then readily oxidised, eventually to mineral species, such as H2O, CO2 and mineral acids. Note that TiO2 is frequently ineffective in promoting this reaction in the absence of a co-catalyst, such as Pt, on its surface and, as a result, the enhancement factor, δ, for reaction (11) is at least very large, if not ∞, given:
| 12 |
The photocatalysed oxidation of organic pollutants (PCO) is very similar to the photoproduction of H2 since, once again, an organic species, the ‘pollutant’, acts as the source of electrons but, in PCO, O2 rather than H+ is the target scavenging species for the photogenerated conduction band electrons. Although many different co-catalysts, for example Pt [56], Pd [57], Au [58] and Ag [59], have been used to promote PCO, Pt is usually the most effective and, not surprisingly therefore, the most well-studied. Because of the popularity of TiO2 as a photocatalyst and Pt as a co-catalyst, this brief overview of the role of metal NPs in promoting PCO is focussed on the use of TiO2 or TiO2/Pt, as is reflected by the following general reaction equation for PCO:
| 13 |
Note that, in contrast to reaction (11), TiO2 alone is able to promote reaction (13) and, as a consequence, the values of the enhancement factor for PCO, reaction (13), are usually much more modest than they are for reaction (11) and usually fall in the range 0–8 and are most typically found to be between 2 and 4. It is a curious feature of PCO in general that the enhancement factor for PCO is found to be so similar and limited in value for many different organic test pollutants systems. This similarity suggests a common cause, namely a similar mechanism; a simple kinetic model based on such a mechanism is described in a subsequent section.
The Role of Pt and the Effect of Loading on PCO Mediated by Pt/TiO2
It is possible to deposit the Pt onto TiO2 using a number of very different methods; however, the most popular methods continue to be photo deposition (PD) or thermal reduction (TR) under a stream of H2 [60, 61]. Both methods usually generate a final product comprising a homogeneous dispersion of Pt NPs, NPs, over the surface of the TiO2 [62, 63]. Often in studies of PCO using TiO2 with a Pt co-catalyst deposited by PD or TR, reaction (3), the maximum rate is observed for a wt% Pt(max) value of 0.5–1 wt%, at which, typically, the average radius of the Pt NPs is ca. 0.5–1 nm [62, 64]. Interestingly, as noted in the previous section, this feature is also exhibited in studies of reaction (11), which suggests a similar mechanistic origin.
The kinetics of the photocatalytic oxidation of organic pollutant by TiO2 are usually assumed to be determined by the rate of reduction of O2 by the photogenerated, conduction band electrons, e–,
| 14 |
where, O2– is superoxide, which can be reduced further to hydrogen peroxide and eventually water [56, 63]. This assumption appears reasonable provided the organic pollutant is present at a high concentration and/or is very easily oxidised and is likely to be satisfied in all cases where a SED, such as methanol and ethanol, is used as the test organic ‘pollutant’. On this basis it seems reasonable to assume the biggest values of δ will be found for reaction (13) when a SED is used as the ‘pollutant’ and this is demonstrated in a later section detailing reported δ values for different organic pollutants.
When reaction (14) is the rate-determining step (RDS) in PCO, then, in order to maintain the photo-oxidation process, reaction (13), it is necessary to avoid the accumulation of the photogenerated electrons, since this would increase the rate of electron–hole recombination and lower the quantum efficiency of the photocatalytic system. Not surprisingly, therefore, regardless of the choice or concentration of the test organic pollutant, the rate of PCO is usually found to be negligible in the absence of O2 and to increase with increasing concentration of O2 [13]. It follows that, under these circumstances, anything that can improve the rate of reaction (14) will produce an increase in the value of the overall photonic efficiency of the PCO process and so render δ > 1.
Numerous lifetime studies show that Pt NPs can act as a sink for the conduction band electrons photogenerated in the TiO2 and also then mediate their transfer to O2, i.e., catalyse reaction (14) [65, 66]. It is no surprise therefore that Pt NPs on TiO2 often enhance the rate of reaction (13), although perhaps it is slightly surprising that the enhancement factor is often quite modest, ca. 2–4 times, as noted previously. In particular, it is usually found that, at low loadings (0 to ca. 1 wt% Pt), the PCO rate increases with increasing wt% Pt (henceforth referred to as kinetic feature A, kfA). However, less obviously, additional studies of reaction (3) suggest that, above a threshold wt% Pt value, wt% Pt (max), the rate then decreases with increasing Pt loading; this effect is henceforth referred to as kinetic feature B, kfB) [56, 66]. Perhaps most surprisingly, given the well-known nature of this effect, an inspection of the literature reveals no report of a rate versus wt% Pt profile for reaction (13), which clearly shows these two very different kinetic features, kfA and kfB, at low and high wt%Pt levels, respectively. Instead, as we shall see, most reports focus on using just one wt% Pt loading, usually 0.5–1 wt% to highlight the usual modest (2- to 4-fold) enhancement in rate. However, there are some clear examples of these two individual kinetic features for reaction (13) in the literature, as illustrated by the plots in Fig. 9. Thus, Fig. 9a illustrates the first of these features, kfA, in the form of an increase in enhancement factor, δ, versus wt% Pt, for the photocatalysed oxidation of dichloroacetic acid (DCA), sensitised by anatase TiO2 (Hombikat 100) in aqueous solution [63]. Further work on this system showed that, after the calculated value of δ peaks at ca. 0.5 wt% Pt, it then decreases by 17% by 1 wt% Pt, thereby starting to exhibit the second (after the threshold) kinetic feature, kfB. Figure 9b provides a much better illustration of this second kinetic feature of reaction (3), kfB, but for a different photocatalytic system, namely the photo-oxidative bleaching of rhodamine B by P25 TiO2 [56]. Note that, in the latter plot, the enhancement factor drops below that of naked TiO2, when δ = 1, and appears to tend to zero at high wt% Pt. Thus, any kinetic model developed to explain the observed kinetics for PCO must be able to embrace the usual variation of δ versus wt% Pt and its kinetic features, kfA and kfB.
Fig. 9.

a Illustration of kfA with the plot of enhancement in rate enhancement factor, δ, vs wt% Pt for Hombikat 100 (5 g/L; anatase) TiO2 in the photocatalysed oxidation of dichloroacetic acid (DCA) (1 mM), pH 3, 10 mM KNO3, O2 saturated [63]. b Illustration of kfB with the plot in δ vs wt% Pt for the photo-oxidative bleaching of rhodamine B (12 mg dm–3) by P25 TiO2 (2 mg mL–1). Solid lines EPAO (expanding photocatalytic area and overlap) kinetic model fits to the data [56]
As noted previously, the above two kinetic features of PCO and reaction (3), kfA and kfB, are also often observed in the photocatalysed production of H2, reaction (11). The similarity in the kinetic features associated with rate versus wt% Pt for reactions (11) and (13) is perhaps not too surprising giventhat both involve the oxidation of an organic species, namely, a SED/test pollutant, with only the nature of the scavenger of photogenerated electrons, H+ or O2, being different. In the previous section, a simple kinetic model, the expanding photocatalytic area and overlap (EPAO) kinetic model, was mentioned as one that provides a rationale and good fit to the kinetic features associated with the photocatalysed reduction of water by Pt/TiO2, reaction (11). In the next section, this same model is used to interpret the similar features exhibited by PCO and reaction (13), as illustrated in Fig. 9a and b.
The EPAO Kinetic Model
As noted above, and illustrated by the example data in in Fig. 9a,b, in the photocatalysed oxidation of organic pollutants by TiO2/Pt, the rate of reaction (r(PCO)),—and thus the enhancement factor, δ—is often found to increase with wt% Pt at low loading, kfA, and, after reaching a maximum value at wt% Pt(max), decrease with increasing wt% Pt, kfB [56, 66]. In the literature, the first of these kinetic features, kfA, is usually associated with an increase in the scavenging of the photogenerated electrons with wt% Pt [67–69], i.e. enhanced charge separation, due presumably to an increase in the area and/or number of the Pt NPs, N [56]; although note, however, that in practice it appears that N is approximately constant with increasing wt% Pt for TR- and PD-produced NPs. Other explanations for the enhancement in rate with increasing wt% Pt include improved light absorption by surface plasmon resonance [70] or doping [72, 74], and/or better O2 absorption [73–76]. However, few have attempted to address the often-observed variation of rate with metal (usually Pt) loading, which peaks at ca. 1 wt% and then decreases significantly.
Whilst the first of the kinetic features, in a rate versus wt% Pt plot, kfA, appears obvious, and easy to rationalise, as outlined above, the second, kfB, illustrated in Fig. 9b for the photocatalysed oxidation of rhodamine B by P25 TiO2/Pt, does not. It has been suggested recently that kfB is due to the diffusion-limiting transport of O2 to the Pt NPs when there is too much Pt on the surface, so that electron–hole combination at the Pt NPs dominates [57]. However, the sharpness of the transition from increasing (kfA) to decreasing (kfB) rate (or δ) value suggests that this is unlikely to be a primary cause. Another, commonly invoked explanation for kfB is that, at these high loadings, the Pt NPs absorb and block out the light reaching the TiO2 particles [77], but this ‘UV-screening’ hypothesis is also easily shown to be unlikely. For example, in the TiO2/Pt system used to generate the data illustrated in Fig. 9b, we know that the average particle size is ca. 1.4 nm at wt% Pt(max) = 0.34%. Assuming for the system that the Pt NPs are in the form of a uniform dispersion of hemi-spherical spheres on the P25 TiO2 particles, it can be calculated that the value of N will be 4.4 × 10¹⁵ particles m−2. If we assume this value of N does not change with increasing wt% Pt, as is often found to be the case, it can be shown that only 6% of the surface would be covered, i.e. UV-screened, when the wt% Pt reached a value of 3.1 wt% Pt; thus, UV screening at 3.1 wt% Pt would be negligible. However, from the data illustrated in Fig. 9b, for this system, the observed rate of PCO at 3.1 wt% Pt is well below even that of non-platinised P25 TiO2. Clearly, based on the above calculations, for this P25 TiO2/Pt—rhodamine B photocatalytic system, the significant loss in rate of PCO exhibited at 3.1 wt% Pt cannot be due to UV-screening by the Pt NPs [56].
Finally, strong metal substrate interaction (SMSI) effects have been invoked to provide a rationale for the observed increase [78] and decrease in rate phases [79–81]. However, such effects have been ascribed largely to photocatalysts that have been subjected to vacuum or reducing conditions, thereby allowing the surface TiO2 to be reduced and rendered sufficiently mobile that they can coat the surface of the Pt NPs, rendering them non-catalytic [81]. However, these preparation conditions do not apply to most examples of TiO2/Pt photocatalysts.
Here, we suggest there may be another, simple, explanation for the two kinetics effects often exhibited in a rate versus wt% Pt plot. Indeed, the strong similarity between the rate versus wt% Pt profiles reported for reactions (11) and (13) suggests a common cause/mechanism. As a result, the same EPAO kinetic model that has been used recently [62] to provide a rational for reaction (11) may be used as such for PCO and reaction (13). The key assumptions in an EPAO model for PCO are as follows:
Regardless of the value of the wt% metal, the metal is distributed uniformly as a fixed number, N, of hemispherical NP islands of radius, r, across the surface of the semiconductor photocatalyst particles, each spaced a distance, R, apart, where the distance depends upon their packing (hexagonal or square packed).
The rate of PCO, reaction (13) (r(PCO)), is proportional to the product of the total photocatalytically active area, AT’, per square metre of photocatalyst, and its associated enhancement factor δEPAO, plus that area that has not been activated, AF. It follows that at zero wt% metal the rate will not be zero and δ = 1.
The circular region of activation (RoA) surrounding each metal NP, has a radius rz where rz is a simple linear function of r, the radius of the metal island, the value of which depends only on the value of the wt% metal.
The value of r(PCO) inside the RoA is uniform and greater than that outside the RoA. Thus, the enhancement factor inside the RoA (δEPAO) is > 1. As a result, the overall observed value of the enhancement factor, δ, exhibited by the system increases with increasing wt% metal, up to a threshold value, wt% metal(max), at which point the RoAs touch and rz = R/2 = rtouch.
The increase in r(PCO) with wt% metal is due to the appropriate increase in rz and so AT’ and is responsible for kfA.
When r(PCO) is at a maximum (r(PCO)max) wt% metal = wt%(max) and AT’ = AT’(max). The photocatalytic area does not increase further, with any further increase in wt% metal and r, although a deactivating zone, due to overlap, does.
The sudden and striking decrease in r(PCO) above the wt% metal associated with R/2, i.e. above wt%(max), where rz > rtouch, is due the overlap of the expanding deactivation zones with the photocatalytically active area, AT’(max) and is responsible for kfB.
In areas of overlap, electron–hole recombination dominates to such an extent that no photocatalysis occurs and consequently, the overall value of r(PCO), and so δ, tends to zero with increasing wt% metal above wt%(max), as observed in kfB.
A schematic illustration of the key features associated with the EPAO model is given in Fig. 10.
Fig. 10.

Schematic illustration of the key features of the EPAO model for photocatalysed oxidation of organic pollutants (PCO), comprising a pair of metal particles (black dots) radius r, on the surface of a semiconductor photocatalyst, with zones of photocatalytic activity (blue hatched) areas of radius rz, separated by a distance, R, which is determined by the number of particles, N and the type of packing (hexagonal or cubic). With increasing wt% the regions of activation, RoAs, increase and so do the values of r(PCO) and δ, as in kfA. Eventually, the RoAs touch and r(PCO) is maximal. After this point, as the wt% is increased further the RoAs overlap to an increasing extent and the values of r(PCO) and δ decrease, tending to zero, as in kfB
Given the above assumptions, it follows that
| 15 |
where, k is a proportionality constant and AF = (1 – Nπrz2).
In the growing rate stage, kfA,
| 16 |
where the value for N is calculated from a knowledge of a paired data set of wt% of metal and metal particle radius, r, determined for the specific PCO system under study, usually using SEM. Once a value for N has been determined, it can then be used to calculate a value for R, the distance between metal sites, depending on whether the sites are hexagonal R = {2/(N.√3)}0.5, or square packed (R = (1/N)0.5. Knowledge of the value of N allows calculation of the variation of the metal particle radius, r, with wt% metal. In the initial increasing r(PCO) stage, kfA, it is assumed that the value of rz = rz(incrs), is related directly to r by the following simple expression:
| 17 |
where a and b are constants. Eventually the activation zones, which expand with increasing wt% metal, and thus with increasing value of r, touch, as illustrated in Fig. 11, at which point r(PCO) is a maximum, as is AT′, AT′ (max) and rz = R/2 = rtouch and r = r(max). It is the above part of the EPAO model that has been used to generate the solid line fit to the kfA data illustrated in Fig. 9a for the PCO of DCA by TiO2/Pt.
Fig. 11.

Photograph of an anatase, sol–gel TiO2 film, covered in Pt macro dots (r = ca. 1 mm), stained with AO7 and irradiated with UV radiation for 4 h. Reprinted with permission from [82].
Copyright 2020 ACS
In the EPAO model, the subsequent decrease in rate with increasing wt% metal above the maximum, is due to the decrease in AT′ from its peak value of AT′ (max), as the extended zones of the neighbouring metal islands overlap and become deactivation zones, as illustrated by the grey zones in Fig. 10. In this work it is assumed that rz(decrs) is described by the expression:
| 18 |
where b′ is a constant. It follows from the above, that in the decreasing r(PCO) with metal wt% stage, i.e. in the kfB zone, the value of AT′ is given by:
| 19 |
and this can be used, via Eq. (15), to model the decrease in rate as a function of wt% metal above the maximum rate. It is this part of the EPAO model that has been used to generate the solid line fit to the kfB data illustrated in Fig. 9b for the PCO of rhodamine B by TiO2/Pt.
Direct Evidence for the EPAO model: Ring Photocatalysis
In a recent study of the photocatalytic oxidation of soot and acid orange 7, AO7, adsorbed onto the surface of a TiO2 film covered with macro-sized, photodeposited islands of Pt (r ≥ 1 mm), the appearance of RoAs, as assumed in the EPAO kinetic model, were readily observed [82]. A striking illustration of this effect is given in Fig. 11, namely, a photograph of an anatase, sol–gel TiO2 film, covered in Pt macro dots (r = ca. 1 mm), stained with AO7 and subsequently irradiated with UV radiation for 4 h. In this figure, the RoAs reveal themselves as white (bleached) circular zones surrounding each Pt macro island.
Further work on the same system shows that the radius of these rings of activation, rz, is related to the radius of the Pt ‘dot’, r, via an equation that is identical to Eq. (17) of the EPAO model. A rather nice illustration of this is given in Fig. 12, which shows a photograph of the same photocatalytic film as used in Fig. 11, but with different sized Pt ‘dots’, which clearly generate different sized rings of activation, see Fig. 12a. The subsequent plot of rz vs r, generated using the images in Fig. 12a, is illustrated in Fig. 12b and is of the same form as that of Eq. (17) of the EPAO model.
Fig. 12.
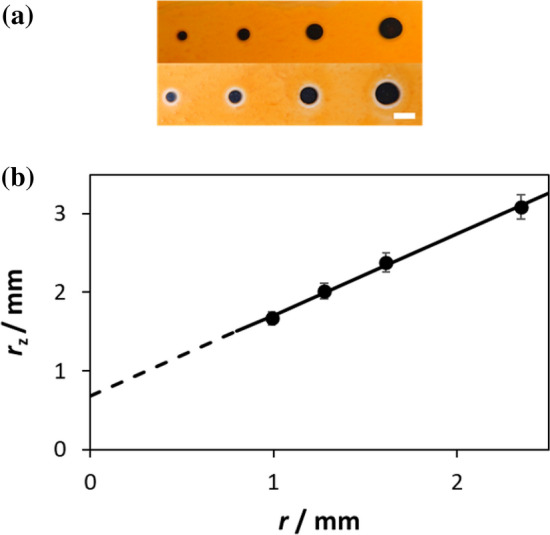
a Photograph of a sol–gel TiO2 film, with four Pt macro dots of different size, stained with AO7, before (top) and after (bottom) irradiated with UV radiation for 4 h; scale bar 5 mm. b Plot of rzvs r values derived from the photographs illustrated in a. Reprinted with permission from [82].
Copyright 2020 ACS
This study also shows that, within the RoAs, the rate of destruction of the ‘pollutant’ (in this case AO7 or soot) is uniform and enhanced, typically by a factor of 3–5, compared with that area outside the RoAs. The latter kinetic feature forms an intrinsic part of the EPAO model and, although it is not clear what exactly determines the value of the enhancement value inside a RoA, δEPAO, it appears reasonable to assume the more easily oxidised the pollutant, the greater value of δEPAO.
The collection of macro-scale kinetic features exhibited by TiO2/Pt films described above is referred to, for brevity, here and elsewhere as macro ‘ring photocatalysis’ [82]. These features include (1) RoAs with a radius related directly to the Pt particle radius and (2) unform enhanced photocatalytic activity inside the RoAs. These features are also an inherent part of the EPAO kinetic model used to fit the observed kinetics features, kfA and kfB, as illustrated in Fig. 10. Thus, the results illustrated in Figs. 11 and 12 appear to provide direct evidence for the EPAO kinetic model, on a macro scale at least. But, it has to be said that, at present, there is as yet no direct evidence that ring photocatalysis applies to the Pt NPs on TiO2/Pt films and powders, although the concept is still relatively new and these are early days. Thus, the only evidence that ring photocatalysts applies to Pt NPs on TiO2 is indirect in nature and in the form of the often-observed variation in r(PCO) as a function of wt% Pt, and the associated kinetic features, kfA and kfB, and the good fit to the data, such as illustrated in Fig. 9, provided by the EPAO kinetic model.
Theoretic Rationale for Ring Photocatalysis and the EPAO Model
The EPAO model, which is applied here to PCO, but has also been applied to water reduction and reaction (11), is based on the concept of an extended reaction area around the Pt particles (macro and NP) Pt on the surface of the TiO2 photocatalyst. This appears a reasonable assumption if, as is often reported, the Pt metal islands aid the separation of the photogenerated electron–hole pairs by acting as (1) a sink for photogenerated electrons and (2) a catalyst for their subsequent reduction reaction with O2, in PCO. The electron sink role of Pt NPs, assumed by so many [56, 63] and here in the EPAO model, has been rationalised previously by others in terms of either a metallised semiconductor model, in which the Pt forms an ohmic junction with TiO2 [83] or one in which an accumulation layer is formed at the TiO2/Pt interface [84]. Whatever the cause, the effect will be to produce an electric field around the Pt particles which draws the conductance band electrons, photogenerated in the surrounding TiO2, to the nearest Pt particle. As a consequence, the RDS for reaction (13), the reduction of O2 via reaction (14) is enhanced, with an concomitant increase in both the overall rate and enhancement factor, producing values > 1. A schematic illustration of this Pt particle enhanced rate model is illustrated in Fig. 13 and is very similar to that proposed by Gerischer et al. [84] for Pt-island coated TiO2 particles for water reduction. The loss of activity, above a threshold wt% Pt, is due to the overlap of the Pt-induced electric fields, which create the RoAs, which causes significant electron–hole recombination in the regions of overlap and the rapid total loss of photocatalytic activity at wt% Pt levels that would otherwise be considered surprisingly low.
Fig. 13.
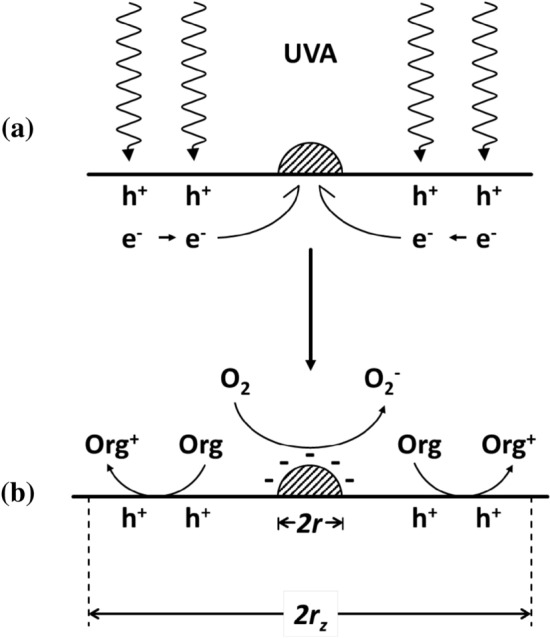
Schematic illustration of a the harvesting of conduction band electrons photogenerated on TiO2 by Pt particles and b their subsequent catalysed reaction with O2 and reaction of the photogenerated holes, h+, with the adsorbed organic pollutant. Adapted with permission from [82].
Copyright 2020 ACS
For photocatalytic systems in which the RDS for reaction (13) is not reaction (14), then the presence of Pt NPs might be expected to have little or no effect on the rate, so that r(PCO), appeared independent of wt% Pt. The latter situation might be expected to occur if the organic pollutant in reaction (13) is refractory and/or the oxidised intermediates, produced by its direct or indirect oxidation by a photogenerated hole, h+, are long-lived and readily adsorbed on the surface and so prone to reduction by the photogenerated electrons, thereby short-circuiting the overall photocatalytic process, reaction (13). Under such circumstances the actual rate would be low but δ would appear to ca. 1 at all wt% Pt values, and is referred to as an example of ‘unaffected’ kinetics.
Alternatively, as has been suggested by others [56], under these circumstances the Pt NPs might provide an additional route for photogenerated electrons and holes to recombine, via the following Pt-catalysed process:
| 20 |
In the latter case, no enhancement in δ might be seen but, rather than appearing to be independent of wt% Pt, the value of δ decreases with increasing wt% Pt [85, 86], and so, under such circumstances, the kinetics would appear ‘inhibited’ by the presence of Pt NPs.
Lying between these two extreme δ versus wt% Pt profiles, the EPAO model provides a rationale for the more usually observed variation in δ versus wt% Pt, namely, (1) initially increasing δ with wt% Pt until reaching a maximum value, kfA, followed by (2) decreasing δ with wt% Pt until reaching a zero rate, well below that required to screen out all the incident UV light falling on the surface of the TiO2, kfB. A schematic illustration of examples of the δ versus log(wt% Pt) profiles associated with these three different scenarios, where PtNPs effect either, enhanced, zero-change or inhibited PCO kinetics, is illustrated in Fig. 14.
Fig. 14.

Schematic illustration of three possible δ vs log (wt% Pt) profiles for reaction (13) in which the PtNPs effect, enhanced (EPAO model-type, solid line), zero-change (red broken line) or inhibited (black, broken line) PCO kinetics
Examples of Pt NP-Effected Enhanced, Zero-Change and Inhibited PCO Kinetics
As noted previously, given the significant interest in PCO, and the many studies of reaction (13), it is surprising that there appear to be no detailed studies of δ versus wt% Pt for such systems, unlike reaction (11). Instead, as noted earlier, most reports on PCO focus on using a fixed wt% of Pt, usually 0.5–1 wt%, to compare and contrast the usually improved efficacy of Pt NPs on PCO and reaction (13).
In a previous review on the effect of Pt on PCO [87] we showed that the rate of PCO, and so the value of δ, depends upon many parameters other than the wt% of metal and type of metal, including (1) method of metal deposition, (2) nature and physical form of pollutant, (3) nature and physical form of the semiconductor photocatalyst and (4) the experimental conditions employed. This vast array of variables makes any meaningful comparison of PCO rates and δ values difficult, if not impossible. Even when this is limited to just one semiconductor and metal, e.g., P25 TiO2 and Pt, the possible variations remain significant, and this is reflected in the large number of reports on even this ‘simple’ system. Table 2 summarises the major variables associated with PCO by TiO2 or TiO2/Pt photocatalysts.
Table 2.
Major variables in photocatalysed oxidation of organic pollutants (PCO) using a TiO2 or TiO2/Pt photocatalysts. ALD atomic layer deposition, DCA dichloroacetic acid, PD photodeposition, TR thermal reduction, UV ultraviolet
| Variables | Comments |
|---|---|
| Pt deposition method | |
| PD, TR, sputtering, ALD, chemical reduction and physical mixing, particle and/or cluster (of particles) size | PD and TR are the most popular methods of deposition. These methods have been reviewed recently [85] |
| The pollutant | |
| Organic or inorganic, ease of oxidation/redox potential, concentration, volatile (air-purification), dissolved in solution (water purification), or solid (self-cleaning films) | Most organic and inorganic pollutants undergo PCO. CO appears to be particularly difficult to oxidise using just TiO2 and much less so by TiO2/Pt, thus δ is > > 1 [88, 89] |
| The TiO2 | |
| Anatase and/or rutile, method of preparation, film or powder, specific surface area, aggregated particle size (when dispersed in solution) | Some [65] have reported a much more striking enhancement in PCO rate (for DCA) with platinisation for rutile than anatase and ascribed it to its significantly lower conduction band redox potential, i.e. − 0.11 V cf. − 0.32 V vs NHE at pH 0, respectively [62]. Others have found the PCO (of phenol) activities exhibited by rutile and anatase are enhanced to a similar extent by platinisation [91] |
| Experimental conditions | |
| [O2], pH, ionic strength, temperature, humidity, rate of stirring or flow, size, shape, and composition of photoreactor, UV irradiance value, emission spectrum of UV source | Note that pH has a striking effect on rate if the pollutant is charged and forms a strong ion-pair with the oppositely charged surface of the TiO2 [92, 93] |
In an attempt to limit the number of variables, and provide some focus on the effect on Pt on δ, Tables 3 and 4 have been constructed of reports on the use of P25 TiO2 only as the photocatalyst and Pt as a the co-catalyst, in the oxidation of organic pollutants either in solution (dispersed as a powder) (Table 3 [56, 61, 90, 94–101]), or in the gas phase, volatile organic compounds (VOCs) (Table 4 [55, 87, 91, 94–106]).
Table 3.
Reported examples PCO systems and their δ values for the purification of water by P25 TiO2
| Deposition method | wt% Pt | Pollutants (s) | δ | References |
|---|---|---|---|---|
| PD | 1 | MeOH (pH 5.1) | 7.8 | [94] |
| PD | 1 | EtOH (pH 5.1) | 4.2 | [94] |
| PD | 1 | DCA | 3 | [95] |
| ALD | 0.34–3.1 | RhB | 2.6–0.5 | [56] |
| TR | 1 | EtOH (pH 10.9) | 2.4 | [94] |
| PD | 1 | MeOH (pH 10.9) | 2.4 | [94] |
| PD | 1 | RhB | 2.3 | [96] |
| CR | 3 | MB | 2 | [97] |
| ALD | 0.34–3.1 | AB9 | 1.7–0.7 | [56] |
| PD | 0.1 | Rh6G | 1 | [98] |
| Pt colloid precipitation [54] | 1 | 2,4-DCPAA | 1 | [99] |
| PD | 0.1 | NG | 0.8 | [98] |
| TR | 0.1–1.5 | Phenol | 1–0.6 | [86] |
| PD and CR (Zn) | 1 | TCE | < 1 | [100] |
| PD | 0.15 | DCA | 0.8 | [90] |
| PD | 1 | Chloroform (pH 5.4) | 0.6 | [94] |
| TR | 1 | CBA | 0.4 | [101] |
| PD | 1 | Chloroform (pH 5.6) | 0.3 | [94] |
| PD | 1 | TCE (pH 5.2) | 0.1 | [94] |
PD photocatalytic deposition, TR thermal reduction, ALD atomic layer deposition, CR chemical reduction, MeOH methanol, TCE trichloroethylene, BTEX benzene, toluene, ethylbenzene and xylene, EtOH ethanol, DCA dichloroacetic acid, RhB Rhodamine B, MB methylene blue, AB9 Acid Blue9, Rh6G rhodamine 6G, 2,4-DCPAA dichlorophenoxy acetic acid, NG nitroglycerine, CBA chlorobenzioc acid
Table 4.
Reported examples PCO systems and their δ values for the purification of water by P25 TiO2
| Deposition method | wt% Pt | Pollutant(s) | δ | References |
|---|---|---|---|---|
| PD | 0.4 | Toluene | 3 | [102] |
| PD | 0.2 | EtOH | 2.2 | [64] |
| PD | 0.2 | Benzaldehyde | 1.5 | [103] |
| PD | 0.2 | Toluene | 1.3 | [103] |
| TR | 1 |
Propene Propane |
1.1 1.3 |
[89] |
| PD | 0.5 | Benzene | 0.9 | [104] |
| PD | 0.5 | Acetaldehyde |
0.5 (25 °C) 3.8 (90 °C) |
[105] |
| TR | 0.1–2 | TCE | 0.125–0.07 | [85] |
PD photocatalytic deposition, TR thermal reduction with H2, EtOH ethanol, TCE trichloroethylene
As noted previously, there is no comprehensive study that shows both kinetic features, i.e. kfA and kFB, for a single pollutant, as illustrated in Fig. 14 by the bold line, which has been generated for such a system using the EPAO kinetic model. In the case of P25 TiO2, only the latter feature, kfB, appears to have been reported, using acid blue 9 or rhodamine B as the test pollutant [56] (see Fig. 9b and Table 3). An example of increasingly inhibition of PCO with increasing wt% Pt, see the broken black line profile illustrated in Fig. 14, is given in Table 2, by the work of Sun et al. [86], using phenol as the test pollutant. There appear to be no reported examples for P25 TiO2 in which the rate of PCO has been found to be invariant, and so δ = 1, at all wt% Pt values (see the broken red line in Fig. 14). However, there is at least one example in Table 2 where such ‘unaffected’ kinetics are likely to be exhibited, namely the photocatalytic oxidation of 2,4 dichlorophenoxy acetic acid, DCPAA, reported by Crittenden and his group [100], since even when the Pt loading was 1 wt%, these researchers found the PCO rate unchanged, and so δ = ca. 1 (see Table 3).
When surveying the values of δ reported for reaction (3) given in Table 3, it is not surprising that well-established SEDs, like methanol and ethanol, when used as the test pollutant, exhibit some of the highest values for δ listed, i.e. 7.8 and 4.2, respectively. Although, also in Table 3, it can be seen that a more modest value of δ of 2.4 was reported by the same workers for the same SEDs, under alkaline, pH 10.9, rather than neutral conditions [94]. This striking example of the effect of pH on δ, provides an appropriate reminder that there are many variables, some of which are listed in Table 2, which can affect PCO rate and so δ. As noted before, test organic pollutants that are hard to mineralise oxidatively might well be expected to exhibit no enhancement in activity with platinisation, as the RDS will not be reaction (4), the reduction of O2. Indeed, under such circumstances, the Pt NPs would be expected to promote electron–hole recombination, thereby inhibiting the PCO reaction and producing a δ versus wt% profile similar to that illustrated by the broken black line in Fig. 14. The sub-unity values for δ reported in Table 2 for the chlorinated solvents, chloroform and trichloroethylene (TCE) [94, 100], suggest that they are examples of such refractory organic test pollutants.
In contrast to the purification of water, reported examples PCO systems for air purification are less common, as indicated by the size of Table 4, compared with that of Table 3. The most surprising entry is that for toluene with its δ value of 3 [102], although others have reported it to be 1.3 [103], which appears a more likely value given its refractory nature [106]. The photocatalytic oxidation of acetaldehyde is interesting in that at room temperature, 25 °C, the system exhibits inhibition kinetics, with δ = 0.5, and yet at 90 °C, enhanced kinetics are observed, with δ = 3.8 [103]. Most of this ‘enhancement’ appears to be due to a loss of activity for reaction (13) by the TiO2, rather than a marked improvement in the rate exhibited by the P25 TiO2/Pt [103]. The authors of this work suggest that this loss is due to a poison that is formed in the dark on the surface of TiO2 and that it may be a polymeric species derived via a dark aldol condensation reaction [103]. This example, provides, once again, a timely reminder that the rate of reaction (13) depends on many different factors, making it difficult to compare and contrast results with confidence. The entry for TCE in Table 4 indicates the value of δ decreases with increasing wt% Pt and so is consistent with what was observed for refractory chlorinated solvents in aqueous solution and inhibition type kinetics.
Conclusions
The PCO of organic pollutants in aqueous solution and in air by TiO2 is often enhanced by the deposition of 0.5–1.0 wt% of Pt NPs onto the surface of the photocatalyst; the enhancement typically lies in the range 0–8 and most often is 2–4. No comprehensive study of the rate of PCO as a function of wt% Pt showing enhancement and then subsequent fall with increasing wt% Pt has been reported in the literature to date, although the two kinetic features, namely the rise (kfA) and subsequent fall (kfB), have been captured in separate studies [56, 63] (see Fig. 9). These two kinetic features are very similar to those exhibited by the photocatalysed production of hydrogen by SEDs, like methanol, using TiO2/metal photocatalysts. The kinetic features of both systems are described very well by the EPAO kinetic model, which is based on an electric field that is set up between each Pt NP and the surrounding TiO2, which helps channel the photogenerated electrons to the Pt, which then mediates their subsequent reaction with O2. This model assumes the RDS for PCO is the reduction of O2 and so is not applicable to the PCO of refractory pollutants such as chlorinated solvents. Indeed, in the latter case, the Pt NPs appear to significantly enhance electron–hole recombination, so that in the presence of Pt, δ is always < 1 and decreases with increasing wt% Pt. This review on PCO does suggest that some noticeable enhancement (by a factor of 2–3) might be achieved using a very low (say, 0.01 wt%) loading of Pt and, therefore, this level of Pt might be worth incorporating into some commercial photocatalysts at no marked additional cost.
Acknowledgements
The authors acknowledge funding from EPSRC under grant number EP/S030468/1 and EP/N010531/1 and also US Ireland R&D Partnership; USI 132.
Declarations
Conflict of interests
The authors declare no conflicts of interest.
Data availability
Data information can be obtained at 10.17035/d.2022.0162608211.
Footnotes
This article is part of the Topical Collection “Solar-driven catalysis”; edited by Nicolas Keller, Fernando Fresno, Agnieszka Ruppert and Patricia Garcia-Munoz.
Publisher's Note
Springer Nature remains neutral with regard to jurisdictional claims in published maps and institutional affiliations.
References
- 1.McKay DJC (2008) Sustainable energy—without the hot air. UIT Cambridge. htpps://www.withouthotair.com
- 2.Richie H (2019) The death of UK coal. https://ourworldindata.org/death-uk-coal, 2019. Accessed Dec 2021
- 3.US Energy Information Administration, International Energy Statistics, https://www.eia.gov/. Accessed Dec 2021
- 4.Gopalan AI, Lee JC, Saianand G, Lee KP, Sonar P, Dharmarajan R, Hou YL, Ann KY, Kannan V, Kim WJ. Recent progress in the abatement of hazardous pollutants using photocatalytic TiO2-based building materials. Nanomaterials. 2020;10:1–50. doi: 10.3390/nano10091854. [DOI] [PMC free article] [PubMed] [Google Scholar]
- 5.Pilkington, Self-cleaning glass. https://www.pilkington.com/en-gb/uk/householders/types-of-glass/self-cleaning-glass. Accessed Dec 2021
- 6.Italcementi. https://www.italcementi.it/it. Accessed Dec 2021
- 7.Taiyo Europe. https://www.taiyo-europe.com/. Accessed Dec 2021
- 8.IKEA, Purify your air with GUNRID curtains. https://www.ikea.com/us/en/rooms/living-room/how-to/purify-your-air-with-gunrid-curtains-pubc73769b0. Accessed Dec 2021
- 9.Hydrotec. https://hytect.com/en. Accessed Dec 2021
- 10.STO. http://www.sto.co.uk/en/home/home.html. Accessed Dec 2021
- 11.Boysen. http://www.knoxoutpaints.com/about.do?id=20800. Accessed Dec 2021
- 12.Graphenstone AmbientPro+. https://graphenstone.co.uk/graphenstone-uk-ambientproplus.html. Accessed Dec 2021
- 13.Mills A, O’Rourke C, Moore K. Powder semiconductor photocatalysis in aqueous solution: an overview of kinetics-based reaction mechanisms. J Photochem Photobiol A. 2015;310:66–105. doi: 10.1016/j.jphotochem.2015.04.011. [DOI] [Google Scholar]
- 14.Fujishima A, Honda K. Electrochemical photolysis of water at a semiconductor electrode. Nature. 1972;238:37–38. doi: 10.1038/238037a0. [DOI] [PubMed] [Google Scholar]
- 15.Fujishima A, Kobayakawa K, Honda K. Hydrogen production under sunlight with an electrochemical photocell. J Electrochem Soc. 1975;122:1487–1489. doi: 10.1149/1.2134048. [DOI] [Google Scholar]
- 16.Sato S, White JM. Photoassisted hydrogen production from titania and water. J Phys Chem. 1981;85:592–594. doi: 10.1021/j150605a027. [DOI] [Google Scholar]
- 17.Sato S, White JM. Photodecomposition of water over Pt/TiO2 catalysts. Chem Phys Letts. 1980;72:83–86. doi: 10.1016/0009-2614(80)80246-6. [DOI] [Google Scholar]
- 18.Kamat PV. Photophysical, photochemical and photocatalytic aspects of metal nanoparticles. J Phys Chem B. 2002;106:7729–7744. doi: 10.1021/jp0209289. [DOI] [Google Scholar]
- 19.Ćwieka K, Czelej K, Colmenares JC, Jabłczyńska K, Werner Ł, Gradoń L. Supported plasmonic nanocatalysts for hydrogen production by wet and dry photoreforming of biomass and biogas derived compounds: recent progress and future perspectives. ChemCatChem. 2021;13:1–40. doi: 10.1002/cctc.202101006. [DOI] [Google Scholar]
- 20.Ismael M. Latest progress on the key operating parameters affecting the photocatalytic activity of TiO2-based photocatalysts for hydrogen fuel production: a comprehensive review. Fuel. 2021;303:121207. doi: 10.1016/j.fuel.2021.121207. [DOI] [Google Scholar]
- 21.AlSalka Y, Al-Madanat O, Hakki A, Bahnemann DW. Boosting the H2 production efficiency via photocatalytic organic reforming: the role of additional hole scavenging system. Catalysts. 2021;11:1423. doi: 10.3390/catal11121423. [DOI] [Google Scholar]
- 22.Davis KA, Yoo S, Shuler EW, Sherman BD, Lee S, Leem G. Photocatalytic hydrogen evolution from biomass conversion. Nano Converg. 2021;8:6. doi: 10.1186/s40580-021-00256-9. [DOI] [PMC free article] [PubMed] [Google Scholar]
- 23.Shen M, Henderson MA. Identification of the active species in photochemical hole scavenging reactions of methanol on TiO2. J Phys Chem Lett. 2011;2:2707–2710. doi: 10.1021/jz201242k. [DOI] [Google Scholar]
- 24.Montini T, Monai M, Beltram A, Romero-Ocaña I, Fornasiero P. H2 production by photocatalytic reforming of oxygenated compounds using TiO2-based materials. Mater Sci Semicond Process. 2016;42:122–130. doi: 10.1016/j.mssp.2015.06.069. [DOI] [Google Scholar]
- 25.Al-Azri ZHN, Chen WT, Chan A, Jovic V, Ina T, Idriss H, Waterhouse GIN. The roles of metal co-catalysts and reaction media in photocatalytic hydrogen production: performance evaluation of M/TiO2 photocatalysts (M = Pd, Pt, Au) in different alcohol–water mixtures. J Catal. 2015;329:355–367. doi: 10.1016/j.jcat.2015.06.005. [DOI] [Google Scholar]
- 26.Rosseler O, Shankar MV, Du MKL, Schmidlin L, Keller N, Keller V. Solar light photocatalytic hydrogen production from water over Pt and Au/TiO2(anatase/rutile) photocatalysts: influence of noble metal and porogen promotion. J Catal. 2010;269:179–190. doi: 10.1016/j.jcat.2009.11.006. [DOI] [Google Scholar]
- 27.Nomikos GN, Panagiotopoulou P, Kondarides DI, Verykios XE. Kinetic and mechanistic study of the photocatalytic reforming of methanol over Pt/TiO2 catalyst. Appl Catal B. 2014;146:249–257. doi: 10.1016/j.apcatb.2013.03.018. [DOI] [Google Scholar]
- 28.Kennedy J, Hayward J, Davies PR, Bowker M. Hydrogen production by the photoreforming of methanol and the photocatalytic water–gas shift reaction. J Phys Energy. 2021;3:024007. doi: 10.1088/2515-7655/abdd82. [DOI] [Google Scholar]
- 29.Kennedy J, Bahruji H, Bowker M, Davies PR, Bouleghlimat E, Issarapanacheewin S. Hydrogen generation by photocatalytic reforming of potential biofuels: polyols, cyclic alcohols, and saccharides. J Photochem Photobiol A. 2018;356:451–456. doi: 10.1016/j.jphotochem.2018.01.031. [DOI] [Google Scholar]
- 30.Bowker M, Bahruji H, Kennedy J, Jones W, Hartley G, Morton C. Photocatalytic Window: photo-reforming of organics and water splitting for sustainable hydrogen production. Catal Lett. 2015;145:214–219. doi: 10.1007/s10562-014-1443-x. [DOI] [Google Scholar]
- 31.Bahruji H, Bowker M, Davies PR, Pedrono F. New insights into the mechanism of photocatalytic reforming on Pd/TiO2. Appl Catal B. 2011;107:205–209. doi: 10.1016/j.apcatb.2011.07.015. [DOI] [Google Scholar]
- 32.Bowker M, Morton C, Kennedy J, Bahruji H, Greaves J, Jones W, Davies PR, Brookes C, Wells PP, Dimitratos N. Hydrogen production by photoreforming of biofuels using Au, Pd and Au–Pd/TiO2 photocatalysts. J Catal. 2014;10:10–15. doi: 10.1016/j.jcat.2013.04.005. [DOI] [Google Scholar]
- 33.Bowker M. Sustainable hydrogen production by the application of ambient temperature photocatalysis. Green Chem. 2011;13:2235–2246. doi: 10.1039/c1gc00022e. [DOI] [Google Scholar]
- 34.Caravaca A, Jones W, Hardacre C, Bowker M. H2 production by the photocatalytic reforming of cellulose and raw biomass using Ni, Pd, Pt and Au on titania. Proc R Soc A. 2016;472:20160054. doi: 10.1098/rspa.2016.0054. [DOI] [PMC free article] [PubMed] [Google Scholar]
- 35.Bahruji H, Bowker M, Davies PR, Kennedy J, Morgan DJ. The importance of metal reducibility for the photo- reforming of methanol on transition metal-TiO2 photocatalysts and the use of non-precious metals. Int J Hydrog Energy. 2015;40:1465–1471. doi: 10.1016/j.ijhydene.2014.11.097. [DOI] [Google Scholar]
- 36.Abdullah N, Bahruji H, Rogers SM, Wells PP, Catlow CRA, Bowker M. Pd local structure and size correlations to the activity of Pd/TiO2 for photocatalytic reforming of methanol. Phys Chem Chem Phys. 2019;21:16154–16160. doi: 10.1039/C9CP00826H. [DOI] [PubMed] [Google Scholar]
- 37.Haselmann GM, Baumgartner B, Wang J, Wieland K, Gupta T, Herzig C, Limbeck A, Lendl B, Eder D. In situ Pt photodeposition and methanol photooxidation on Pt/TiO2: Pt-loading-dependent photocatalytic reaction pathways studied by liquid-phase infrared spectroscopy. ACS Catal. 2020;10(5):2964–2977. doi: 10.1021/acscatal.9b05588. [DOI] [Google Scholar]
- 38.Bahruji H, Bowker M, Brookes C, Davies PR, Wawata I. The adsorption and reaction of alcohols on TiO2 and Pd/TiO2 catalysts. Appl Catal A. 2013;454:66–73. doi: 10.1016/j.apcata.2013.01.005. [DOI] [Google Scholar]
- 39.Bowker M, Holroyd R, Perkins N, Bhantoo J, Counsell J, Carley A, Morgan C. Acetaldehyde adsorption and catalytic decomposition on Pd(110) and the effect of surface carbon. Surf Sci. 2007;601:3651–3660. doi: 10.1016/j.susc.2007.07.005. [DOI] [Google Scholar]
- 40.Bowker M, Morgan C, Couves J. Acetic acid adsorption and decomposition on Pd(110) Surf Sci. 2004;555:145–156. doi: 10.1016/j.susc.2003.12.040. [DOI] [Google Scholar]
- 41.Davis JL, Barteau MA. Spectroscopic identification of alkoxide, aldehyde, and acyl intermediates in alcohol decomposition on Pd(111) Surf Sci. 1990;235:235–248. doi: 10.1016/0039-6028(90)90799-E. [DOI] [Google Scholar]
- 42.Dickinson A, James D, Perkins N, Cassidy T, Bowker M. The photocatalytic reforming of methanol. J Mol Cat A. 1999;146:211–221. doi: 10.1016/S1381-1169(99)00085-0. [DOI] [Google Scholar]
- 43.Millard L, Bowker M. Photocatalytic water–gas shift reaction at ambient temperature. J Photochem Photobiol A. 2002;148:91–95. doi: 10.1016/S1010-6030(02)00077-1. [DOI] [Google Scholar]
- 44.Bowker M, James D, Stone P, Bennett R, Perkins N, Millard L, Greaves J, Dickinson A. Catalysis at the metal-support interface: exemplified by photocatalytic reforming of methanol on Pd/TiO2. J Catal. 2003;217:427–433. doi: 10.1016/S0021-9517(03)00074-5. [DOI] [Google Scholar]
- 45.Kandiel TA, Ivanova I, Bahnemann DW. Long-term investigation of the photo-catalytic hydrogen production on platinized TiO2: an isotopic study. Energy Environ Sci. 2014;7:1420–1425. doi: 10.1039/c3ee41511b. [DOI] [Google Scholar]
- 46.Holroyd R, Bowker M. Molecular beam studies of alcohol adsorption and reaction with oxygen precovered Pd(110) Surface Sci. 1997;377–379:786–790. doi: 10.1016/S0039-6028(96)01498-7. [DOI] [Google Scholar]
- 47.Bowker M, Holroyd R, Sharpe R, Corneille J, Francis S, Goodman DW. Molecular beam studies of ethanol oxidation on Pd(110) Surface Sci. 1997;370:113–124. doi: 10.1016/S0039-6028(96)00959-4. [DOI] [Google Scholar]
- 48.Joo JB, Dillon R, Lee I, Yin Y, Bardeen CJ, Zaera F. Promotion of atomic hydrogen recombination as an alternative to electron trapping for the role of metals in the photocatalytic production of H2. Proc Natl Acad Sci USA. 2014;111:7942–7947. doi: 10.1073/pnas.1405365111. [DOI] [PMC free article] [PubMed] [Google Scholar]
- 49.Bahruji H, Bowker M, Davies PR, Morgan DJ, Morton CA, Egerton TA, Kennedy J, Jones W. Rutile TiO2-Pd photocatalysts for hydrogen gas production from methanol reforming. Topics Catal. 2015;58:70–76. doi: 10.1007/s11244-014-0346-9. [DOI] [Google Scholar]
- 50.Bashir S, Wahab AK, Idriss H. Synergism and photocatalytic water splitting to hydrogen over M/TiO2 catalysts: effect of initial particle size of TiO2. Catal Today. 2015;240:242–247. doi: 10.1016/j.cattod.2014.05.034. [DOI] [Google Scholar]
- 51.Zhang J, Xu Q, Feng Z, Li M, Li C. Importance of the relationship between surface phases and photocatalytic activity of TiO2. Angew Chem Int Ed. 2008;47:1766–1769. doi: 10.1002/anie.200704788. [DOI] [PubMed] [Google Scholar]
- 52.Ozawa T, Iwasaki M, Taka H, Akita T, Tanaka K, Ito S. Low-temperature synthesis of anatase–brookite composite nanocrystals: the junction effect on photocatalytic activity. J Colloid Interface Sci. 2005;281:510–513. doi: 10.1016/j.jcis.2004.08.137. [DOI] [PubMed] [Google Scholar]
- 53.Davis KA, Yoo S, Shuler EW, Sherman BD, Lee S, Leem G. Photocatalytic hydrogen evolution from biomass conversion. Nano Convergence. 2021;8:6. doi: 10.1186/s40580-021-00256-9. [DOI] [PMC free article] [PubMed] [Google Scholar]
- 54.Ćwieka K, Czelej K, Colmenares JC, Jabłczyńska K, Werner Ł, Gradoń L. Supported plasmonic nanocatalysts for hydrogen production by wet and dry photoreforming of biomass and biogas derived compounds: recent progress and future perspectives. ChemCatChem. 2021;13:4458–4496. doi: 10.1002/cctc.202101006. [DOI] [Google Scholar]
- 55.Wang Q, Hisatomi T, Katayama M, Takata T, Minegishi T, Kudo A, Yamadaab T, Domen K. Particulate photocatalyst sheets for Z-scheme water splitting: advantages over powder suspension and photoelectrochemical systems and future challenges. Faraday Discuss. 2017;197:491–504. doi: 10.1039/C6FD00184J. [DOI] [PubMed] [Google Scholar]
- 56.Benz D, Felter KM, Köser J, Thöming J, Mul G, Grozema FC, Hintzen HT, Kreutzer MT, Ruud van Ommen J. Assessing the role of Pt clusters on TiO2 (P25) on the photocatalytic degradation of acid blue 9 and rhodamine B. J Phys Chem C. 2020;124:8269–8278. doi: 10.1021/acs.jpcc.0c00926. [DOI] [Google Scholar]
- 57.Sescu AM, Favier L, Lutic D, Soto-Donoso N, Ciobanu G, Harja M. TiO2 doped with noble metals as an efficient solution for the photodegradation of hazardous organic water pollutants at ambient conditions. Water. 2021;13:1–19. [Google Scholar]
- 58.Iliev V, Tomova D, Bilyarska L, Tyuliev G. Influence of the size of gold nanoparticles deposited on TiO2 upon the photocatalytic destruction of oxalic acid. J Mol Catal A: Chem. 2007;263(1–2):32–38. doi: 10.1016/j.molcata.2006.08.019. [DOI] [Google Scholar]
- 59.Arabatzis IM, Stergiopoulos T, Bernard MC, Labou D, Neophytides SG, Falaras P. Silver-modified titanium dioxide thin films for efficient photodegradation of methyl orange. Appl Catal B Environ. 2003;42(2):187–201. doi: 10.1016/S0926-3373(02)00233-3. [DOI] [Google Scholar]
- 60.Wenderich K, Mul G. Methods, mechanism, and applications of photodeposition in photocatalysis: a review. Chem Rev. 2016;116:14587–14619. doi: 10.1021/acs.chemrev.6b00327. [DOI] [PubMed] [Google Scholar]
- 61.Mills A. Platinisation of semiconductor particles. J Chem Soc Chem Commun. 1982 doi: 10.1039/c39820000367. [DOI] [Google Scholar]
- 62.Mills A, Bingham M, O’Rourke C, Bowker M. Modelled kinetics of the rate of hydrogen evolution as a function of metal catalyst loading in the photocatalysed reforming of methanol by Pt (or Pd)/TiO2. J Photochem Photobiol A. 2019;373:122–130. doi: 10.1016/j.jphotochem.2018.12.039. [DOI] [Google Scholar]
- 63.Bockelmann D, Lindner M, Bahnemann DW (1996) In: Pelizzetti E (ed) Fine particles science and technology, Vol. 12. NATO ASI Series (Series 3: High Technology) Amsterdam, pp 675–689
- 64.Kennedy JC, Datye AK. Photothermal heterogeneous oxidation of ethanol over Pt/TiO2. J Catal. 1998;179:375–389. doi: 10.1006/jcat.1998.2242. [DOI] [Google Scholar]
- 65.Gerischer H, Heller A. The role of oxygen in photooxidation of organic molecules on semiconductor particles. J Phys Chem. 1991;95:5261–5267. doi: 10.1021/j100166a063. [DOI] [Google Scholar]
- 66.Wang CM, Heller A, Gerischer H. Palladium catalysis of O2 reduction by electrons accumulated on TiO2 particles during photoassisted oxidation of organic compounds. J Am Chem Soc. 1992;114:5230–5234. doi: 10.1021/ja00039a039. [DOI] [Google Scholar]
- 67.Vaiano V, Iervolino G, Sannino D, Murcia JJ, Hidalgo MC, Ciambelli P, Navío JA. Photocatalytic removal of patent blue V dye on Au-TiO2 and Pt-TiO2 catalysts. Appl Catal B. 2016;188:134–146. doi: 10.1016/j.apcatb.2016.02.001. [DOI] [Google Scholar]
- 68.Ofiarska A, Pieczyńska A, Borzyszkowska AF, Stepnowski P, Siedlecka EM. Pt−TiO2-assisted photocatalytic degradation of the cytostatic drugs ifosfamide and cyclophosphamide under artificial sunlight. Chem Eng J. 2016;285:417–427. doi: 10.1016/j.cej.2015.09.109. [DOI] [Google Scholar]
- 69.Kryukova G, Zenkovets G, Shutilov A, Wilde M, Gunther K, Fassler D, Richter K. Structural peculiarities of TiO2 and Pt/TiO2 catalysts for the photocatalytic oxidation of aqueous solution of acid orange 7 dye upon ultraviolet light. Appl Catal B. 2007;71:169–176. doi: 10.1016/j.apcatb.2006.06.025. [DOI] [Google Scholar]
- 70.Nasr O, Mohamed O, Al-Shirbini A-S, Abdel-Wahab A-M. Photocatalytic degradation of acetaminophen over Ag, Au and Pt loaded TiO2 using solar light. J Photochem Photobiol A. 2019;374:185–193. doi: 10.1016/j.jphotochem.2019.01.032. [DOI] [Google Scholar]
- 71.Dorothy AA, Subramaniam NG, Panigrahi P. Tuning electronic and optical properties of TiO2 with Pt/Ag doping to a prospective photocatalyst: a first principles DFT study. Mater Res Express. 2019;6:045913. doi: 10.1088/2053-1591/aafc56. [DOI] [Google Scholar]
- 72.Vijayan BK, Dimitrijevic NM, Wu J, Gray KA. The effects of Pt doping on the structure and visible light photoactivity of titania nanotubes. J Phys Chem C. 2010;114:21262–21269. doi: 10.1021/jp108659a. [DOI] [Google Scholar]
- 73.Muhich CL, Zhou Y, Holder AM, Weimer AW, Musgrave CB. Effect of surface deposited Pt on the photoactivity of TiO2. J Phys Chem C. 2012;116:10138–10149. doi: 10.1021/jp301862m. [DOI] [Google Scholar]
- 74.Saputera WH, Scott J, Ganda N, Low GKC, Amal R. The role of adsorbed oxygen in formic acid oxidation by Pt/TiO2 facilitated by light pre-treatment. Catal Sci Technol. 2016;6:6679–6687. doi: 10.1039/C6CY00939E. [DOI] [Google Scholar]
- 75.Pepin PA, Lee JD, Foucher AC, Murray CB, Stach EA, Vohs JM. The influence of surface platinum deposits on the photocatalytic activity of anatase TiO2 nanocrystals. J Phys Chem C. 2019;123:10477–10486. doi: 10.1021/acs.jpcc.9b01861. [DOI] [Google Scholar]
- 76.Hu X, Ji H, Wu L. Singlet oxygen photogeneration and 2,4,6-Tcp photodegradation at Pt/TiO2 under visible light illumination. RSC Adv. 2012;2:12378–12383. doi: 10.1039/c2ra21661b. [DOI] [Google Scholar]
- 77.Bamwenda R, Tsubota S, Nakamura T, Haruta M. Photoassisted hydrogen production from a water-ethanol solution: a comparison of activities of Au−TiO2 and Pt−TiO2. J Photochem Photobiol. 1995;89:177–189. doi: 10.1016/1010-6030(95)04039-I. [DOI] [Google Scholar]
- 78.Colmenares JC, Magdziarz A, Aramendia MA, Marinas A, Marinas JM, Urbano FJ, Navio JA. Influence of the strong metal support interaction effect (SMSI) of Pt/TiO2 and Pd/TiO2 systems in the photocatalytic biohydrogen production from glucose solution. Catal Commun. 2011;16:1–6. doi: 10.1016/j.catcom.2011.09.003. [DOI] [Google Scholar]
- 79.Fujiwara K, Deligiannakis Y, Skoutelis CG, Pratsinis SE. Visible-light active black TiO2-Ag/TiOx particles. Appl Catal B. 2014;154–155:9–15. doi: 10.1016/j.apcatb.2014.01.060. [DOI] [Google Scholar]
- 80.Wang J, Zhang M, Wang K, Zhang J, Wu Z, Jin Z. Reasons for the deactivation of Pt0/TiO2 photocatalyst treated by inert gas N2. Appl Surf Sci. 2008;254:5375–5379. doi: 10.1016/j.apsusc.2008.02.079. [DOI] [Google Scholar]
- 81.Haselmann GM, Eder D. Early-stage deactivation of platinum-loaded TiO2 using in situ photodeposition during photocatalytic hydrogen evolution. ACS Catal. 2017;7:4668–4675. doi: 10.1021/acscatal.7b00845. [DOI] [Google Scholar]
- 82.Mills A, Bingham M, O’Rourke C. Ring photocatalysis: bands of activation surrounding macro-sized (> 1 mm radius) Pt islands deposited on TiO2 films. J Phys Chem C. 2020;124:13550–13559. doi: 10.1021/acs.jpcc.0c02636. [DOI] [Google Scholar]
- 83.Hope GA, Bard AJ. Platinum/titanium dioxide (rutile) interface. Formation of ohmic and rectifying junctions. J Phys Chem. 1983;87:1979–1984. doi: 10.1021/j100234a029. [DOI] [Google Scholar]
- 84.Gerischer H. A mechanism of electron hole pair separation in illuminated semiconductor particles. J Phys Chem. 1984;88:6096–6097. doi: 10.1021/j150669a007. [DOI] [Google Scholar]
- 85.Driessen MD, Grassian VH. Photooxidation of trichloroethylene on Pt/TiO2. J Phys Chem B. 1998;102:1418–1423. doi: 10.1021/jp9724075. [DOI] [Google Scholar]
- 86.Sun B, Vorontsov AV, Smirniotis PG. Role of platinum deposited on TiO2 in phenol photocatalytic oxidation. Langmuir. 2003;19:3151–3156. doi: 10.1021/la0264670. [DOI] [Google Scholar]
- 87.Lee S-K, Mills A. Platinum and palladium in semiconductor photocatalytic systems. Platinum Metals Rev. 2003;47(2):61–72. [Google Scholar]
- 88.Youssef C, Puzenat E, Najm S, Bui T-H, Jaffrezic-Renault N, Guillard C. Photocatalytic oxidation of CO in presence of TiO2. Influence of humidity and oxygen on the kinetic and the mechanism. Sci J Environ Pollut Prot (Online) 2013;2(4):64–73. [Google Scholar]
- 89.Poulakis E, Philippopoulos C. Photocatalytic treatment of automotive exhaust emissions. Chem Eng J. 2017;309:178–186. doi: 10.1016/j.cej.2016.10.030. [DOI] [Google Scholar]
- 90.Egerton TA, Mattinson JA. The influence of platinum on UV and ‘visible’ photocatalysis by rutile and Degussa P25. J Photochem Photobiol A. 2008;194:283–289. doi: 10.1016/j.jphotochem.2007.08.026. [DOI] [Google Scholar]
- 91.Tanaka K, Capule V, Hisanaga T. Effect of crystallinity of TiO2 on its photocatalytic action. Chem Phys Lett. 1991;187:73–76. doi: 10.1016/0009-2614(91)90486-S. [DOI] [Google Scholar]
- 92.Mills A, O’Rourke C. Adsorption and destruction of methylene blue by semiconductor photocatalysis. Green. 2011;1:105–113. doi: 10.1515/green.2011.001. [DOI] [Google Scholar]
- 93.O’Rourke C, Mills A. Adsorption and photocatalytic bleaching of acid orange 7 on P25 titania. J Photochem Photobiol A. 2010;216:261–267. doi: 10.1016/j.jphotochem.2010.07.006. [DOI] [Google Scholar]
- 94.Chena J, Ollis DF, Rulkens WH, Bruning H. Photocatalyzed oxidation of alcohols and organochlorides in the presence of native TiO2 and metallized TiO2 suspensions. Part (I): photocatalytic activity and pH influence. Water Res. 1999;33:661–668. doi: 10.1016/S0043-1354(98)00261-9. [DOI] [Google Scholar]
- 95.Lindner M, Theurich J, Bahnemann DW. Photocatalytic degradation of organic compounds: accelerating the process efficiency. Water Sci Tech. 1997;35:79–86. doi: 10.2166/wst.1997.0091. [DOI] [Google Scholar]
- 96.Filippo E, Carlucci C, Capodilupo AL, Perulli P, Conciauro F, Correntec GA, Gigli G, Ciccarella G. Enhanced photocatalytic activity of pure anatase TiO2 and Pt-TiO2 nanoparticles synthesized by green microwave assisted route. Mater Res. 2015;18:473–481. doi: 10.1590/1516-1439.301914. [DOI] [Google Scholar]
- 97.Guan S, Yu R, Guo F, Fang Y, Ji L. Facile synthesis of ultra-fine nanoporous Pt co-catalyst decorated on P25 and its highly efficient photocatalytic activity. Ionics. 2021;27:1633–1643. doi: 10.1007/s11581-021-03958-6. [DOI] [Google Scholar]
- 98.Muradov NZ. Solar detoxification of nitroglycerine-contaminated water using immobilized titania. Sol Energy. 1994;52:283–288. doi: 10.1016/0038-092X(94)90495-2. [DOI] [Google Scholar]
- 99.Trillas M, Peral J, Domènech X. Redox photodegradation of 2,4-dichlorophenoxyacetic acid over TiO2. Appl Catal B Environ. 1995;5:377–387. doi: 10.1016/0926-3373(94)00058-1. [DOI] [Google Scholar]
- 100.Crittenden JC, Liu J, Hand DW, Perram DL. Photocatalytic oxidation of chlorinated hydrocarbons in water. Water Res. 1997;31:429–438. doi: 10.1016/S0043-1354(96)00267-9. [DOI] [Google Scholar]
- 101.Tahiri H, AitIchou Y, Herrmann J-M. Photocatalytic degradation of chlorobenzoic isomers in aqueous suspensions of neat and modified titania. J Photochem Photobiol A. 1998;114:219–226. doi: 10.1016/S1010-6030(98)00227-5. [DOI] [Google Scholar]
- 102.Vorontsov AV, Savinov EN, Barannik GB, Troitsky VN, Parmon VN. Quantitative studies on the heterogeneous gas-phase photooxidation of CO and simple VOCs by air over TiO2. Catal Today. 1997;39:207–218. doi: 10.1016/S0920-5861(97)00102-8. [DOI] [Google Scholar]
- 103.Blount MC, Falconer JL. Characterization of adsorbed species on TiO2 after photocatalytic oxidation of toluene. J Catal. 2001;200:21–33. doi: 10.1006/jcat.2001.3174. [DOI] [Google Scholar]
- 104.Zuo G-M, Cheng Z-X, Chen H, Li G-W, Miao T. Study on photocatalytic degradation of several volatile organic compounds. J Hazard Mater. 2006;B128:158–163. doi: 10.1016/j.jhazmat.2005.07.056. [DOI] [PubMed] [Google Scholar]
- 105.Falconer JL, Magrini-Bair KA. Photocatalytic and thermal catalytic oxidation of acetaldehyde on Pt/TiO2. J Catal. 1998;179:171–178. doi: 10.1006/jcat.1998.2215. [DOI] [Google Scholar]
- 106.Mills A, Worsley D, Smith K, Hutchings MG (1995) Acid enhancement effects in the clean oxidation of toluenes photocatalysed by TiO2. J Chem Soc Chem Commun 1119–1120
Associated Data
This section collects any data citations, data availability statements, or supplementary materials included in this article.
Data Availability Statement
Data information can be obtained at 10.17035/d.2022.0162608211.