

Graphical abstract

Keywords: Thymus comosus Heuff. ex Griseb. et Schenk, Ultrasound-assisted extraction, Optimisation, Design of Experiments, Phenolic compounds
Highlights
-
•
T. comosus is an endemic, less-studied thyme species used in Romanian folk medicine.
-
•
Optimized ultrasound-assisted extraction was applied for the recovery of its bioactive compounds.
-
•
The influence of extraction parameters on the quality of the extract was studied.
-
•
The presence of polyphenols was correlated with bioactive potential of the extract.
Abstract
An optimized ultrasound-assisted extractive method was developed to obtain a polyphenol-enriched extract from the aerial parts of Thymus comosus Heuff. ex Griseb. et Schenk. Optimization process was conducted based on Design of Experiment (DoE) principles, determining the influence of three independent variables (time, ultrasound amplitude, ethanol concentration) on the total phenolic content of the extract (dependent variable). Additionally, the phenolic composition of the extract was characterized through UHPLC-HRMS, revealing beside the most abundant flavonoid-type compounds the presence of salvianolic acids C, D and L in high amounts. Phytochemical profile of the extract was correlated with its antioxidant activity (tested through five complementary assays) and enzyme-inhibitory potential, showing important antiglucosidase and anticholinesterase effects. Overall, it was concluded that the developed method is suitable for obtaining a good recovery of both phenolic and non-phenolic compounds from Thymus comosus aerial parts, and their presence in the optimized extract is responsible for its pharmacological potential.
1. Introduction
Thymus genus is one of the most representative taxonomic subunity of the Lamiaceae family, comprising more than 215 species distributed worldwide [1], [2]. Different thyme species (i.e. Thymus vulgaris, T. zygis, T. serpyllum) are well-established herbal medicines (having monographs in official pharmacopoeias like European Pharmacopoeia), whose therapeutic potential correlates well with both the high content of volatile oils and the complexity of non-volatile fractions, rich in phenolic acids, flavonoids and iridoids [3], [4]. Moreover, T. vulgaris aerial parts (known as Thymi herba) are considered one of the most popular plant products used as a spice in household and industrial food applications [2]. Beside the common-used thyme species, there are also reported data about the health-related benefits of other Thymus representants.However, their potential applications are underevaluated because their specific distribution (most of them are endemic species) and the small amount of data previously published on their chemical or bioactive features are poorly documented. One of these species is T. comosus Heuff. ex Griseb. et Schenk (TC) (Fig. 1) an endemic member of the thyme family that grows exclusively in the Intra-Carpathic regions of Romania. The state-of-the-art regarding its chemical profile and bioactive potential is weakly documented; Boz et al. and Pavel et al. focused their studies on the characterization of essential oils obtained from its aerial parts, while the phenolic profile of the methanolic extract was studied by Mărculescu et al., revealing the presence of phenolic acids and hydroxycinnamic derivatives in higher amounts than in T. vulgaris [5], [6], [7].
Fig. 1.

Thymus comosus Heuff. ex Griseb. et Schenk.
In the last decades, a high number of studies were focused on reconsideration of thyme (including some less-studied species belonging to this genus) and their potential use as a source of bioactive compounds with wide applications as medicines and food additives [8], [9], [10], highlighting the importance of enhancing the recovery of bioactive compounds from these species. This goal was mainly achieved using advanced extractive technologies, applied both to improve extraction yields of classical methods or, sometimes, to completely replace them (bringing into account their weak points as long extraction times, big solvents volumes and their toxicity, degradation, and loss of physicochemical/biochemical properties of extracted compounds) [11], [12]. One of the most exploited modern extraction techniques is ultrasound-assisted extraction (UAE), intensively used and studied in last years for its many advantages; it allows to obtain high extraction yields with minimum damage of structural and molecular properties of interest compounds, reduces solvents use, and assures a better penetration of the extracted matrices through specific processes [12], [13], [14]. Acoustic cavitation is the main process involved in ultrasound-assisted extraction, inducing secondary modifications in plant material through fragmentation, localised erosion, pore formation or shear forces. All of these factors enhance the disruption of cell walls, enhancing the contact of extractible compounds with the solvent and their partition in the extraction environment [14]. It was also shown that the UAE could be more effective when the influence of each extraction parameter is well defined and correlated with the properties of the extracted matrix, these features being overall reflected by the final quality of the obtained extracts in terms of their bioactive potential [12], [15], [16].
Several statistic and computational methods were applied to optimize different UAE methods, including Design of Experiments (DoE) [17], [18], [19], [20]. Methods that are conventionally used for optimisation purposes, where the influence of one factor is studied at a time, present a major shortcoming. They do not consider potential interactions between factors, which can mislead in identifying the optimal combination of critical process parameters [21], [22], [23]. The recently alternative of using the Design of Experiments (DoE) to find optimal product and process characteristics provides the highest amount of information from the least number of experimental runs by systematic variation of the factors and simultaneously evaluation of the effects of multiple variables. The design space is a well-defined multidimensional range of input variables and/or process parameters demonstrated to ensure that the obtained product would meet predefined specifications [24], [25].
Considering the above, the present study aimed to develop an optimized ultrasound-assisted extraction method to obtain a polyphenol-enriched extract from aerial parts of TC based on DoE principles. Additionally, the phenolic profile of the optimized extract was analyzed through a chromatographic method, while antioxidant and enzyme-inhibitory properties were tested using in vitro assays. The primary outcome of our work was to emphasize the positive impact of the optimized UAE method on the final quality of the extract and also to bring a new perspective regarding the potential use of this less-studied Thymus species as a valuable source of bioactive compounds.
2. Experimental setup
2.1. Plant material
In this work, T. comosus Heuff. ex Griseb. et Schenk aerial parts were collected in august 2019 from Rimetea (Alba county, Romania) during their maximum flowering period. Plant material was sorted, supposed to authentication procedure based on its botanical features, and dried at room temperature in a shady place until a constant mass; dried material was kept in paper bags in the herbarium of Pharmaceutical Botany Department of Iuliu Hațieganu University of Medicine and Pharmacy Cluj-Napoca until extraction.
2.2. Extraction procedure
Dried plant material was previously powdered using a laboratory mill (Grindomix® GM 200, Retsch Gmbh., Germany) and manually sieved (1 mm standard sieve according to PhEur 10.6) to ensure particles' uniformity. UAE was carried out using a Vibra-Cell™ Ultrasonic Processor, model VCX 500 equipped with a tapered microtip (ø 6 mm) and integrated temperature controller. In order to generate a D-optimal experimental design for the optimization of the extraction process, three parameters were taken into account as independent process variables: exposure time (1, 3, 5, 7, and 10 min), ultrasounds amplitude (20, 30, and 40%) and ethanolic concentration of the solvent (30, 50, and 70%). Practically, for each experimental run, 2 g of TC powder were mixed with 20 mL of solvent and supposed to be extracted under an ice bath to avoid heating. The mixture was further vacuum filtered for the separation of supernatant. After establishing optimal extraction parameters, the optimized T. comosus extract (OpTC) was freeze-dried and kept in a desiccator at room temperature until phytochemical and bioactivity assays.
2.3. Design of experiments
The MODDE 12.1 software (Sartorius Stedim, Sweden) was used to develop the design of experiments (DoE), which allowed the introduction of the experimental variability to study its effects and establish the optimal experimental values for the extraction purpose.
The DoE type was D-optimal, which is based on the selection of experimental runs to span the largest possible volume of the variability matrix. This kind of model was specially created to allow the study of multiple combinations of qualitative and quantitative multilevel factors in the same experimental design [26]. The analysis of coefficients evaluated the effects of the process variables over the measured extraction performances. Based on the obtained results, the optimal formulation and design space were further defined.
Moreover, a Proven Acceptable Range (PAR) was established within the design space, which is graphically represented by a design space hypercube, marking the largest possible regular surface that can be inserted into the irregular design space and showing the volume in which all factor combinations can be used without compromising the critical quality attributes of the end product [27]. After determining the design space and PAR, the optimal formulation was established by defining combinations of factor values that predict a result as close as possible to the target values of the response [28], [29].
2.4. Total phenolic content (TPC) and total flavonoidic content (TFC)
The protocol used for TPC determination was based on the Folin-Ciocalteu method adapted to the microplate reader, previously reported by Babotă et al. [30]. The absorbance of samples was read at 760 nm after 30 min incubation at room temperature, results being expressed as milligrams of gallic acid equivalents per milliliter of raw extract (for the samples resulting from experimental runs of optimization process (mg GAE/mL); for the optimized extract, results were expressed per g of dried extract (mg GAE/g). TFC was determined using the aluminium chloride method based on the protocol described by the same authors [30], results being expressed as milligrams of rutin equivalents (mg RE/g extract).
2.5. UHPLC-HRMS analysis of phenolic profile
The optimized T. comosus dried extract (100 mg) was dissolved in 2 mL of ethanol 50% and centrifuged at 6000×g for 10 min at 4 °C. After that, the supernatant was transferred to HPLC vials for instrumental analysis. The untargeted phenolic profiling was carried out by high-resolution mass spectrometry (HRMS) on a Q-Exactive™ Focus Hybrid Quadrupole-Orbitrap Mass Spectrometer (Thermo Scientific, Waltham, MA, USA) coupled to a Vanquish ultra-high-pressure liquid chromatography (UHPLC) pump and equipped with heated electrospray ionization (HESI)-II probe (Thermo Scientific, USA). The chromatographic separation was achieved under a water-acetonitrile (both LC-MS grade, from Sigma-Aldrich, Milan, Italy) gradient elution (6–94% acetonitrile in 35 min, adding 0.1% formic acid to both phases) on an Agilent Zorbax Eclipse Plus C18 column (50 × 2.1 mm, 1.8 μm). The HRMS conditions were adapted from a previously published work [31]. The flow rate was 200 μL/min, the injection volume was 6 μL, using a full scan MS-data-dependent (Top N = 3) MS/MS mode. In the full scan mode, the acquisition was achieved in the range 100–1200 m/z, with a positive ionization mode and a mass resolution of 70,000 FWHM. The automatic gain control target (AGC target) and the maximum injection time (IT) of the Orbitrap were 1e6 and 200 ms, respectively. In the data-dependent MS/MS mode, the full scan mass resolution was reduced to 17,500 at m/z 200, with an AGC target value of 1e5, maximum IT of 100 ms, and isolation window of 1.0 m/z, respectively. The Top N ions were selected for fragmentation using 10, 20, 40 eV normalized collisional energies. The HESI parameters are reported in previous work [32]. The raw data (.RAW files) were further processed using the software MS-DIAL (version 4.70) for post-acquisition data filtering [33], and the annotation was done via spectral matching against the databases FoodDB and Phenol-Explorer. The identification step was based on mass accuracy (setting a 5-ppm tolerance for m/z values), isotopic pattern, and spectral matching. These criteria were used to calculate a total identification score, considering the most common HESI+ adducts for the chromatographic conditions adopted, thus reaching a level 2 of confidence in annotation [34]. Finally, the cumulative intensity values of the different phenolic classes annotated were converted into semi-quantitative data, exploiting hydroalcholic standard solutions of pure compounds (Extrasynthese, Lyon, France) analyzed under the same conditions. In this regard, ferulic acid (phenolic acids), quercetin (flavonols), catechin (flavanols), cyanidin (anthocyanins), luteolin (flavones and other flavonoids), resveratrol (stilbenes), and oleuropein (other remaining phenolics) were used as representatives of their respective classes. In this regard, a linear fitting (R2 greater than 0.99) was built and used for quantification, and results were expressed as mg equivalents (Eq.)/g lyophilized extract (n = 3).
2.6. In vitro biochemical assay of antioxidant potential
Five complementary assays were used to evaluate the antioxidant potential of OpTC through different pathways: DPPH, TEAC (indicating radical scavenger activity), FRAP (ferric reducing antioxidant power), TBARS (evaluating lipid peroxidation through thiobarbituric acid reactive substances formation inhibition), and OxHLIA (oxidative haemolysis inhibition assay). For all assays, the detailed protocols are extensively described in our previous works [30], [35], [36], [37], [38].
In DPPH assay, 30 μL of sample (1 mg/mL) were mixed with 270 μL of 0.004% methanol solution of DPPH. The absorbance was read at 517 nm after a 30 min incubation at room temperature in the dark. DPPH radical scavenging activity was expressed as milligrams of Trolox equivalents (mg TE/g extract) [30], [36].
For TEAC assay, ABTS+ radical solution was previously prepared by reacting 7 mM ABTS solution with 2.45 mM potassium persulfate and allowing the mixture to stand for 12–16 in the dark at room temperature. Prior to beginning the assay, ABTS+ solution was diluted with distilled water to an absorbance of 0.70 ± 0.02 at 734 nm; 200 μL of radical solution were added to 20 μL of the sample (1 mg/mL) and incubated for 30 min at room temperature. The absorbance was read after incubation at 734 nm, radical scavenging activity being expressed as milligrams of Trolox equivalents (mg TE/g extract) [30], [36].
Ferric reducing antioxidant power (FRAP) was tested using the premixed FRAP reagent: acetate buffer (0.3 M, pH 3.6), 2,4,6-tris(2-pyridyl)-S-triazine (TPTZ) (10 mM) in 40 mM HCl and ferric chloride (20 mM) in a ratio of 10:1:1 (v/v/v). Samples were reconstituted at 1 mg/mL; the absorbance was read at 593 nm after a 30 min incubation at room temperature, FRAP activity being expressed as milligrams of Trolox equivalents (mg TE/g extract) [30], [36].
For the evaluation of lipid peroxidation inhibitory activity through TBARS assay, the extract was submitted to serial dilutions; 200 μL from each dilution were mixed in an Eppendorff reaction tube (2 mL) with 100 μL of FeSO4 (10 μM) and 100 μL of ascorbic acid (0.1 mM), reaction mix being incubated for 1 h 37 °C. Incubation was followed by adding 500 μL of trichloroacetic acid (28% w/v) and 380 μL of thiobarbituric acid (TBA, 2% w/v) then heating at 80 °C for 20 min. To quantify malondialdehyde (MDA)-TBA complexes, reaction tubes were centrifuged at 3000×g for 10 min, and the absorbance of the supernatant was read at 532 nm. Results were expressed as EC50 values (μg/mL) [38].
For OxHLIA assay, an erythrocyte solution (2.8%, v/v; 200 µL) prepared in phosphate-buffered saline (PBS, pH 7.4) was mixed with 400 µL of either: extract solution (1.8–60 µg/mL in PBS), PBS (negative control), distilled water (baseline) or trolox (positive control; 7.81–250 µg/mL in PBS). After pre-incubation at 37 °C for 10 min with shaking, 200 μL of 2,2′-azobis(2-methylpropionamidine) dihydrochloride (AAPH; 160 mM in PBS; from Sigma-Aldrich, St. Louis, MO, USA) were added, and the optical density was measured kinetically at 690 nm in an ELx800 microplate reader (Bio-Tek Instruments, Winooski, VT, USA) until complete haemolysis. IC50 values (µg/mL) for Δt of 60 and 120 min were obtained by correlating the extract concentration to the Δt values (min), which resulted from the half haemolysis time (Ht50 values) obtained from the haemolytic curves of each extract concentration minus the Ht50 value of the PBS control [37].
2.7. Enzyme inhibitory activity
The enzyme-inhibitory ability of OpTC was evaluated against α-glucosidase (α-Glu), tyrosinase acetylcholinesterase using in vitro methods. α-Glucosidase inhibition was tested based on a protocol previously described slightly modified [39], 50 μL of extract (1 mg/mL) were mixed with 50 μL of the enzyme (in phosphate buffer, pH 6.8) and 50 μL of the substrate (PNPG, 10 mM in phosphate buffer). The reaction mix was incubated at 37 °C for 15 min, and the absorbance was read at 400 nm using acarbose as a positive control. Results were expressed in terms of IC50 (μg/mL).
For tyrosinase (Tyr) inhibition assay, the sample (25 μL, 1 mg/mL) was mixed with tyrosinase solution (40 μL, 10 U/mL) and phosphate buffer (100 μL, pH 6.8), followed by a 15 min incubation at room temperature. After incubation, 40 μL of L-DOPA (2.5 mM in phosphate buffer) were added and the reaction mixture was re-incubated for 10 min in the same conditions. The absorbance was measured at 492 nm and results were expressed as IC50 (μg/mL) using as positive control kojic acid [30].
Acetylcholinesterase (AChE) inhibitory activity was tested using an Ellman’s method based protocol. 25 μL of the sample, 50 μL of Tris-HCL buffer (pH 8,50 mM), 125 μL of DTNB (0.9 mM in the same buffer) and 25 μL of AchE (0.078 U/mL in the same buffer) were mixed and incubated for 15 min at room temperature in a dark place. After incubation, 25 μL of ATCI (4.5 mM in Tris-HCl buffer) were added, and the sample was incubated again for 10 min. The absorbance was read at 405 nm, and IC50 values (μg/mL) were expressed using galantamine as a positive control [39], [40].
2.8. Statistic and correlation analysis
All assays were made in triplicate and the results were expressed as mean ± SD (standard deviation). Finally, correlogram, Pearson's correlation coefficients, and p-value matrix (p < 0.05), evaluated among different phenolic classes and biological activities, were performed using R-studio software.
3. Results and discussion
3.1. Design of experiments and experimental model fitting
When both quantitative and qualitative factors are studied in a D-optimal DoE, the selection of experimental runs included in the design matrix is critical and should be performed based on scientific means. In the present case, two statistical parameters were considered: condition number and G-efficiency. The condition number measures the sphericity of a design, and it is computed for an extended design matrix and represents the ratio of the largest and smallest values of the variability matrix. The ideal condition number value is 1, representing an orthogonal design, the orthogonality of a design evolving inversely proportional with this parameter. For optimization designs with quantitative multilevel factors, as in the present case, the condition number value could increase considerably, and therefore a DoE with a condition number <8 is considered statistically efficient. The G-efficiency is a criterion that expresses the design performance by comparing it to the capacities of a fractional factorial design, expressed as a percentage. For high-quality, reliable D-optimal DoE, a G-efficiency above 60–70% is recommended [26].
The developed optimization DoE took into account three quantitative factors – exposure time (1, 3, 5, 7, and 10 min), ultrasounds amplitude (20, 30, and 40%), and ethanolic concentration of the solvent (30, 50, and 70%) – and consisted in 19 experimental runs, including 3 replicates performed in order to assess the reproducibility of the extractions. To reduce the risk of systematic errors, the 19 runs were performed in a randomized order (Table 1). The DoE registered a condition number of 5.84 and a G-efficiency of 78.26%, which describe a highly reliable statistical model. The studied response was the TPC, extracted for each sample (see Table 1). The graphical transposition of the DoE matrix is presented in Fig. 2.
Table 1.
DoE matrix and TPC values (mg/mL) of the extracts corresponding to each experimental run.
| Exp No | Exp Name | Run Order | Time (min) |
Amplitude (%) |
EtOH (%) | TPC (mg/mL) |
|---|---|---|---|---|---|---|
| 1 | N1 | 18 | 1 | 20 | 30 | 35.35 |
| 2 | N2 | 13 | 10 | 20 | 30 | 33.48 |
| 3 | N3 | 7 | 1 | 40 | 30 | 37.03 |
| 4 | N4 | 15 | 3 | 40 | 30 | 33.35 |
| 5 | N5 | 10 | 10 | 40 | 30 | 33.78 |
| 6 | N6 | 4 | 7 | 30 | 30 | 32.96 |
| 7 | N7 | 11 | 1 | 20 | 70 | 27.62 |
| 8 | N8 | 16 | 7 | 20 | 70 | 30.52 |
| 9 | N9 | 5 | 10 | 20 | 70 | 30.76 |
| 10 | N10 | 17 | 1 | 40 | 70 | 30.52 |
| 11 | N11 | 6 | 10 | 40 | 70 | 36.84 |
| 12 | N12 | 12 | 3 | 30 | 70 | 29.55 |
| 13 | N13 | 3 | 3 | 20 | 50 | 38.16 |
| 14 | N14 | 8 | 7 | 40 | 50 | 41.34 |
| 15 | N15 | 19 | 1 | 30 | 50 | 38.84 |
| 16 | N16 | 1 | 10 | 30 | 50 | 40.19 |
| 17 | N17 | 14 | 5 | 30 | 50 | 35.72 |
| 18 | N18 | 9 | 5 | 30 | 50 | 40.71 |
| 19 | N19 | 2 | 5 | 30 | 50 | 40.46 |
Fig. 2.

Graphical transposition of the DoE matrix.
The obtained response results were centralized, introduced into the design matrix, and further, the fitting of the experimental data was performed through multiple linear regression (MLR). The model fitting has been evaluated using the standard, most reliable statistical parameters: R2 (goodness of fit), which describes the fraction of the response variation explained by the model, Q2 (goodness of prediction), which estimates the prediction capacities of the model, ANOVA test and model reproducibility calculated and represented strictly based on the replicates specified in the design matrix. The values that describe each parameter are presented in Table 2. A good fitting is represented by high values of the model performance indicators, as close to value 1 as possible. Moreover, for a valid model, the difference between R2 and Q2 should be no more than 0.2–0.3 (0081 for our model), as higher differences indicate an inappropriately selected model. Reproducibility should be well over 0.5. The results confirm that the developed model is statistically good, showing a significant influence on the responses and that the model has no lack of fit. Similar statistical results have been registered in other studies where the DoE has been applied for optimization purposes [17], [21].
Table 2.
The values of parameters used to evaluate experimental model fitting.
| R2 | R2 Adj. | Q2 | SDY | RSD | N | Model Validity | Reproducibility | |
|---|---|---|---|---|---|---|---|---|
| TPC | 0.953 | 0.930 | 0.872 | 4.225 | 1.122 | 19 | 0.972 | 0.846 |
3.2. Process variables effects on the extracted TPC
Based on the DoE model, regression coefficients were automatically established for the studied variables by following the bellow mentioned equation (Eq. (1)):
| (1) |
where Yn is the dependent variable; 38.72 is the model constant; 0.78, 1.12, 1.54 represent linear coefficients; 1.88, 1.01 are interaction coefficients between two factors and 6.72 is a quadratic coefficient. The multilevel factor are noted in the equation as X1, X2, X3, representing the exposure time, extraction amplitude and the ethanolic concentration, respectively.
The equation coefficients aid to quantify the influence of each process parameter (i.e. factor) over the extracted TPC content. A scaled and centered coefficient plot highlighting the factor’s influence is presented in Fig. 3. As we expected, each extraction parameter induced quality changes regarding TPC for the extracts obtained from the experimental runs, additionally the DoE approach allowed us to study the interactions between these parameters and establish which of these interactions had a major influence on TPC. The first parameter analyzed was the solvent, being known that it is the main part of extraction mixtures and its features need to be compatible with the chosen method and extracted compounds [14], [41]. A quadratic interaction was observed regarding the solvent, meaning that the ethanol concentration influence was not linear. This fact is noticeable in the three dimensional response surface plot presented Fig. 4 and can be explained based on the best TPC results obtained using the intermediate ethanol concentration. Moreover, this trend can be correlated with the ability of the mixtures containing intermediate ethanolic concentration to interact with phenolic compounds from TC that are more or less polar to medium-polar compounds (see UHPLC-HRMS results). Even the physical–chemical properties of the solvent (i.e., polarity, dielectric constant, viscosity) are definitory for the yield of extraction, their effects can be augmented or diminished through the interaction with other factors that describe the extractive process. For example, in classic extractive methods (i.e., maceration, infusion, decoction), the solvent exerts the main influence on extraction yield through the physical and chemical interactions with the extracted matrices, its features being those that limit processes like diffusion and partition of analytes from extracted matrices [17], [42]. Conversely, in modern extraction techniques, extraction yield can be considered a consequence of the interaction between solvent and some specific features of the method.
Fig. 3.

Scaled and centered coefficient plot of the process parameter influence.
Fig. 4.

Response surface plot illustrating solvent influence on the UAE developed method.
Hence, our attention was further focused on studying the two statistical significant interactions identified in the model, namely between solvent and the other two working parameters, time and ultrasound amplitude, respectively. The presence of two mentioned interactions suggest the appearance of a synergistic effect regarding the TPC extraction yield, when increasing both working parameters at the same time. A great advantage of using a DoE approach, being highlighted in this situation – the DoE not only enhances the optimisation strategy by allowing the identification of interactions, but also allows the quantification of their effects.
3.2.1. Design space and process optimization
The described approach provided an in-depth understanding of the variables’ influence over the process. Further, based on the initial investigation domain and the DoE model, the Modde optimisation function was used to generate a design space by introducing the desired TPC values (minimum 39 mg GAE/mL and a target value of 40.5 mg GAE/mL) namely trying to maximize the extraction capacities; our findings were set taking into account that the values of TPC obtained from experimental runs varied from 27.62 to 40.71 mg GAE/mL (Table 1). As previously mentioned, it was established that for the chosen conditions, the optimal ethanolic concentration of the solvent must be 50%, aiming to obtain the best recovery of phenolic compounds from TC aerial parts with a minimum exposure time and applying the lowest amplitude possible. Predicted and experimentally measured values of the TPC extraction, as well as the parameters that describe design space are presented in Table 3.
Table 3.
Predicted and experimentally measured values of the TPC extraction.
| TPC (mg GAE/mL) |
Recovery (%) | ||||
|---|---|---|---|---|---|
| Objective |
DoE predicted | Experimentally measured | Predicted vs. measured value | ||
| Minimum | Target | Maximum | |||
| 39.00 | 40.50 | 42.00 | 40.39 | 41.04 | 101.6 |
| Extraction parameter | Value |
| Exposure time (min) | 6.5 |
| Ultrasounds amplitude (%) | 34.8 |
| Ethanolic concentration (%) | 50 |
Although UAE is promoted as an efficient method for obtaining high-quality extracts rich in bioactive compounds, it is well-known that inadequate extraction conditions can lead to their incomplete recovery; subsequently, undesired effects like degradation of interest compounds, formation of secondary products that can interfere with extraction or/and separation of analytes or equipment overloading can occur after an inappropriate UAE [11], [14], [43]. Moreover, it was observed that extraction yield is not proportional with the increasing of extraction parameters' values, it will increase in a dependent-manner until reaching a steady-state which remains constant or decrease, so after that maximum peak, every change regarding extraction parameters values being in fact energy loss [14]. The DoE approach allowed us to establish the optimal values of the afore-mentioned parameters (exposure time – 6.5 min, ultrasounds amplitude – 34.8%) and also to predict the TPC value (40.39 mg GAE/mL) for the extract obtained using the optimal conditions (OpTC). We confirmed the predicted data by applying experimentally the parameters above and measuring TPC for the optimized extract, obtaining a TPC value of 41.04 mg GAE/mL. Our findings fall within the narrow range of acceptable values (39–42 mg GAE/mL), showing a recovery of 101.6%.
Based on the mentioned set of constraints, the design space has also been calculated and plotted in Fig. 5. The crosshair that appears in the green area of the design space figure represents the robust setpoint, highlighting the input values which will provide the best statistical prediction. The main difference between the robust and optimal setpoints is that the above-mentioned optimal setpoint is focused on finding a solution as close to the target as possible [27]. In the present case, the robust setpoint is overlapped with the optimal setpoint, indicating a highly performant model (design space hypercurbe being described by time values between 5.6 and 7.4 min and amplitudes between 32.9 and 36.8%).
Fig. 5.

Design space and prediction of failure for TPC.
3.3. Total phenolic content (TPC) and total flavonoidic content (TFC)
As we previously mentioned, the TPC was used as a quality index for developing an optimized extraction method and for the characterization of the optimized extract (OpTC) (Table 4). This parameter offers a preliminary overview regarding the phytochemical profile of the extracts, their high values being usually correlated with an important antioxidant potential or other bioactivities [44]. Thymus species are well-established sources of polyphenols, including flavonoids, but there is a lack of knowledge regarding phenolic content and the profile of TC. Mărculescu et al. [7] reported a TFC value of 0.448%, the result being expressed as rutoside per 100 g of dried herbal drug. Due to the mismatch of the ways that TFC and TPC were expressed, it is difficult to compare our results with the previously obtained ones; still, our preliminary assessments allowed us to estimate the distribution of main types of phenolic compounds in OpTC, concluding that only 21.41% of them are flavonoids. Based on these findings, we guided further steps of the phytochemical analysis to make an in-depth and more comprehensive characterization of OpTC and focus our attention both on flavonoids and other classes of phenolics (i.e., phenolic acids, anthocyanins, stilbenes, etc.).
Table 4.
Overview of TPC, TFC and antioxidant capacity values measured for OpTC extract.
| Assay | OpTC |
|---|---|
| TPC (mg GA eq./g dw) | 156.20 ± 1.32 |
| TFC (mg Q eq./g dw) | 33.45 ± 0.36 |
| TEAC (mg TE/g dw) | 149.93 ± 0.74 |
| FRAP (mg TE/g dw) | 527.35 ± 27.42 |
| DPPH (mg TE/g dw) | 79.28 ± 0.41 |
| TBARS (μg/mL) | 11.85 ± 0.03 |
| OxHLIA | |
| Δt = 60 min | 10.2 ± 0.3 |
| Δt = 120 min | 23.6 ± 0.4 |
3.4. Untargeted phenolic profile of OpTC
In this work, the UHPLC-HRMS phenolic profiling allowed to putatively annotate 246 compounds that were reported in supplementary material considering their relative abundance values, isotopic MS, and MS/MS spectra. Flavonoids represented the most abundant class, consisting of 43 anthocyanins, 63 flavones and derivatives, 44 flavonols, and 21 flavan-3-ols. Besides, other non-flavonoid phenolic compounds were found, namely lignans (11 compounds), lower-molecular-weight phenolics (27 compounds), phenolic acids (32 compounds), and stilbenes (5 compounds). Interestingly, 76 phenolics (31%) were also structurally confirmed, with flavones and derivatives presenting the highest number of MS/MS confirmation against the comprehensive Food Database. Among the most abundant compounds, we found delphinidin, petunidin, and cyanidin 3-glucoside (for anthocyanins), luteolin 7-galactoside, sakuranetin, and cirsilineol (for flavones and derivatives), 3′,4′-dimethylquercetin and 3-methoxynobilitin (for flavonols), isomeric forms of salvianolic acid, lithospermic acid, and phlorin (for other phenolics), and 4-hydroxybenzoic acid, benzoic acid, and phenylacetic acid (for phenolic acids). As the next step, the annotated phenolics were quantified according to pure standard compounds representing the seven classes considered. Overall, other phenolics (quantified as oleuropein equivalents) and flavones (quantified as luteolin equivalents) showed the highest cumulative values, being 796.85 and 793.99 μg/g, respectively. Besides, other particularly abundant classes were represented by flavonols (205.66 μg/g), phenolic acids (98.51 μg/g), and anthocyanins (94.34 μg/g). Finally, a similar content of flavan-3-ols and stilbenes was recorded, being 40.35 and 45.91 μg/g, respectively. As previously reported, the OpTC extract was found to be a rich source of salvianolic acid derivatives (64.27 μg/g), such as salvianolic acid C, D, and L (supplementary material), never described in the scientific literature for this Thymus species. Accordingly, salvianolic acids have been recently reported in other Thymus species, such as T. mastichina [45], T. vulgaris, and T. citriodorus [46]; besides, salvianolic acid levels in Thymus have also been associated with extracts bioactivity, such as anti-proliferative and cytotoxic activity against different cell lines. Interestingly, salvianolic acid C was recently proposed as an inhibitor of SARS-CoV-2 infection, also exerting a potential effect on inhibiting cytokine storm induced by SARS-CoV-2 [47]. Regarding other compounds structurally confirmed by HRMS, we found (among the others) rosmarinic acid, delphinidin, and luteolin 7-glucoside (supplementary material). Rosmarinic acid (belonging to hydroxycinnamic acids) has been previously described as the major phenolic compound in both water and hydroethanolic extracts of T. citriodorus and T. vulgaris [46]. However, the OpTC extract under investigation revealed a lower content of rosmarinic acid (0.95 μg/g), rather showing a large abundance of hydroxybenzoic acids (such as benzoic acid and 4-hydroxybenzoic acid, on average: 15.41 μg/g). The high abundance of delphinidin (32.12 μg/g) is coherent with the purple-crimson colour of the flower, whilst the presence of luteolin 7-glucoside was also reported in previous work [48] dealing with the analysis of 11 different Thymus species.
3.5. In vitro biochemical assay of antioxidant potential
One of the most-cited bioactivities of phenolic-rich extracts obtained from plant matrices is the antioxidant potential, the mechanisms of this action being extensively studied [42], [49]. Hence, many in vitro methods were developed to evaluate antioxidant activity to achieve an in-depth approach regarding how different phenolic compounds or complexes can act as modulators of oxidative processes [50]. In the present work, we evaluated for the first time the antioxidant potential of a TC phenolic-enriched phytocomplex using 5 complementary biochemical assays (results shown in Table 4). Based on the obtained results, we can consider that OpTC extract exerts a strong in vitro antioxidant potential, acting especially as a free-radical scavenger (best results obtained for DPPH assay – 79.28 ± 0.41 mg TE/g). Moreover, results obtained in TBARS assay confirm the ability of OpTC extract to inhibit lipid peroxidation, its activity being comparable or stronger than other Thymus extracts (T. × citriodorus, T. algeriensis), including the common thyme (T. vulgaris) [51], [52], [53]. Similarly, the effectiveness of OpTC as oxidative haemolysis inhibitor was highlighted, the obtained results confirming an inhibitory capacity higher than the positive control (ΔtTrolox at 60 min being 21.80 ± 0.25 and ΔtTrolox at 120 min being 43.50 ± 0.82).
3.6. Enzyme inhibitory activity
OpTC extract was evaluated for its antiglycosidase, antityrosinase, and anticholinesterase potential, the results being presented in Table 5. As we can observe, the most relevant inhibition rate was described for the antiglucosidase effect (almost 13% from the positive control activity), followed by the anticholinesterase effect; unfortunately, the extract didn't show antityrosinase activity. Taking into account that glucosidase inhibitors are considered promising antidiabetic agents, our preliminary findings encourage future investigations on this extract in order to deeply elucidate its ability to interact with glucose metabolic pathways. This perspective is also supported by previous reports about antidiabetic potential already proven for the extracts obtained from other Thymus species like T. quinquecostatus Celak (crude extract and its EtOAc fraction), T. cariensis (hexane extract), and T. vulgaris [54], [55], [56]. However, we reported for the first time the aspects regarding the enzyme-inhibitory potential of TC (including its in vitro antidiabetic activity).
Table 5.
Overview of in vitro antioxidant potential of OpTC.
| Enzymatic assay | Value | |
|---|---|---|
| α-Glu (IC50, µg/mL) |
OpTC | 1985.09 ± 84.91 |
| Acarbose | 286.60 ± 36.71 | |
| Tyrosinase (IC50, µg/mL) |
OpTC | N.A |
| Kojic acid | 50.2 ± 0.15 | |
| Acetylcholinesterase (IC50, µg/mL) |
OpTC | 6333.75 ± 411.71 |
| Galantamine | 1.42 ± 0.25 | |
3.7. Correlations
Pearson's correlation coefficients (r) were then evaluated to unravel those phenolic compounds better correlating with the different bioactivity measured. Overall, the obtained correlogram (Fig. 6) revealed that stilbenes, flavan-3-ols, and other phenolics established the higher number (n = 5) of significant (p < 0.05) correlations with the studied bioactivities, followed by flavone derivatives (n = 4), anthocyanins (n = 3), flavonols and phenolic acids (n = 2). Interestingly, other phenolics (including mainly salvianolic acid derivatives) were highly correlated with OxHLIA values, both at 60 (r = 0.90) and 120 min (r = 0.91), while lower r values were observed for TEAC, FRAP, and DPPH values (supplementary material). The high correlation values observed between other phenolics and antioxidant capacity values are coherent with the strong and negative (p < 0.05; r = −1.00) correlation coefficients measured towards TBARS assay (Fig. 6. The protection of phenolics (such as salvianolic acids) against oxidative stress was also confirmed by Liu et al. [57], reporting the inhibition of malondialdehyde (MDA) generation, one of the final products of polyunsaturated fatty acids peroxidation in the cells, directly correlated with increased oxidative stress caused by free radicals causes. The same trend in terms of antioxidant potential was also observed for other two phenolic classes, such as stilbenes and flavan-3-ols (Fig. 6. Notably, the HRMS approach highlighted pinosylvin as the most abundant compound within the stilbenes class; this compound has been previously reported [58] as involved in the protection against oxidative stress through the induction of heme oxygenase-1 in human retinal pigment epithelial cells, and having different other in vitro activities, such as ORAC, ABTS, and FRAP [59].
Fig. 6.
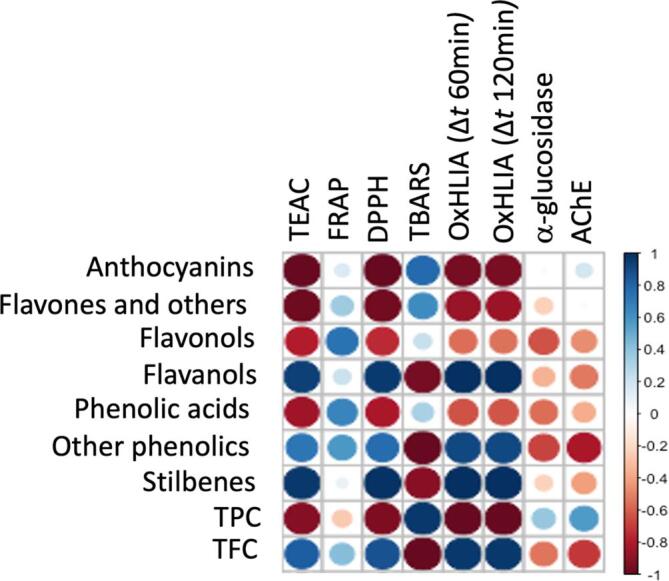
Correlogram considering the significant phenolic classes and the bioactivity values measured.
4. Conclusions
We developed an optimized ultrasound-assisted extraction method for non-volatile polyphenol fraction contained in the aerial parts of Thymus comosus Heuff. ex Griseb. et Schenk, taking into account the influence of three extraction parameters (independent variables) – time, ultrasound amplitude and ethanol concentration – on the total phenolic content (dependent variable) of the optimized extract (OpTC). DoE approach allowed us to find the optimal working conditions (exposure time – 6.5 min, ultrasounds amplitude – 34.8% and 50% ethanol solvent concentration) and also to study the interactions between independent variables and their relevance on the quality of the extract. Moreover, we applied an UHPLC-HRMS method for the phenolic profiling of OpTC, revealing a high content of flavonoid-type compounds. The presence of different classes of bioactive compounds was correlated for the first time with the antioxidant and enzyme inhibitory activities of the extracts obtained from this species, highlighting its importance as potential source of bioactive compounds. Additionally, our work was focused to bring several new insights regarding the link between phytochemical profile and bioactive potential of T. comosus; we emphasized for the first time the presence of several secondary metabolites with proven health benefits (i.e. anthocyanin derivatives, salvianolic acids) in the extracts obtained from this species and their enzyme-inhibitory activity, which can be considered as a main element of originality for the present study.
CRediT authorship contribution statement
Mihai Babotă: Conceptualization, Methodology, Software, Writing – review & editing. Oleg Frumuzachi: . Alexandru Gâvan: Conceptualization, Methodology, Software, Validation. Cristian Iacoviță: Visualization, Investigation. José Pinela: Conceptualization, Methodology, Software. Lillian Barros: Conceptualization, Methodology, Software. Isabel C.F.R. Ferreira: Supervision. Leilei Zhang: Visualization, Investigation. Luigi Lucini: Software, Validation. Gabriele Rocchetti: Supervision. Corneliu Tanase: Data curation, Writing – original draft. Gianina Crișan: Supervision. Andrei Mocan: Conceptualization, Methodology, Software, Funding acquisition.
Declaration of Competing Interest
The authors declare that they have no known competing financial interests or personal relationships that could have appeared to influence the work reported in this paper.
Acknowledgements
This work was supported by a grant of the Romanian Ministry of Education and Research, CNCS – UEFISCDI, project number PN-III-P1-1.1-PD-2019-1245, within PNCDI III”. The authors are grateful to the Foundation for Science and Technology (FCT, Portugal) for financial support through national funds FCT/MCTES to CIMO (UIDB/00690/2020), and for the contracts of J. Pinela (CEECIND/01011/2018) and L. Barros (institutional scientific employment program-contract).
Footnotes
This paper is dedicated to Prof. Dr. Mircea Tămaș on the occasion of his 80th anniversary, for his outstanding merits in the field of Natural Products and Medicinal Plants Research from Romania.
Supplementary data to this article can be found online at https://doi.org/10.1016/j.ultsonch.2022.105954.
Appendix A. Supplementary data
The following are the Supplementary data to this article:
References
- 1.Tohidi B., Rahimmalek M., Trindade H. Review on essential oil, extracts composition, molecular and phytochemical properties of Thymus species in Iran. Ind. Crops Prod. 2019;134:89–99. doi: 10.1016/j.indcrop.2019.02.038. [DOI] [Google Scholar]
- 2.Li X., He T., Wang X., Shen M., Yan X., Fan S., Wang L., Wang X., Xu X., Sui H., She G. REVIEW Traditional uses, chemical constituents and biological activities of plants from the Genus Thymus. Chem. Biodivers. 2019 doi: 10.1002/cbdv.201900254. [DOI] [PubMed] [Google Scholar]
- 3.EMA, Assessment report on Thymus vulgaris L., Thymus zygis L., herba, 2013. https://www.ema.europa.eu/en/documents/herbal-report/final-assessment-report-thymus-vulgaris-l-vulgaris-zygis-l-herba_en.pdf.
- 4.Thyme (Thymi Herba), Ph.Eur 9.0. 3 (2017) 1638–1639.
- 5.I. Boz, I. Burzo, M. Zamfirache, R. Efrose, Essential oils of Thymus comosus Heuff. ex Griseb. et Schenk from different areas of Romania, Analele Științifice Ale Univ., Al. I. Cuza” Iași s II a. Biol. Veg. (2014) 40–45.
- 6.Pavel M., Rǎdulescu V., Ilieş D.C. GC-MS analysis essential oil obtained from the species Thymus comosus Heuff. ex Griseb. (Lamiaceae) Farmacia. 2009;57:479–484. [Google Scholar]
- 7.Mărculescu A., Vase L., Hanganu D., Dăgulescu C., Antonie I., Olah N.K. Polyphenols analyses from Thymus species. Proc. Rom. Acad., Ser. B. 2007;3:117–121. [Google Scholar]
- 8.Qi S., Wang P., Zhan P., Tian H. Characterization of key aroma compounds in stewed mutton (goat meat) added with thyme (Thymus vulgaris L.) based on the combination of instrumental analysis and sensory verification. Food Chem. 2022;371 doi: 10.1016/j.foodchem.2021.131111. [DOI] [PubMed] [Google Scholar]
- 9.Al-Moghazy M., El-sayed H.S., Salama H.H., Nada A.A. Edible packaging coating of encapsulated thyme essential oil in liposomal chitosan emulsions to improve the shelf life of Karish cheese. Food Biosci. 2021;43 doi: 10.1016/j.fbio.2021.101230. [DOI] [Google Scholar]
- 10.Boutaoui N., Zaiter L., Benayache F., Benayache S., Carradori S., Cesa S., Giusti A.M., Campestre C., Menghini L., Innosa D., Locatelli M. Qualitative and quantitative phytochemical analysis of different extracts from <i>Thymus algeriensis<i/> aerial parts. Molecules. 2018;23 doi: 10.3390/molecules23020463. [DOI] [PMC free article] [PubMed] [Google Scholar]
- 11.Ameer K., Shahbaz H.M., Kwon J.-H. Green extraction methods for polyphenols from plant matrices and their byproducts: A review. Compr. Rev. Food Sci. Food Saf. 2017;16(2):295–315. doi: 10.1111/1541-4337.12253. [DOI] [PubMed] [Google Scholar]
- 12.Dzah C.S., Duan Y., Zhang H., Wen C., Zhang J., Chen G., Ma H. The effects of ultrasound assisted extraction on yield, antioxidant, anticancer and antimicrobial activity of polyphenol extracts: A review. Food Biosci. 2020;35 doi: 10.1016/j.fbio.2020.100547. [DOI] [Google Scholar]
- 13.Dong W., Chen Q., Wei C., Hu R., Long Y., Zong Y., Chu Z. Comparison of the effect of extraction methods on the quality of green coffee oil from Arabica coffee beans: Lipid yield, fatty acid composition, bioactive components, and antioxidant activity. Ultrason. Sonochem. 2021;74 doi: 10.1016/j.ultsonch.2021.105578. [DOI] [PMC free article] [PubMed] [Google Scholar]
- 14.Kumar K., Srivastav S., Sharanagat V.S. Ultrasound assisted extraction (UAE) of bioactive compounds from fruit and vegetable processing by-products: A review. Ultrason. Sonochem. 2021;70 doi: 10.1016/j.ultsonch.2020.105325. [DOI] [PMC free article] [PubMed] [Google Scholar]
- 15.Arya A., Chahal R., Nanda A., Kaushik D., Bin-Jumah M., Rahman M.H., Abdel-Daim M.M., Mittal V. Statistically designed extraction of herbs using ultrasound waves: A review. Curr. Pharm. Des. 2021;27(34):3638–3655. doi: 10.2174/1381612827666210222114441. [DOI] [PubMed] [Google Scholar]
- 16.Chemat F., Rombaut N., Sicaire A.G., Meullemiestre A., Fabiano-Tixier A.S., Abert-Vian M. Ultrasound assisted extraction of food and natural products. Mechanisms, techniques, combinations, protocols and applications. A review. Ultrason. Sonochem. 2017;34:540–560. doi: 10.1016/j.ultsonch.2016.06.035. [DOI] [PubMed] [Google Scholar]
- 17.Tanase C., Mocan A., Coșarcă S., Gavan A., Nicolescu A., Gheldiu A.-M., Vodnar D.C., Muntean D.-L., Crișan O. Biological and chemical insights of beech (Fagus sylvatica L.) bark: A source of bioactive compounds with functional properties. Antioxidants. 2019;8 doi: 10.3390/antiox8090417. [DOI] [PMC free article] [PubMed] [Google Scholar]
- 18.Oroian M., Ursachi F., Dranca F. Influence of ultrasonic amplitude, temperature, time and solvent concentration on bioactive compounds extraction from propolis. Ultrason. Sonochem. 2020;64 doi: 10.1016/j.ultsonch.2020.105021. [DOI] [PubMed] [Google Scholar]
- 19.B.B. Ismail, M. Guo, Y. Pu, W. Wang, X. Ye, D. Liu, Valorisation of baobab (Adansonia digitata) seeds by ultrasound assisted extraction of polyphenolics. Optimisation and comparison with conventional methods, Ultrason. Sonochem. 52 (2019) 257–267. 10.1016/j.ultsonch.2018.11.023. [DOI] [PubMed]
- 20.Dranca F., Oroian M. Optimization of ultrasound-assisted extraction of total monomeric anthocyanin (TMA) and total phenolic content (TPC) from eggplant (Solanum melongena L.) peel. Ultrason. Sonochem. 2016;31:637–646. doi: 10.1016/j.ultsonch.2015.11.008. [DOI] [PubMed] [Google Scholar]
- 21.Gavan A., Porfire A., Marina C., Tomuta I. Formulation and pharmaceutical development of quetiapine fumarate sustained release matrix tablets using a QbD approach. Acta Pharm. 2017;67:53–70. doi: 10.1515/acph-2017-0009. [DOI] [PubMed] [Google Scholar]
- 22.Moldovan C., Frumuzachi O., Babotă M., Menghini L., Cesa S., Gavan A., Sisea C.R., Tanase C., Dias M.I., Pereira C., Ferreira I.C.F.R., Crișan G., Mocan A., Barros L. Development of an optimized drying process for the recovery of bioactive compounds from the autumn fruits of Berberis vulgaris L. and Crataegus monogyna Jacq. Antioxidants. 2021;10 doi: 10.3390/antiox10101579. [DOI] [PMC free article] [PubMed] [Google Scholar]
- 23.Moldovan C., Babotă M., Mocan A., Menghini L., Cesa S., Gavan A., Sisea C., Vodnar D.C., Dias M.I., Pereira C., Ferreira I.C.F.R., Crişan G., Barros L. Optimization of the drying process of autumn fruits rich in antioxidants: a study focusing on rosehip (Rosa canina L.) and sea buckthorn (Elaeagnus rhamnoides (L.) A. Nelson) and their bioactive properties. Food Funct. 2021;12:3939–3953. doi: 10.1039/D0FO02783A. [DOI] [PubMed] [Google Scholar]
- 24.Rose F., Wern J.E., Ingvarsson P.T., Van De M., Andersen P., Follmann F., Foged C. Engineering of a novel adjuvant based on lipid-polymer hybrid nanoparticles: A quality-by-design approach. J. Control. Release. 2015 doi: 10.1016/j.jconrel.2015.05.004. [DOI] [PubMed] [Google Scholar]
- 25.Yu L.X. Pharmaceutical quality by design: product and process development, understanding, and control. Pharm. Res. 2008;25:781–791. doi: 10.1007/s11095-007-9511-1. [DOI] [PubMed] [Google Scholar]
- 26.Eriksson L., Johansson E., Kettaneh-Wold N., Wikstrom C., Wold S. 3rd ed. Umetrics Academy; Umea: 2008. Design of Experiments, Principles and Applications; p. 2008. [Google Scholar]
- 27.MODDE 11.0. Software for Design of Experiments: User’s Guide and Tutorial, Umetrics Academy, Umea 2015, n.d.
- 28.Gavan A., Iurian S., Casian T., Porfire A., Porav S., Voina I., Oprea A., Tomuta I. Fluidised bed granulation of two APIs: QbD approach and development of a NIR in-line monitoring method. Asian J. Pharm. Sci. 2019:1–12. doi: 10.1016/j.ajps.2019.03.003. [DOI] [PMC free article] [PubMed] [Google Scholar]
- 29.Iurian S., Tomuta I., Bogdan C., Rus L., Tokes T., Achim M., Moldovan M., Leucuta S. Defining the design space for freeze-dried orodispersible tablets with meloxicam. Drug Dev. Ind. Pharm. 2016;9045 doi: 10.1080/03639045.2016.1188108. [DOI] [PubMed] [Google Scholar]
- 30.Babotă M., Voştinaru O., Păltinean R., Mihali C., Dias M.I., Barros L., Ferreira I.C.F.R., Mocan A., Crişan O., Nicula C., Crişan G. Chemical Composition, Diuretic, and Antityrosinase Activity of Traditionally Used Romanian Cerasorum stipites. Front. Pharmacol. 2021;12 doi: 10.3389/fphar.2021.647947. [DOI] [PMC free article] [PubMed] [Google Scholar]
- 31.Rischer H., Nohynek L., Puupponen-Pimiä R., Aguiar J., Rocchetti G., Lucini L., Câmara J.S., Mendanha Cruz T., Boscacci Marques M., Granato D. Plant cell cultures of Nordic berry species: Phenolic and carotenoid profiling and biological assessments. Food Chem. 2022;366 doi: 10.1016/j.foodchem.2021.130571. [DOI] [PubMed] [Google Scholar]
- 32.Rocchetti G., Rebecchi A., Dallolio M., Braceschi G., Domínguez R., Dallolio G., Trevisan M., Lorenzo J.M., Lucini L. Changes in the chemical and sensory profile of ripened Italian salami following the addition of different microbial starters. Meat Sci. 2021;180 doi: 10.1016/j.meatsci.2021.108584. [DOI] [PubMed] [Google Scholar]
- 33.Tsugawa H., Cajka T., Kind T., Ma Y., Higgins B., Ikeda K., Kanazawa M., Vandergheynst J., Fiehn O., Arita M. MS-DIAL: Data-independent MS/MS deconvolution for comprehensive metabolome analysis. Nat. Methods. 2015;12:523–526. doi: 10.1038/nmeth.3393. [DOI] [PMC free article] [PubMed] [Google Scholar]
- 34.Salek R.M., Steinbeck C., Viant M.R., Goodacre R., Dunn W.B. The role of reporting standards for metabolite annotation and identification in metabolomic studies. Gigascience. 2013;2 doi: 10.1186/2047-217X-2-13. [DOI] [PMC free article] [PubMed] [Google Scholar]
- 35.M. Babotă, A. Mocan, L. Vlase, O. Crișan, I. Ielciu, A. Gheldiu, D.C. Vodnar, G. Crișan, Phytochemical analysis, antioxidant and antimicrobial activities of Helichrysum arenarium (L.) Moench. and Antennaria dioica (L.) Gaertn. flowers, Molecules. 23 (2018) 1–15. 10.3390/molecules23020409. [DOI] [PMC free article] [PubMed]
- 36.Mocan A., Fernandes A., Barros L., Crișan G., Smiljkovic M., Sokovic M., Ferreira I.C.F.R. Chemical composition and bioactive properties of the wild mushroom Polyporus squamosus (Huds.) Fr: a study with samples from Romania. Food Funct. 2017 doi: 10.1039/C7FO01514C. [DOI] [PubMed] [Google Scholar]
- 37.Silva de Sá I., Peron A.P., Leimann F.V., Bressan G.N., Krum B.N., Fachinetto R., Pinela J., Calhelha R.C., Barreiro M.F., Ferreira I.C.F.R., Gonçalves O.H., Ineu R.P. In vitro and in vivo evaluation of enzymatic and antioxidant activity, cytotoxicity and genotoxicity of curcumin-loaded solid dispersions. Food Chem. Toxicol. 2019;125:29–37. doi: 10.1016/j.fct.2018.12.037. [DOI] [PubMed] [Google Scholar]
- 38.Añibarro-Ortega M., Pinela J., Ćirić A., Lopes E., Molina A.K., Calhelha R.C., Soković M., Ferreira O., Ferreira I.C.F.R., Barros L. Extraction of aloesin from Aloe vera rind using alternative green solvents: Process optimization and biological activity assessment. Biology (Basel) 2021;10 doi: 10.3390/biology10100951. [DOI] [PMC free article] [PubMed] [Google Scholar]
- 39.A. Mocan, M. Babotă, A. Pop, I. Fizeșan, A. Diuzheva, M. Locatelli, S. Carradori, C. Campestre, L. Menghini, C.R. Sisea, M. Sokovic, G. Zengin, R. Păltinean, S. Bădărău, D.C. Vodnar, G. Crișan, Chemical constituents and biologic activities of sage species: A comparison between Salvia officinalis L., S. glutinosa L. and S. transsylvanica (Schur ex Griseb. & Schenk) Schur, Antioxidants. 9 (2020). 10.3390/antiox9060480. [DOI] [PMC free article] [PubMed]
- 40.Coetzee D.D., López V., Smith C. High-mesembrine Sceletium extract (TrimesemineTM) is a monoamine releasing agent, rather than only a selective serotonin reuptake inhibitor. J. Ethnopharmacol. 2016;177:111–116. doi: 10.1016/j.jep.2015.11.034. [DOI] [PubMed] [Google Scholar]
- 41.Tiwari B.K. Ultrasound: A clean, green extraction technology. TrAC - Trends Anal. Chem. 2015;71:100–109. doi: 10.1016/j.trac.2015.04.013. [DOI] [Google Scholar]
- 42.Gligor O., Mocan A., Moldovan C., Locatelli M., Crișan G., Ferreira I.C.F.R. Enzyme-assisted extractions of polyphenols – A comprehensive review. Trends Food Sci. Technol. 2019;88:302–315. doi: 10.1016/j.tifs.2019.03.029. [DOI] [Google Scholar]
- 43.Christou A., Stavrou I.J., Kapnissi-Christodoulou C.P. Continuous and pulsed ultrasound-assisted extraction of carob’s antioxidants: Processing parameters optimization and identification of polyphenolic composition. Ultrason. Sonochem. 2021;76 doi: 10.1016/j.ultsonch.2021.105630. [DOI] [PMC free article] [PubMed] [Google Scholar]
- 44.Granato D., Santos J.S., Maciel L.G., Nunes D.S. Chemical perspective and criticism on selected analytical methods used to estimate the total content of phenolic compounds in food matrices, TrAC - Trends Anal. Chem. 2016;80:266–279. doi: 10.1016/j.trac.2016.03.010. [DOI] [Google Scholar]
- 45.Taghouti M., Martins-Gomes C., Schäfer J., Santos J.A., Bunzel M., Nunes F.M., Silva A.M. Chemical characterization and bioactivity of extracts from Thymus mastichina: A thymus with a distinct salvianolic acid composition. Antioxidants. 2020;9 doi: 10.3390/antiox9010034. [DOI] [PMC free article] [PubMed] [Google Scholar]
- 46.Taghouti M., Martins-Gomes C., Félix L.M., Schäfer J., Santos J.A., Bunzel M., Nunes F.M., Silva A.M. Polyphenol composition and biological activity of Thymus citriodorus and Thymus vulgaris: Comparison with endemic Iberian Thymus species. Food Chem. 2020;331 doi: 10.1016/j.foodchem.2020.127362. [DOI] [PubMed] [Google Scholar]
- 47.Yang C., Pan X., Xu X., Cheng C., Huang Y., Li L., Jiang S., Xu W., Xiao G., Liu S. Salvianolic acid C potently inhibits SARS-CoV-2 infection by blocking the formation of six-helix bundle core of spike protein. Signal Transduct. Target. Ther. 2020;5 doi: 10.1038/s41392-020-00325-1. [DOI] [PMC free article] [PubMed] [Google Scholar]
- 48.Sarfaraz D., Rahimmalek M., Saeidi G. Polyphenolic and molecular variation in Thymus species using HPLC and SRAP analyses. Sci. Rep. 2021;11 doi: 10.1038/s41598-021-84449-6. [DOI] [PMC free article] [PubMed] [Google Scholar]
- 49.Gebicki J.M., Nauser T. Fast antioxidant reaction of polyphenols and their metabolites. Antioxidants. 2021;10 doi: 10.3390/antiox10081297. [DOI] [PMC free article] [PubMed] [Google Scholar]
- 50.Prior R.L., Wu X., Schaich K. Standardized methods for the determination of antioxidant capacity and phenolics in foods and dietary supplements. J. Agric. Food Chem. 2005;53(10):4290–4302. doi: 10.1021/jf0502698. [DOI] [PubMed] [Google Scholar]
- 51.B.E.C. Ziani, S.A. Heleno, K. Bachari, M.I. Dias, M.J. Alves, L. Barros, I.C.F.R. Ferreira, Phenolic compounds characterization by LC-DAD- ESI/MSn and bioactive properties of Thymus algeriensis Boiss. & Reut. and Ephedra alata Decne, Food Res. Int. 116 (2019) 312–319. x10.1016/j.foodres.2018.08.041. [DOI] [PubMed]
- 52.Martins N., Barros L., Santos-Buelga C., Silva S., Henriques M., Ferreira I.C.F.R. Decoction, infusion and hydroalcoholic extract of cultivated thyme: Antioxidant and antibacterial activities, and phenolic characterisation. Food Chem. 2015;167:131–137. doi: 10.1016/j.foodchem.2014.06.094. [DOI] [PubMed] [Google Scholar]
- 53.Rita I., Pereira C., Barros L., Ferreira I.C.F.R. Exploring reserve lots of Cymbopogon citratus, Aloysia citrodora and Thymus × citriodorus as improved sources of phenolic compounds. Food Chem. 2018;257:83–89. doi: 10.1016/j.foodchem.2018.03.006. [DOI] [PubMed] [Google Scholar]
- 54.Hyun T.K., Kim H.C., Kim J.S. Antioxidant and antidiabetic activity of Thymus quinquecostatus Celak. Ind. Crops Prod. 2014;52:611–616. doi: 10.1016/j.indcrop.2013.11.039. [DOI] [Google Scholar]
- 55.M.H. Alu’datt, T. Rababah, A. Johargy, S. Gammoh, K. Ereifej, M.N. Alhamad, M.S. Brewer, A.A. Saati, S. Kubow, M. Rawshdeh, Extraction, optimisation and characterisation of phenolics from Thymus vulgaris L.: Phenolic content and profiles in relation to antioxidant, antidiabetic and antihypertensive properties, Int. J. Food Sci. Technol. 51 (2016) 720–730. 10.1111/ijfs.12944.
- 56.Küçükaydın S., Çayan F., Tel-Çayan G., Duru M.E. HPLC-DAD phytochemical profiles of Thymus cariensis and T. cilicicus with antioxidant, cytotoxic, anticholinesterase, anti-urease, anti-tyrosinase, and antidiabetic activities. South African J. Bot. 2021;143:155–163. doi: 10.1016/j.sajb.2021.07.018. [DOI] [Google Scholar]
- 57.Liu M., Xu H., Zhang L., Zhang C., Yang L., Ma E., Liu L., Li Y. Salvianolic acid B inhibits myofibroblast transdifferentiation in experimental pulmonary fibrosis via the up-regulation of Nrf2. Biochem. Biophys. Res. Commun. 2018;495(1):325–331. doi: 10.1016/j.bbrc.2017.11.014. [DOI] [PubMed] [Google Scholar]
- 58.Koskela A., Reinisalo M., Hyttinen J.M.T., Kaarniranta K., Karjalainen R.O. Pinosylvin-mediated protection against oxidative stress in human retinal pigment epithelial cells. Mol. Vis. 2014;20:760–769. [PMC free article] [PubMed] [Google Scholar]
- 59.Rodríguez-Bonilla P., Gandía-Herrero F., Matencio A., García-Carmona F., López-Nicolás J.M. Comparative study of the antioxidant capacity of four stilbenes using ORAC, ABTS+, and FRAP techniques. Food Anal. Methods. 2017;10(9):2994–3000. doi: 10.1007/s12161-017-0871-9. [DOI] [Google Scholar]
Associated Data
This section collects any data citations, data availability statements, or supplementary materials included in this article.