Significance
Molecular weight determinations play a vital role in the characterization of supramolecular polymers. They are essential to assessing the degree of polymerization, which in turn can have a significant impact on the properties of the polymer. While numerous characterization methods have been developed to estimate the number-average molecular weight (Mn) of supramolecular polymers, a simple visual method could provide advantages in terms of ease of use. We have now developed a system wherein differences in the fluorescent signature, including changes in color, allow variations in the Mn of an anion-responsive supramolecular polymer [M1·Zn(OTf)2]n to be readily monitored. The present visual differentiation strategy provides a tool that may be used to characterize supramolecular polymers.
Keywords: supramolecular polymers, molecular weight, fluorescence, J-aggregate, self-assembly
Abstract
Issues of molecular weight determination have been central to the development of supramolecular polymer chemistry. Whereas relationships between concentration and optical features are established for well-behaved absorptive and emissive species, for most supramolecular polymeric systems no simple correlation exists between optical performance and number-average molecular weight (Mn). As such, the Mn of supramolecular polymers have to be inferred from various measurements. Herein, we report an anion-responsive supramolecular polymer [M1·Zn(OTf)2]n that exhibits monotonic changes in the fluorescence color as a function of Mn. Based on theoretical estimates, the calculated average degree of polymerization (DPcal) increases from 16.9 to 84.5 as the monomer concentration increases from 0.08 mM to 2.00 mM. Meanwhile, the fluorescent colors of M1 + Zn(OTf)2 solutions were found to pass from green to yellow and to orange, corresponding to a red shift in the maximum emission band (λmax). Therefore, a relationship between DPcal and λmax could be established. Additionally, the anion-responsive nature of the present system meant that the extent of supramolecular polymerization could be regulated by introducing anions, with the resulting change in Mn being readily monitored via changes in the fluorescent emission features.
Issues of molecular weight determination have been central to the development of polymer chemistry and date back, in fact, to the earliest days of the field and the controversies Staudinger faced (1, 2). The number-average molecular weight (Mn) of polymeric materials has a direct effect on their mechanical properties (1–3). Typically, the higher the molecular weight of the polymer, the greater its hardness and strength, as exemplified by polyethylene (4, 5). Therefore, determining the molecular weight of a polymeric material is often a first key step in its characterization. Being able to do so simply could be particularly advantageous in the case of supramolecular polymers where the degree of polymerization, and hence molecular weight, can vary as a function of conditions. Supramolecular polymers, unlike conventional polymers, are polymeric arrays of repeat units that are held together by directional noncovalent interactions (6, 7). Given the reversible noncovalent bonds embodied in supramolecular polymers, they typically exhibit not only polymer-like properties as bulk materials and in solution, but also dynamic characteristics. These latter attributes often have no parallel in the case of covalent polymers and include inter alia reversible formation, recyclability, and stimulus responsiveness (8–26), including to anions whose role in the fields of biology, chemistry, energy, and supramolecular chemistry is well appreciated (27–42). These key features complicate molecular weight determinations, as does the fact that a distribution of molecular weights around an average is generally observed. Moreover, due to the dynamic nature of noncovalent bonds, the monomers used to create supramolecular polymers can assemble in a variety of aggregation modes (7, 39). For instance, when the monomer concentration is low, cyclic species or oligomers are more likely to form. However, at concentrations greater than the so-called critical polymer concentration (CPC), appropriately designed monomers will assemble to form supramolecular polymers, whose Mn typically grows with monomer concentration. As a consequence, the Mn of supramolecular polymers generally reflects the constituent monomer concentration(s).
Whereas relationships between concentration and optical features are established for well-behaved absorptive and emissive species (e.g., monomeric compounds that obey the Beer–Lambert or Beer–Lambert–Bouguer laws), for most polymeric systems no simple correlation exists between easy-to-monitor optical properties, such as fluorescence emission color, and the molecular weight. As such, the molecular weights of supramolecular polymers have to be inferred from less-direct measurements (43–45). For example, the average degree of supramolecular polymerization can be calculated (DPcal) by measuring the equilibrium constant of the interaction between monomers and applying various theoretical models (39, 46, 47). Alternatively, in certain cases the molecular weights of supramolecular polymers can be deduced empirically from the intrinsic viscosities using the Mark–Houwink equation (48, 49). Vapor pressure osmometry measurements, which rely on the relationship between molecular weight and vapor pressure (Raoult’s law), can be used to deduce the molar mass of supramolecular polymers (50, 51). Matrix-assisted laser desorption ionization time-of-flight mass spectrometry has also been exploited to characterize oligomers and various relatively small self-assembled ensembles (52, 53). The molecular weights (Mn) of supramolecular polymers can also be inferred from concentration-dependent chemical shift changes in the corresponding 1H NMR spectra (54). Separately, single-molecule force spectroscopy experiments have been used to determine the length of the bridges between the tip and substrate formed by supramolecular polymers, thus providing insights into the effective molecular weight of the polymer (55). These techniques notwithstanding, there remains a need for simple methods that would allow changes in the molecular weight of supramolecular polymers to be determined by optical means. Here, we report a system where a simple correlation is established between the fluorescence emission features and the Mn of a supramolecular polymer.
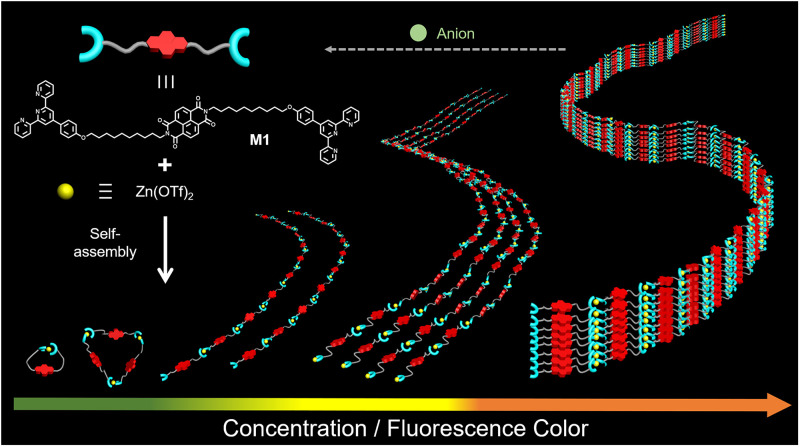
The present approach is based on an appreciation that J-type dyes have been identified in a variety of aggregation modes (56–59), including monomer, dimer, and stacked arrangements. Dyes of this type, which include a number of polycyclic and heterocyclic aromatic molecules, typically display fluorescent colors that vary as a function of concentration. Therefore, we postulated that incorporating J-type dyes into appropriately chosen monomers would endow the resulting putative supramolecular polymers with variable fluorescent colors, the specifics of which could be correlated with the degree of polymerization (Fig. 1). With such thinking in mind, we synthesized monomer M1 by modifying a J-type dye, naphthalene diimide (NDI) (60, 61), with two alkylated terpyridine derivatives at both ends (Fig. 1). The NDI-derived M1 interacts with Zn(OTf)2 in DMF/H2O (1/4, vol/vol) solution through terpyridine–Zn2+ coordination. At low monomer concentrations, these two components were expected to self-assemble into cyclic species or short oligomers characterized by long distances between the NDI subunits. Thus, little stacking would be seen, resulting in a green, monomer-dominated fluorescence for dilute M1 + Zn(OTf)2 solutions. As the total monomer concentration is increased with the ratio of M1 and Zn(OTf)2 kept constant at 1:1, the cyclic species would be expected to transform gradually into linear supramolecular polymers, [M1·Zn(OTf)2]n. Under these conditions, a limited degree of interchain association (e.g., the formation of double-strand dimers) is expected, leading to a decrease in the distance between NDI groups and a change in the fluorescent color from green to yellow. Upon increasing the monomer concentration, a corresponding increase in the polymer chain length is expected, which will lead to tight entanglement between individual polymer chains, further reducing the average distance between the emissive NDI groups. In the limit, this reduction in inter-NDI spacing would lead to formation of J-aggregates, which in the case of the NDI-containing M1 component would give rise to orange-colored fluorescence. In accord with prior work involving supramolecular systems (27, 38), we also appreciated that anion recognition could be used to adjust the molecular weight of the supramolecular polymers formed from M1 and Zn(OTf)2. Specifically, we expected that adding tetraethylammonium hydroxide (TBAOH) to [M1·Zn(OTf)2]n would lead to depolymerization as the result of complexation between the OH– anions and Zn2+. This would lead to restoration of the initial emission color. As detailed below, these design expectations were realized. Specifically, the Mn of the supramolecular aggregates formed from M1 and Zn(OTf)2 produced in dimethylformamide (DMF)/H2O (1/4, vol/vol) solution could be distinguished by monitoring the fluorescent colors as a function of M1 + Zn(OTf)2 and TBAOH concentration.
Fig. 1.
Schematic representation of the anion-responsive supramolecular polymer of this study. Chemical structure of supramolecular monomers and cartoon representations of the proposed supramolecular polymerization process and anion-responsive behavior and the various fluorescent colors expected as the degree of intermonomer interaction increases.
Results and Discussion
Synthesis of M1 and Preparation of M1 + Zn(OTf)2 Solutions.
The synthetic procedure used to access monomer M1 is shown in SI Appendix, Fig. S1. M1 and its precursors were characterized by means of 1H NMR spectroscopy, 13C NMR spectroscopy, and high-resolution mass spectrometry (SI Appendix, Figs. S2–S13). To prepare M1 + Zn(OTf)2 solutions (SI Appendix, Fig. S14), equimolar solutions of monomer M1 and Zn(OTf)2 were made up in chloroform (1.25 mL) and methanol (1.25 mL), respectively. These two solutions were then combined and stirred for 1 h at 298 K. The resulting mixture was subject to slow evaporation at 298 K giving M1·Zn(OTf)2 as a solid, which subsequently was dissolved in DMF/H2O (1/4, vol/vol) to give a stock solution of M1 + Zn(OTf)2 (2.00 mM, 500 μL). Standard solutions of M1 + Zn(OTf)2 (0.08 to 1.80 mM) were then prepared by diluting this M1 + Zn(OTf)2 stock solution (2.00 mM) with DMF/H2O (1/4, vol/vol). Note that the concentrations of M1 + Zn(OTf)2 mentioned in this article refer to the total monomer concentration [i.e., the sum of the M1 + Zn(OTf)2 concentrations]. Unless otherwise noted, the ratio of M1 and Zn(OTf)2 was held constant at 1:1.
Job Plots and Ultraviolet-Visible Spectroscopic Titrations.
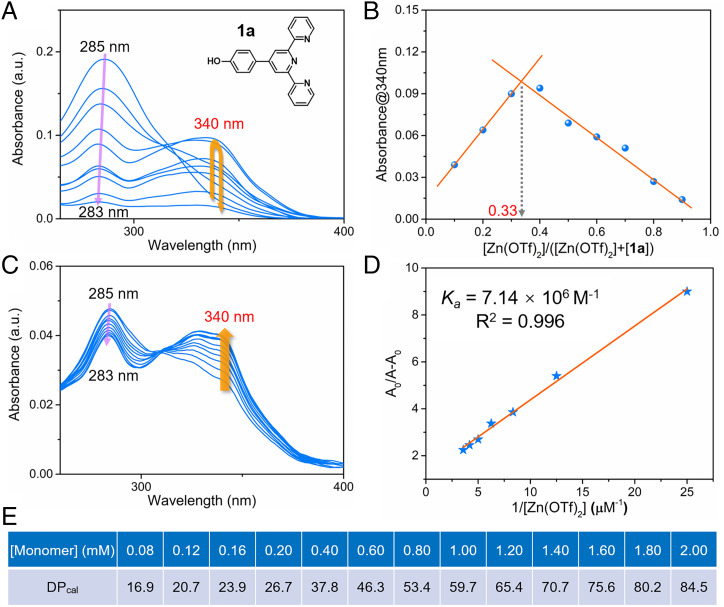
To obtain insights into the interactions between M1 and Zn(OTf)2, the complexation between precursor 1a (Fig. 2A) and Zn(OTf)2 was studied using the Job method (62–64). As shown in Fig. 2A, an adsorption peak for 1a in DMF/H2O (1/4, vol/vol) was observed at 285 nm, whose intensity decreased as the molar ratio of [Zn(OTf)2]/([Zn(OTf)2] + [1a]) increased. An absorbance feature at 340 nm was also seen that increased in intensity initially but then declined as the molar ratio of [Zn(OTf)2]/([Zn(OTf)2] + [1a]) increased. The changes in the absorbance at 340 nm were plotted against the molar ratio of [Zn(OTf)2]/([Zn(OTf)2] + [1a]) to give a Job’s plot (Fig. 2B) (63). This plot revealed an absorbance maximum when the mole fraction of [Zn(OTf)2] was 0.33. While not a proof, this finding is consistent with a 1:2 binding stoichiometry in this solvent system, wherein each Zn2+ ion complexes two molecules of 1a.
Fig. 2.
Complexation study and degree of polymerization calculation. (A) UV-vis spectra of mixtures of Zn(OTf)2 and 1a in DMF/H2O (1/4, vol/vol) at different molar ratios. The total concentration of 1a and Zn(OTf)2 was kept at 5.00 μM. (Inset) chemical structure of compound 1a. (B) Job’s plot of compound 1a and Zn(OTf)2. (C) UV-vis spectra of compound 1a (0.280 μM) in 1.00 mL DMF/H2O (1/4, vol/vol) recorded upon the stepwise addition of Zn(OTf)2 (100 μM) at 298 K. (D) Plot of (A0/(A − A0) as a function of 1/[Zn(OTf)2]. The apparent association constant Ka corresponding to the interaction between 1a (0.280 μM) and Zn(OTf)2 (100 μM) was determined using the Benesi–Hilderbrand equation A0/(A − A0) = (A0/(Amax − A0))((1/Ka) [Zn(OTf)2]−1 + 1). (E) The degree of polymerization calculated (DPcal) for equimolar mixtures of M1 and Zn(OTf)2 (0.08 to 2.00 mM).
The binding between compound 1a and Zn(OTf)2 was further studied by means ultraviolet-visible (UV-vis) spectroscopic titrations (Fig. 2C) (65). Upon the addition of Zn(OTf)2 to a dilute solution of 1a in DMF/H2O (1/4, vol/vol), a decline in the original adsorption peak at 285 nm is seen. Concurrently, a new peak at 340 nm is seen to grow in. This latter spectral feature is attributed to the formation of octahedral complexes characterized by distinct metal–ligand charge transfer bands (66). Titration curves were constructed by plotting the absorbance values at 340 nm versus the Zn(OTf)2 concentration (SI Appendix, Fig. S15). A positive correlation between the absorbance intensity at 340 nm and the Zn(OTf)2 concentration was seen over the 0.00 to 1.00 equiv. concentration range. However, adding further quantities of Zn(OTf)2 produced no appreciable changes in the absorbance intensity at 340 nm. The relationship between the absorbance at 340 nm and the Zn(OTf)2 concentration (0.00 to 1.00 equiv.) could be linearized according to the Benesi–Hildebrand equation (67, 68), allowing a binding constant, Ka, of 7.14 × 10⁶ M−1, corresponding to the interaction 1a and Zn(OTf)2, to be estimated (Fig. 2D). Compound 1a containing one terpyridine can complex with Zn(OTf)2 in a 2:1 manner. In contrast to compound 1a, monomer M1, which includes two terpyridines, can self-assemble with Zn(OTf)2 in a net 1:1 stoichiometry to form supramolecular polymers at high concentrations. Thus, the binding constant of 1a and Zn(OTf)2 can be used to calculate the DPcal of the supramolecular polymer, [M1·Zn(OTf)2]n. This value was then substituted into the equation DP ≈ (KaC)1/2 to obtain a relationship between the DPcal and the monomer concentration (Fig. 2E) (54, 69). Based on the model studies with 1a, it was expected that increasing the total concentration of an equimolar mixture of M1 and Zn(OTf)2 from 0.08 mM to 0.20 mM would lead to a corresponding increase in the DPcal from 16.9 to 26.7 (Fig. 2E). Likewise, as the concentration of M1 + Zn(OTf)2 increased from 0.40 mM to 2.00 mM, the calculated DPcal rises from 37.8 to 84.5 (Fig. 2E). The theoretical model was also successfully applied to the characterization of molecular weights for similar metallo-supramolecular polymers based on other metal ions, including Fe(II), Cu(II), Co(II), Cd(II), and Ni(II) (SI Appendix, Figs. S16–S20).
Viscosity Method.
To provide evidence that a supramolecular polymer, [M1·Zn(OTf)2]n, was formed from a mixture of M1 and Zn(OTf)2, we determined the specific viscosity of various M1 + Zn(OTf)2 solutions (0.08 to 2.00 mM) (70, 71). A double logarithmic plot of the specific viscosity versus the M1 + Zn(OTf)2 concentration was then constructed (SI Appendix, Fig. S21). As the total concentration of these two monomers increased from 0.08 to 0.20 mM, the specific viscosity rose steadily with a slope of 0.256. When the total concentration of M1 + Zn(OTf)2 was increased past 0.40 mM, there was a dramatic increase in the specific viscosity, with a slope of 1.14 being seen. The concentration of M1 + Zn(OTf)2 corresponding to the intersection of two fitted linear lines (0.22 mM) was defined as the CPC (70). The slope in the low concentration range reflects the characteristics of cyclic species or oligomers expected in dilute solutions. Conversely, the dramatic increase in the specific viscosity seen above the CPC is ascribed to the formation of linear supramolecular polymers and the entanglement between individual linear polymers. Therefore, these results support the design expectation that supramolecular polymers would form at high total monomer concentrations, while relatively small oligomers would form at lower monomer concentrations.
Scanning Electron Microscopic, Atomic Force Microscopic, and Laser Scanning Confocal Microscopic Studies of Equimolar Mixtures of M1 and Zn(OTf)2.
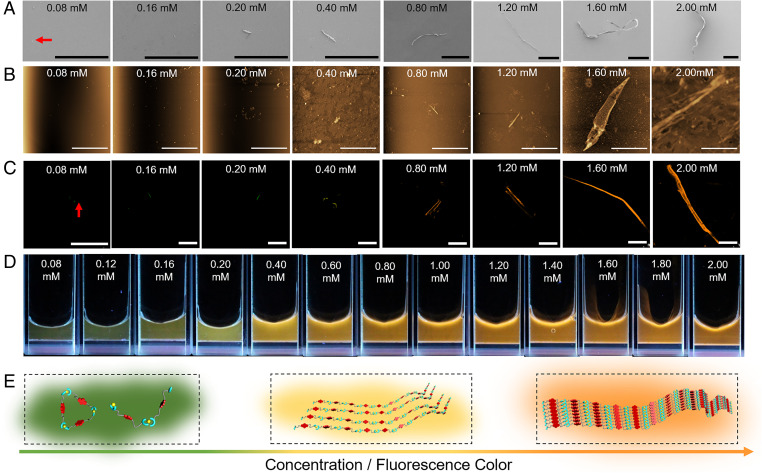
Additional evidence for the formation of supramolecular polymers of generalized structure [M1·Zn(OTf)2]n came from morphology experiments (72). Scanning electron microscopic (SEM) images of M1 + Zn(OTf)2 determined at different concentrations of M1 + Zn(OTf)2 are shown in Fig. 3A. At total concentrations below 0.20 mM, only particle-like structures are observed. However, fibrous structures (73) are seen when the total concentration reached 0.20 mM. The length of these fibers was seen to grow as the monomer concentration was increased further from 0.20 mM to 2.00 mM, as would be expected given the proposed formation of [M1·Zn(OTf)2]n.
Fig. 3.
Morphology, fluorescence behavior, and proposed determinants of the observed M1 + Zn(OTf)2 emission colors. (A) SEM images, (B) AFM images, and (C) LSCM images of the equimolar mixtures of M1 and Zn(OTf)2 at different concentrations (0.08, 0.16, 0.20, 0.40, 0.80, 1.20, 1.60, and 2.00 mM in DMF/H2O (1/4, vol/vol)). λex = 405 nm. (D) Photographs of equimolar mixtures of M1 and Zn(OTf)2 (0.08 to 2.00 mM) under UV light. (E) Cartoon representations of the self-assembly process thought to govern equimolar mixtures of M1 and Zn(OTf)2 and the change in the fluorescence color observed as the concentration is increased. (Scale bars: A, 200 μm; B, 20.0 μm; C, 100 μm.)
Atomic force microscopy (AFM) is another powerful tool that may be used to determine the morphology of self-assembled materials (74). Thus, [M1·Zn(OTf)2]n was analyzed at different monomer concentrations via tapping-mode AFM (75). Consistent with the images captured through SEM, microsized particles were observed by AFM over the 0.08 mM to 0.16 mM monomer concentration regime, while fibrous species of increasing size were seen as the monomer concentration was increased past 0.20 mM; this was accompanied by a decrease in the number of visible particles (Fig. 3B). Again, these findings were taken as evidence that short oligomers are produced at relatively low monomer concentrations, while supramolecular polymers are formed at high monomer concentrations (74, 76).
Laser scanning confocal microscopy (LSCM) was used to probe the change in fluorescence and morphological characteristics as the total concentration of M1 + Zn(OTf)2 in DMF/H2O (1/4, vol/vol) was varied (77, 78). The resulting outputs of LSCM were obtained as digital false-color images (77). The fluorescence colors shown for the LSCM images (Fig. 3C) were then generated using the fluorescence colors of M1 + Zn(OTf)2 solutions under UV excitation (hand-held lamp; 365 nm) (Fig. 3D). As shown in Fig. 3C, microsized particles were observed at a total monomer concentration of 0.08 mM. As the monomer concentration increased, fibrous species first appeared and then increased in size. A concurrent change in the color of the samples was also observed, revealing distinct differences in the fluorescence properties as a function of the dynamic assembly process. Notably, as the monomer concentration was raised from 0.08 mM to 0.16 mM, the fluorescent color of the samples evolved, changing from dark green to green. When the total monomer concentration reached 0.40 mM (corresponding to formation of a fibrous structure) a yellow fluorescence was seen. An orange fluorescence was seen at M1 + Zn(OTf)2 concentrations over 0.40 mM. These findings thus provided an initial indication that a useful relationship might exist between the monomer concentration and the fluorescence features of the self-assembled species formed from 1:1 mixtures of M1 and Zn(OTf)2.
Fluorescence Properties of Equimolar Mixtures of M1 and Zn(OTf)2.
To test the presumed relationship between monomer concentration and the fluorescence emission in our system, we monitored the colors of 1:1 M1 + Zn(OTf)2 solutions in DMF/H2O (1/4, vol/vol) at different total monomer concentrations under UV excitation. As shown in Fig. 3D and Movie S1, as the monomer concentration increased different colors were observed. In accord with the LSCM study above, the colors evolved from green to yellow and then to orange with increasing M1 + Zn(OTf)2 concentration.
Fig. 3E shows in cartoon fashion our proposed mechanistic rationale for the observed fluorescent color changes. At low total monomer concentrations (0.08 to 0.20 mM), M1 and Zn(OTf)2 self-assemble to form cyclic species or oligomers. Under these conditions, the probability of contact between M1 subunits is low, resulting in a large separation between the emissive NDI groups. Thus, a monomer-like green NDI-based emission is seen. As the total monomer concentration approaches the CPC (0.22 mM), supramolecular polymers start to form, contributing to more chain-to-chain contacts. These contacts serve to reduce the distance between the NDI groups, prompting a change in the fluorescent color from green to yellow. A further increase in the monomer concentration (0.60 to 2.00 mM) leads to an increase in the polymer size and molecular weight and interchain entanglement; this further shortens the distance between the NDI groups and supports formation of J-aggregates characterized by an orange emission.
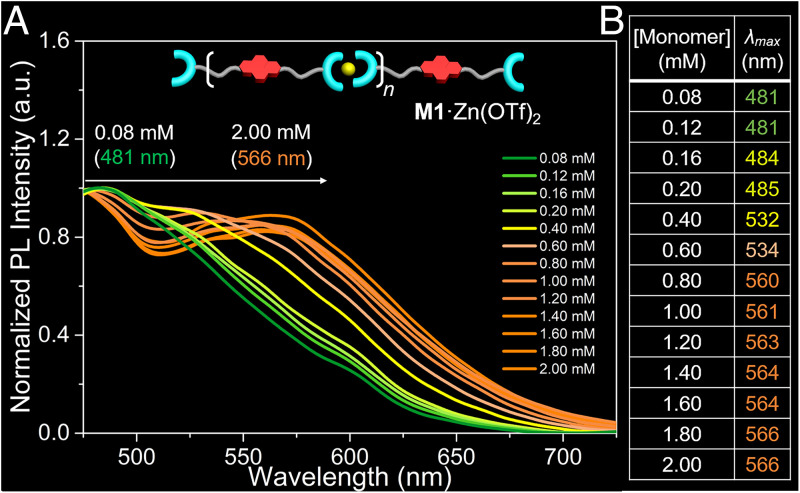
To quantify the relationship between color and monomer concentration the emission spectra of 1:1 solutions of M1 and Zn(OTf)2 were recorded as a function of total monomer concentration. Note that an excitation wavelength of 410 nm was used since cleaner spectra were obtained than when a 365 nm excitation (as used for the photographic studies above) was employed, The normalized emission spectra (475 to 725 nm) for these M1 + Zn(OTf)2 solutions over the 0.08 mM to 2.00 mM concentration range are shown in Fig. 4A. The corresponding emission maxima (λmax) are shown in Fig. 4B. When the monomer concentration is increased from 0.08 mM to 0.20 mM, a shift of only 4 nm in λmax from 481 nm to 485 nm is seen. This finding is consistent with the monomeric form of NDI dominating within this concentration regime. However, as the concentration reached 0.40 mM, a remarkable redshift in the λmax to 532 nm was observed, a finding interpreted in terms of the formation of substantial quantity of the dimeric NDI form. At high concentrations (i.e., >0.60 mM), the λmax shifts steadily from 534 nm to 560 nm as a function of concentration. This finding is interpreted in terms of larger-sized π-stacked structures dominating in this concentration regime. These results led us to infer that a dependent relationship between the monomer concentration and the observed λmax pertains for solutions of M1 + Zn(OTf)2 (58, 79). Additionally, the emission spectra of these M1 + Zn(OTf)2 solutions were recorded over the 0.08 mM to 2.00 mM range and used to generate a Commission Internationale de l’Eclairage (CIE) diagram (SI Appendix, Fig. S23). This CIE diagram proved concordant with the colors shown in Fig. 3D (80).
Fig. 4.
Fluorescence characterization of [M1·Zn(OTf)2]n (A) Normalized fluorescent spectra of equimolar mixtures of M1 and Zn(OTf)2 in the concentration range (0.08 to 2.00 mM in DMF/H2O [1/4, vol/vol]) at 298 K. λex = 410 nm. Slit: 10/15. (B) Table showing the relationship between λmax and monomer concentration.
Relationship between DPcal and the Maximum Emission Wavelength.
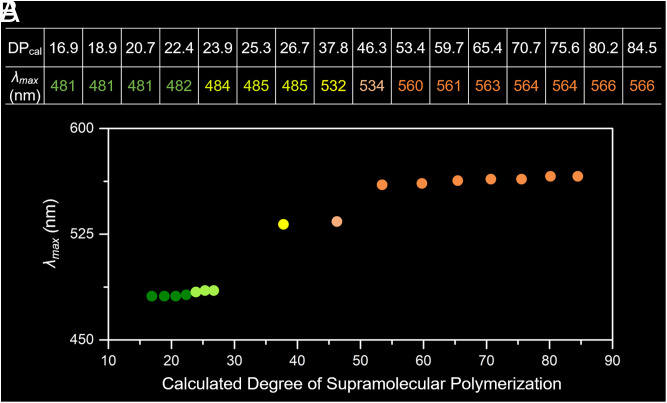
The inferred dependent relationship between 1) the total monomer concentration and the DPcal (Fig. 2E) and 2) between the monomer concentration and the observed λmax (Fig. 4B) allowed us to correlate the λmax with DPcal as shown in Fig. 5. As the DPcal increases from 16.9 to 26.7 only a slight shift in λmax from 481 nm to 485 nm is seen. In contrast, a dramatic shift in λmax to 532 nm, corresponding to a DPcal of 37.8, was observed (Fig. 5A). A further remarkable shift in λmax from 534 nm to 560 nm occurred as the DPcal rose from 46.3 to 53.4. As the DPcal was then increased to 84.5, a steady increase in the λmax (from 560 nm to 566 nm) was seen (Fig. 5A). Additionally, the DPcal of the supramolecular polymer [M1·Zn(OTf)2]n could be visually distinguished due to changes in the color of the solutions (Fig. 5B). Over the DPcal range of 16.9 to 26.7, the fluorescent color of the solutions changed slightly from dark green to green. Then, as the DPcal climbed to 37.8, a yellow fluorescence emission was observed, which changed to orange at a DPcal of 46.3, a color that deepened as the DPcal further increased to 84.5.
Fig. 5.
Relationship between λmax and DPcal. (A) Table and (B) plot of the corresponding dependent correlation between λmax and DPcal.
Preparation of Monomer M1 Solutions.
Given that interactions between M1 monomers that are independent of supramolecular polymer formation may contribute to the observed fluorescence behavior, the above tests were repeated for pure M1 solutions under otherwise identical conditions. As above, an M1 stock solution (1.00 mM) was prepared by dissolving M1 in DMF/H2O (1/4, vol/vol). Standard solutions of M1 (0.04 to 0.90 mM) were then obtained by diluting this stock solution.
Viscosity Studies.
The aggregation of M1 was studied initially via viscosity tests. A double logarithmic plot of specific viscosity versus M1 concentration is shown in SI Appendix, Fig. S22. In contrast to what was seen in the case of the corresponding M1 + Zn(OTf)2 solutions no pronounced changes in the slope were observed as a function of concentration; rather, the specific viscosities increased slowly over the full M1 concentration range, with a slope of 0.151. Of note is that the slope (0.151) in the M1 diagram is relatively close to the slope (0.256) recorded for M1 + Zn(OTf)2 solutions at relatively low concentration (0.04 to 0.20 mM). On this basis, we infer that only small-sized assemblies or nonsupramolecular polymer aggregates are formed from M1 in DMF/H2O (1/4, vol/vol) (64).
SEM, AFM, and LSCM Studies of M1.
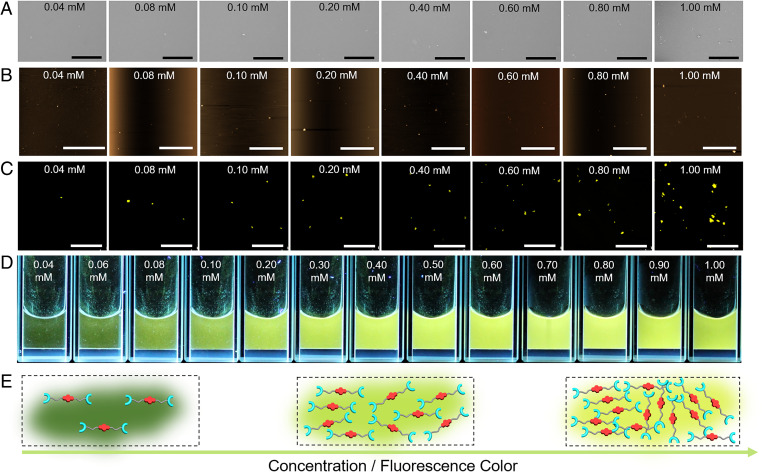
To explore further the aggregation modes of M1 in DMF/H2O (1/4, vol/vol), solutions of M1 were subject to SEM, AFM, and LSCM analysis. In the SEM images (Fig. 6A), tiny particles were seen over the 0.04 mM to 0.10 mM M1 concentration range. The size of these particles was seen to grow gradually as the concentration increased to 1.00 mM; however, no fibrous species were observed. This leads us to suggest that M1 alone does not support the formation of supramolecular polymers. Consistent with this inference, only microsized particles were captured via AFM (Fig. 6B). The resulting LSCM outputs were treated as above to give colored images (Fig. 6D). These analyses revealed (Fig. 6C) that the number and size of the particles increased gradually with increasing M1 concentration; however, no evidence of supramolecular polymer formation was seen. At low concentrations these particles were green in color and became yellow-green color at higher concentrations as seen in the LSCM images. Specifically, no further obvious color transitions were seen in contrast to what was observed for the M1 + Zn(OTf)2 solutions.
Fig. 6.
Morphology, fluorescence behavior, and origin of the M1-derived fluorescence. (A) SEM images, (B) AFM images, and (C) LSCM images of M1 solutions at different concentrations (0.04, 0.08, 0.10, 0.20, 0.40, 0.60, 0.80, and 1.00 mM in DMF/H2O [1/4, vol/vol]). λex = 405 nm. (D) Photographs of M1 solutions (0.04 to 1.00 mM) recorded using a hand-held UV lamp. (E) Cartoon representations showing the various limiting self-assembled form of M1 and the fluorescence color changes expected as the concentration of the monomers is increased. (Scale bars: A, 100 μm; B, 20.0 μm; C, 100 μm.)
Fluorescence Properties of Monomer M1.
The fluorescent colors of M1 solutions at various concentrations were also recorded under UV light. As shown in Fig. 6D and Movie S2, as the M1 concentration was increased from 0.04 mM to 0.10 mM and then to 0.20 mM, the fluorescent color evolved from dark green to green to yellow-green. We thus conclude that at higher concentrations the monomeric form of M1 exists in equilibrium with stacked dimeric structures as illustrated in Fig. 6E. As the relative concentration of dimers increases, the fluorescence color becomes increasing yellow-green. No evidence of the highly aggregated orange emissive form is seen.
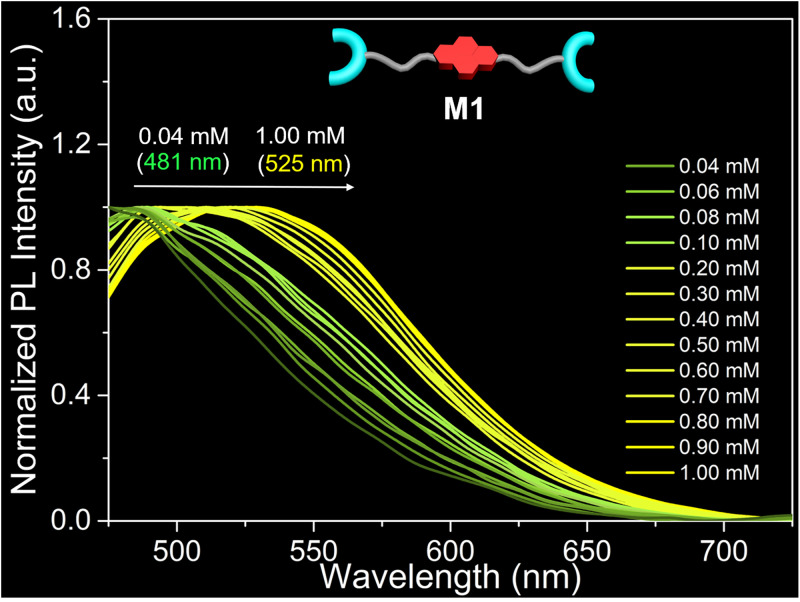
The normalized fluorescence spectra of the M1 solutions were also recorded at various concentrations. As shown in Fig. 7, an increase in the M1 concentration from 0.04 mM to 1.00 mM leads to a shift in the M1 emission maximum from 481 nm to 525 nm. This net 44 nm shift in the λmax is significantly lower than the difference in λmax (85 nm) seen for equimolar solutions of M1 + Zn(OTf)2 as the concentration is similarly increased. Additionally, a yellow-green fluorescence is seen for 0.50 mM to 1.00 mM solutions of M1; in contrast, corresponding solutions of M1 + Zn(OTf)2 are characterized by an orange fluorescence emission. Taken in concert, these results provide support for the suggestion that supramolecular polymerization occurs in the case of M1 + Zn(OTf)2 in DMF/H2O (1/4, vol/vol), but not for solutions of M1 alone.
Fig. 7.
Fluorescence characterization of M1. Normalized fluorescent spectra of solutions of M1 recorded from 0.04 to 1.00 mM in DMF/H2O (1/4, vol/vol) at 298 K. λex = 410 nm. Slit: 10/15.
Anion Responsiveness of [M1·Zn(OTf)2]n.
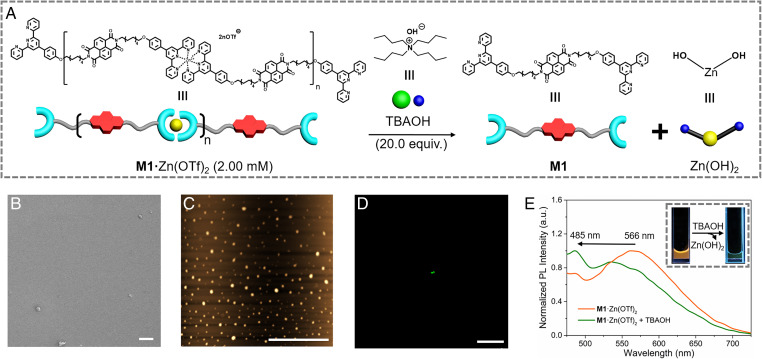
We next sought to test whether the supramolecular polymer [M1·Zn(OTf)2]n would display anion-responsive disaggregation behavior. Since the distinctive fluorescent properties of [M1·Zn(OTf)2]n were attributed to stacked structures involving the NDI groups, it was expected that anion-induced depolymerization, to the extent it occurred, would be reflected in a readily discernible change in the fluorescent properties of the system. To test this proposition, TBAOH was added to preformed solutions [M1·Zn(OTf)2]n. According to previous reports (81), the OH– anion was expected to interact strongly with the Zn2+ cation to form Zn(OH)2 (Fig. 8A), thus breaking up the chelate complexes that provides the stabilization for the supramolecular polymer [M1·Zn(OTf)2]n. Upon addition of 20.0 equiv. of OH– to a 2.00 mM solution of M1 + Zn(OTf)2, only granular species were seen by SEM (Fig. 8B) and AFM (Fig. 8C). Additionally, only green particles were observed in the corresponding LSCM images (Fig. 8D), rather than the orange fibrous species seen for [M1·Zn(OTf)2]n in the absence of TBAOH. Moreover, after adding OH– (20.0 equiv.) to a 2.00 mM solution of M1 + Zn(OTf)2 and removing the precipitate that formed (presumed to be zinc hydroxide), the color of the fluorescent solution changed from orange to green when irradiated with a hand-held UV lamp. Finally, as shown in Fig. 8E, incorporation of TBAOH also provoked a blue shift in the λmax from 566 nm to 485 nm. On the basis of these combined results we conclude that the OH– anion acts as a stimulus that depolymerizes [M1·Zn(OTf)2]n, thereby inducing a readily discernible change in the fluorescent color. This change in color can, in turn, be used to monitor the breakup of the J-aggregates present in the initial supramolecular polymer.
Fig. 8.
Reaction mechanism, morphology, and fluorescence behavior of M1 + Zn(OTf)2 and TBAOH. (A) Cartoon representations of the reaction mechanism between [M1·Zn(OTf)2]n (2.00 mM) and 20.0 equiv. of TBAOH (5.00 mM), both in DMF/H2O (1/4, vol/vol). (B) SEM image, (C) AFM image, and (D) LSCM image of M1 + Zn(OTf)2 in DMF/H2O (1/4, vol/vol) before and after the addition of TBAOH. (E) Normalized fluorescent spectra of M1 + Zn(OTf)2 (2.00 mM) and a mixture M1 + Zn(OTf)2 (2.00 mM) and TBAOH (5.00 mM) at 298 K. λex = 410 nm. (Inset) Photographs of M1 + Zn(OTf)2 in DMF/H2O (1/4, vol/vol) before and after the addition of TBAOH recorded under a hand-held UV lamp. Slit: 10/15. (Scale bars: B, 20.0 μm; C, 20.0 μm; D, 100 μm.)
Conclusion
In conclusion, we present here two supramolecular monomers, a terpyridine modified NDI (M1) and Zn(OTf)2, which can self-assemble into aggregated species driven by the coordination between terpyridine and Zn(OTf)2. The formation of an anion-responsive supramolecular polymer. [M1·Zn(OTf)2]n, at higher concentrations was inferred on the basis of UV-vis spectroscopic titrations, as well as viscosity, SEM, AFM, and LSCM studies. Based on theoretical estimates, an increase in monomer concentration from 0.08 mM to 2.00 mM was expected to lead to an increase in the DPcal from 16.9 to 84.5. Over this concentration range, a change in the fluorescent colors from green to yellow to orange, corresponding to a shift in λmax from 481 nm to 566 nm, was observed by experiment. A dependent relationship between DPcal and λmax was established by combining the data for monomer concentration, DPcal, and λmax. As the DPcal increased from 16.9 to 37.8 and then to 84.5, the λmax of M1 + Zn(OTf)2 (as a DMF/H2O (1/4, vol/vol) solution) shifted from 481 (green) to 532 (yellow) and then to 566 nm (orange). These spectral shifts were rationalized in terms of the supramolecular assembly-induced aggregation of NDI groups. With increasing monomer concentration, cyclic species/oligomers were firstly transformed to supramolecular polymers, and then to more fully entangled polymer-containing ensembles. These self-assembly processes, in turn, lead to a reduction in the distance between individual NDI groups, as M1-containing monomers are converted to dimeric forms and then to J-aggregated forms. Conversely, the specific addition of a hydroxide anion source to preformed [M1·Zn(OTf)2]n was found to induce depolymerization and to restore the original fluorescence signature. Finally, the combination of different colors and fluorescence spectral features allowed changes in the DPcal and corresponding differences in the supramolecular polymer molecular weights to be distinguished visually. The present optical-based differentiation strategy is expected to be generalizable and may prove useful in the characterization of supramolecular polymers containing appropriately chosen fluorophores.
Materials and Methods
Full experimental details and procedures for the synthesis of the compounds used in the present study, molecular structures, viscosity studies of M1 + Zn(OTf)2 solutions and M1 solutions, preparation of M1 + Zn(OTf)2 solutions and M1 solutions, and details of the complexation study between 1a and Zn(OTf)2 are described in the SI Appendix.
Supplementary Material
Acknowledgments
X.J. acknowledges funding from the National Natural Science Foundation of China (No. 22001087). X.J. is grateful for support from the Huazhong University of Science and Technology, where he is being supported by Fundamental Research Funds for the Central Universities (grant 2020kfyXJJS013). X.J. also appreciates support from the Open Fund of Hubei Key Laboratory of Material Chemistry and Service Failure, Huazhong University of Science and Technology (2020MCF08). X.J. thanks the Chinese Ministry of Education for an Open Research Fund grant (No. 2021JYBKF01) to the Key Laboratory of Materials Chemistry for Energy Conversion and Storage (HUST). J.L.S. thanks the Robert A. Welch Foundation for Chair support (F-0018).
Footnotes
Reviewers: H.-B.Y., East China Normal University; and Y.Z., Nanyang Technological University.
The authors declare no competing interest.
This article contains supporting information online at https://www.pnas.org/lookup/suppl/doi:10.1073/pnas.2121746119/-/DCSupplemental.
Data Availability
All study data are included in the article and/or supporting information.
References
- 1.Mieras H. J. M. A., Rijn C. F. H. V., Elastic behaviour of low molecular weight polystyrenes. Nature 224, 165–166 (1969). [Google Scholar]
- 2.Charlesby A., Effect of molecular weight on the cross-linking of siloxanes by high-energy radiation. Nature 173, 679–680 (1954). [Google Scholar]
- 3.Patel K., Chikkali S. H., Sivaram S., Ultrahigh molecular weight polyethylene: Catalysis, structure, properties, processing and applications. Prog. Polym. Sci. 109, 101290 (2020). [Google Scholar]
- 4.Deplancke T., Lame O., Rousset F., Seguela R., Vigier G., Mechanisms of chain reentanglement during the sintering of UHMWPE nascent powder: Effect of molecular weight. Macromolecules 48, 5328–5338 (2015). [Google Scholar]
- 5.Kida T., Hiejima Y., Nitta K.-h., Microstructural interpretation of influences of molecular weight on the tensile properties of high-density polyethylene solids using Rheo-Raman spectroscopy. Macromolecules 54, 225–234 (2021). [Google Scholar]
- 6.Brunsveld L., Folmer B. J. B., Meijer E. W., Sijbesma R. P., Supramolecular polymers. Chem. Rev. 101, 4071–4098 (2001). [DOI] [PubMed] [Google Scholar]
- 7.de Greef T. F. A., Meijer E. W., Materials science: Supramolecular polymers. Nature 453, 171–173 (2008). [DOI] [PubMed] [Google Scholar]
- 8.Fouquey C., Lehn J.-M., Levelut A.-M., Molecular recognition directed self-assembly of supramolecular liquid crystalline polymers from complementary chiral components. Adv. Mater. 2, 254–257 (1990). [DOI] [PMC free article] [PubMed] [Google Scholar]
- 9.Rao K. V., et al. , Distinct pathways in “thermally bisignate supramolecular polymerization”: Spectroscopic and computational studies. J. Am. Chem. Soc. 142, 598–605 (2020). [DOI] [PubMed] [Google Scholar]
- 10.Xu L., et al. , Metallacycle-cored supramolecular polymers: Fluorescence tuning by variation of substituents. J. Am. Chem. Soc. 140, 16920–16924 (2018). [DOI] [PMC free article] [PubMed] [Google Scholar]
- 11.Lavrenova A., et al. , Mechano- and thermoresponsive photoluminescent supramolecular polymer. J. Am. Chem. Soc. 139, 4302–4305 (2017). [DOI] [PubMed] [Google Scholar]
- 12.Kuad P., Miyawaki A., Takashima Y., Yamaguchi H., Harada A., External stimulus-responsive supramolecular structures formed by a stilbene cyclodextrin dimer. J. Am. Chem. Soc. 129, 12630–12631 (2007). [DOI] [PubMed] [Google Scholar]
- 13.Wei P., Yan X., Huang F., Supramolecular polymers constructed by orthogonal self-assembly based on host-guest and metal-ligand interactions. Chem. Soc. Rev. 44, 815–832 (2015). [DOI] [PubMed] [Google Scholar]
- 14.Dong S., Zheng B., Wang F., Huang F., Supramolecular polymers constructed from macrocycle-based host-guest molecular recognition motifs. Acc. Chem. Res. 47, 1982–1994 (2014). [DOI] [PubMed] [Google Scholar]
- 15.Han Y., Tian Y., Li Z., Wang F., Donor-acceptor-type supramolecular polymers on the basis of preorganized molecular tweezers/guest complexation. Chem. Soc. Rev. 47, 5165–5176 (2018). [DOI] [PubMed] [Google Scholar]
- 16.Wang L., et al. , A self-cross-linking supramolecular polymer network enabled by crown-ether-based molecular recognition. J. Am. Chem. Soc. 142, 2051–2058 (2020). [DOI] [PubMed] [Google Scholar]
- 17.Li S.-L., Xiao T., Lin C., Wang L., Advanced supramolecular polymers constructed by orthogonal self-assembly. Chem. Soc. Rev. 41, 5950–5968 (2012). [DOI] [PubMed] [Google Scholar]
- 18.Li B., He T., Shen X., Tang D., Yin S., Fluorescent supramolecular polymers with aggregation induced emission properties. Polym. Chem. 10, 796–818 (2019). [Google Scholar]
- 19.Li Z.-Y., et al. , Cross-linked supramolecular polymer gels constructed from discrete multi-pillar[5]arene metallacycles and their multiple stimuli-responsive behavior. J. Am. Chem. Soc. 136, 8577–8589 (2014). [DOI] [PubMed] [Google Scholar]
- 20.Gong H.-Y., et al. , Environmentally responsive threading, dethreading, and fixation of anion-induced pseudorotaxanes. J. Am. Chem. Soc. 133, 1526–1533 (2011). [DOI] [PubMed] [Google Scholar]
- 21.Qin B., et al. , Supramolecular interfacial polymerization: A controllable method of fabricating supramolecular polymeric materials. Angew. Chem. Int. Ed. Engl. 56, 7639–7643 (2017). [DOI] [PMC free article] [PubMed] [Google Scholar]
- 22.Zhu Y., Zheng W., Wang W., Yang H.-B., When polymerization meets coordination-driven self-assembly: Metallo-supramolecular polymers based on supramolecular coordination complexes. Chem. Soc. Rev. 50, 7395–7417 (2021). [DOI] [PubMed] [Google Scholar]
- 23.Xing P., et al. , Occurrence of chiral nanostructures induced by multiple hydrogen bonds. J. Am. Chem. Soc. 141, 9946–9954 (2019). [DOI] [PubMed] [Google Scholar]
- 24.Todd E. M., Zimmerman S. C., Supramolecular star polymers. Increased molecular weight with decreased polydispersity through self-assembly. J. Am. Chem. Soc. 129, 14534–14535 (2007). [DOI] [PubMed] [Google Scholar]
- 25.Wang X., et al. , Cooperative supramolecular polymerization of fluorescent platinum acetylides for optical waveguide applications. Angew. Chem. Int. Ed. Engl. 56, 12466–12470 (2017). [DOI] [PubMed] [Google Scholar]
- 26.Yan X., et al. , Responsive supramolecular polymer metallogel constructed by orthogonal coordination-driven self-assembly and host/guest interactions. J. Am. Chem. Soc. 136, 4460–4463 (2014). [DOI] [PubMed] [Google Scholar]
- 27.He Q., Tu P., Sessler J. L., Supramolecular chemistry of anionic dimers, trimers, tetramers, and clusters. Chem 4, 46–93 (2018). [DOI] [PMC free article] [PubMed] [Google Scholar]
- 28.Ji X., Chi X., Ahmed M., Long L., Sessler J. L., Soft materials constructed using calix[4]pyrrole- and “texas-sized” box-based anion receptors. Acc. Chem. Res. 52, 1915–1927 (2019). [DOI] [PubMed] [Google Scholar]
- 29.Silver E. S., Rambo B. M., Bielawski C. W., Sessler J. L., Reversible anion-induced cross-linking of well-defined calix[4]pyrrole-containing copolymers. J. Am. Chem. Soc. 136, 2252–2255 (2014). [DOI] [PubMed] [Google Scholar]
- 30.Wang H., et al. , Constraining homo- and heteroanion dimers in ultraclose proximity within a self-assembled hexacationic cage. J. Am. Chem. Soc. 142, 20182–20190 (2020). [DOI] [PubMed] [Google Scholar]
- 31.Zhang Z., et al. , Expanded porphyrin-anion supramolecular assemblies: Environmentally responsive sensors for organic solvents and anions. J. Am. Chem. Soc. 137, 7769–7774 (2015). [DOI] [PubMed] [Google Scholar]
- 32.Chen W., et al. , Molecular cursor caliper: A fluorescent sensor for dicarboxylate dianions. J. Am. Chem. Soc. 141, 14798–14806 (2019). [DOI] [PubMed] [Google Scholar]
- 33.Wang F., et al. , Self-assembled cagelike receptor that binds biologically relevant dicarboxylic acids via proton-coupled anion recognition. J. Am. Chem. Soc. 142, 1987–1994 (2020). [DOI] [PMC free article] [PubMed] [Google Scholar]
- 34.Yang J., et al. , Excimer disaggregation enhanced emission: A fluorescence “turn-on” approach to oxoanion recognition. J. Am. Chem. Soc. 141, 4597–4612 (2019). [DOI] [PubMed] [Google Scholar]
- 35.Ji X., et al. , Physical removal of anions from aqueous media by means of a macrocycle-containing polymeric network. J. Am. Chem. Soc. 140, 2777–2780 (2018). [DOI] [PubMed] [Google Scholar]
- 36.Peng S., et al. , Strapped calix[4]pyrroles: From syntheses to applications. Chem. Soc. Rev. 49, 865–907 (2020). [DOI] [PubMed] [Google Scholar]
- 37.Busschaert N., Caltagirone C., Van Rossom W., Gale P. A., Applications of supramolecular anion recognition. Chem. Rev. 115, 8038–8155 (2015). [DOI] [PubMed] [Google Scholar]
- 38.Molina P., Zapata F., Caballero A., Anion recognition strategies based on combined noncovalent interactions. Chem. Rev. 117, 9907–9972 (2017). [DOI] [PubMed] [Google Scholar]
- 39.Chen W., et al. , β-Cyclodextrin modified Pt(II) metallacycle-based supramolecular hyperbranched polymer assemblies for DOX delivery to liver cancer cells. Proc. Natl. Acad. Sci. U.S.A. 117, 30942–30948 (2020). [DOI] [PMC free article] [PubMed] [Google Scholar]
- 40.Liu G., et al. , Controlling supramolecular chirality of two-component hydrogels by J- and H-aggregation of building blocks. J. Am. Chem. Soc. 140, 6467–6473 (2018). [DOI] [PubMed] [Google Scholar]
- 41.Liu G., et al. , Control on dimensions and supramolecular chirality of self-assemblies through light and metal ions. J. Am. Chem. Soc. 140, 16275–16283 (2018). [DOI] [PubMed] [Google Scholar]
- 42.Cai J., Sessler J. L., Neutral CH and cationic CH donor groups as anion receptors. Chem. Soc. Rev. 43, 6198–6213 (2014). [DOI] [PubMed] [Google Scholar]
- 43.Winter A., Schubert U. S., Synthesis and characterization of metallo-supramolecular polymers. Chem. Soc. Rev. 45, 5311–5357 (2016). [DOI] [PubMed] [Google Scholar]
- 44.Yang L., Tan X., Wang Z., Zhang X., Supramolecular polymers: Historical development, preparation, characterization, and functions. Chem. Rev. 115, 7196–7239 (2015). [DOI] [PubMed] [Google Scholar]
- 45.Liu Y., Wang Z., Zhang X., Characterization of supramolecular polymers. Chem. Soc. Rev. 41, 5922–5932 (2012). [DOI] [PubMed] [Google Scholar]
- 46.Martin R. B., Comparisons of indefinite self-association models. Chem. Rev. 96, 3043–3064 (1996). [DOI] [PubMed] [Google Scholar]
- 47.Cates M. E., Reptation of living polymers: Dynamics of entangled polymers in the presence of reversible chain-scission reactions. Macromolecules 20, 2289–2296 (1987). [Google Scholar]
- 48.Abed S., Boileau S., Bouteiller L., Supramolecular association of acid terminated polydimethylsiloxanes. 3. Viscosimetric study. Polymer (Guildf.) 42, 8613–8619 (2001). [Google Scholar]
- 49.Sijbesma R. P., et al. , Reversible polymers formed from self-complementary monomers using quadruple hydrogen bonding. Science 278, 1601–1604 (1997). [DOI] [PubMed] [Google Scholar]
- 50.Miyauchi M., Takashima Y., Yamaguchi H., Harada A., Chiral supramolecular polymers formed by host-guest interactions. J. Am. Chem. Soc. 127, 2984–2989 (2005). [DOI] [PubMed] [Google Scholar]
- 51.Hasegawa Y., Miyauchi M., Takashima Y., Yamaguchi H., Harada A., Supramolecular polymers formed from β-cyclodextrins dimer linked by poly(ethylene glycol) and guest dimers. Macromolecules 38, 3724–3730 (2005). [Google Scholar]
- 52.Huang F., Gibson H. W., A supramolecular poly[3]pseudorotaxane by self-assembly of a homoditopic cylindrical bis(crown ether) host and a bisparaquat derivative. Chem. Commun. (Camb.) 2005, 1696–1698 (2005). [DOI] [PubMed] [Google Scholar]
- 53.Huang F., Gibson H. W., Formation of a supramolecular hyperbranched polymer from self-organization of an AB2 monomer containing a crown ether and two paraquat moieties. J. Am. Chem. Soc. 126, 14738–14739 (2004). [DOI] [PubMed] [Google Scholar]
- 54.Gibson H. W., Yamaguchi N., Jones J. W., Supramolecular pseudorotaxane polymers from complementary pairs of homoditopic molecules. J. Am. Chem. Soc. 125, 3522–3533 (2003). [DOI] [PubMed] [Google Scholar]
- 55.Zhang X., Liu C., Wang Z., Force spectroscopy of polymers: Studying on intramolecular and intermolecular interactions in single molecular level. Polymer (Guildf.) 49, 3353–3361 (2008). [Google Scholar]
- 56.Bialas D., Kirchner E., Röhr M. I. S., Würthner F., Perspectives in dye chemistry: A rational approach toward functional materials by understanding the aggregate state. J. Am. Chem. Soc. 143, 4500–4518 (2021). [DOI] [PubMed] [Google Scholar]
- 57.Hecht M., Würthner F., Supramolecularly engineered J-aggregates based on perylene bisimide dyes. Acc. Chem. Res. 54, 642–653 (2021). [DOI] [PubMed] [Google Scholar]
- 58.Chen Z., Lohr A., Saha-Möller C. R., Würthner F., Self-assembled π-stacks of functional dyes in solution: Structural and thermodynamic features. Chem. Soc. Rev. 38, 564–584 (2009). [DOI] [PubMed] [Google Scholar]
- 59.Hestand N. J., Spano F. C., Expanded theory of H- and J-molecular aggregates: The effects of vibronic coupling and intermolecular charge transfer. Chem. Rev. 118, 7069–7163 (2018). [DOI] [PubMed] [Google Scholar]
- 60.Kobaisi M. A., Bhosale S. V., Latham K., Raynor A. M., Bhosale S. V., Functional naphthalene diimides: Synthesis, properties, and applications. Chem. Rev. 116, 11685–11796 (2016). [DOI] [PubMed] [Google Scholar]
- 61.Takai A., et al. , Supramolecular assemblies of ferrocene-hinged naphthalenediimides: Multiple conformational changes in film states. J. Am. Chem. Soc. 138, 11245–11253 (2016). [DOI] [PubMed] [Google Scholar]
- 62.Hong Y., et al. , Fluorogenic Zn(II) and chromogenic Fe(II) sensors based on terpyridine-substituted tetraphenylethenes with aggregation-induced emission characteristics. ACS Appl. Mater. Interfaces 3, 3411–3418 (2011). [DOI] [PubMed] [Google Scholar]
- 63.Zhang Y.-Y., et al. , A highly sensitive multifunctional sensor based on phenylene-acetylene for colorimetric detection of Fe2+ and ratiometric fluorescent detection of Cd2+ and Zn2+. Sens. Actuators B Chem. 273, 1077–1084 (2018). [Google Scholar]
- 64.Singh R., et al. , Optical-switchable energy transfer controlled by multiple-responsive turn-on fluorescence via metal–ligand and host–guest interactions in diarylethene-based [2]pseudo-rotaxane polymers. Mater. Chem. Front. 5, 438–449 (2021). [Google Scholar]
- 65.Thordarson P., Determining association constants from titration experiments in supramolecular chemistry. Chem. Soc. Rev. 40, 1305–1323 (2011). [DOI] [PubMed] [Google Scholar]
- 66.Dobrawa R., Lysetska M., Ballester P., Grüne M., Würthner F., Fluorescent supramolecular polymers: Metal directed self-assembly of perylene bisimide building blocks. Macromolecules 38, 1315–1325 (2005). [Google Scholar]
- 67.Benesi H. A., Hildebrand J. H., A spectrophotometric investigation of the interaction of iodine with aromatic hydrocarbons. J. Am. Chem. Soc. 71, 2703–2707 (1949). [Google Scholar]
- 68.Zhang Q., et al. , Self-healing heterometallic supramolecular polymers constructed by hierarchical assembly of triply orthogonal interactions with tunable photophysical properties. J. Am. Chem. Soc. 141, 17909–17917 (2019). [DOI] [PMC free article] [PubMed] [Google Scholar]
- 69.Ji X., et al. , pH-responsive supramolecular polymerization in aqueous media driven by electrostatic attraction-enhanced crown ether-based molecular recognition. Macromol. Rapid Commun. 33, 1197–1202 (2012). [DOI] [PubMed] [Google Scholar]
- 70.Ding Y., Wang P., Tian Y.-K., Tian Y.-J., Wang F., Formation of stimuli-responsive supramolecular polymeric assemblies via orthogonal metal-ligand and host-guest interactions. Chem. Commun. (Camb.) 49, 5951–5953 (2013). [DOI] [PubMed] [Google Scholar]
- 71.Tian Y.-K., Chen L., Tian Y.-J., Wang X.-Y., Wang F., Controlled formation of a supramolecular polymer network driven by heterometallic coordination interactions. Polym. Chem. 4, 453–457 (2013). [Google Scholar]
- 72.Kumar A., Bawa S., Ganorkar K., Ghosh S. K., Bandyopadhyay A., Syntheses, characterization, multi-acid fluorescence sensing and electroluminescence properties of Cr(II)-based metallopolymers. Polym. Chem. 11, 6579–6590 (2020). [Google Scholar]
- 73.Frank A., et al. , Hierarchical superstructures by combining crystallization-driven and molecular self-assembly. Angew. Chem. Int. Ed. Engl. 60, 21767–21771 (2021). [DOI] [PMC free article] [PubMed] [Google Scholar]
- 74.Venkata Rao K., Miyajima D., Nihonyanagi A., Aida T., Thermally bisignate supramolecular polymerization. Nat. Chem. 9, 1133–1139 (2017). [DOI] [PubMed] [Google Scholar]
- 75.Fukushima T., et al. , Diarylethene-powered light-induced folding of supramolecular polymers. J. Am. Chem. Soc. 143, 5845–5854 (2021). [DOI] [PubMed] [Google Scholar]
- 76.Bäumer N., et al. , Tuning energy landscapes and metal-metal interactions in supramolecular polymers regulated by coordination geometry. Chem. Sci. (Camb.) 12, 5236–5245 (2021). [DOI] [PMC free article] [PubMed] [Google Scholar]
- 77.Hudson Z. M., Lunn D. J., Winnik M. A., Manners I., Colour-tunable fluorescent multiblock micelles. Nat. Commun. 5, 3372 (2014). [DOI] [PubMed] [Google Scholar]
- 78.Aliprandi A., Mauro M., De Cola L., Controlling and imaging biomimetic self-assembly. Nat. Chem. 8, 10–15 (2016). [DOI] [PubMed] [Google Scholar]
- 79.Dehm V., et al. , Helical growth of semiconducting columnar dye assemblies based on chiral perylene bisimides. Org. Lett. 9, 1085–1088 (2007). [DOI] [PubMed] [Google Scholar]
- 80.Price J., Balónová B., Blight B. A., Eisler S., Shedding light on predicting and controlling emission chromaticity in multicomponent photoluminescent systems. Chem. Sci. (Camb.) 12, 12092–12097 (2021). [DOI] [PMC free article] [PubMed] [Google Scholar]
- 81.Gruber B., Kataev E., Aschenbrenner J., Stadlbauer S., König B., Vesicles and micelles from amphiphilic zinc(II)-cyclen complexes as highly potent promoters of hydrolytic DNA cleavage. J. Am. Chem. Soc. 133, 20704–20707 (2011). [DOI] [PubMed] [Google Scholar]
Associated Data
This section collects any data citations, data availability statements, or supplementary materials included in this article.
Supplementary Materials
Data Availability Statement
All study data are included in the article and/or supporting information.


