Abstract
Gas explosion accidents are one of the most severe coal mine disasters. Usually, they can cause considerable property losses and casualties, which seriously restrict the development of the coal mining industry. This study used Ansys/Fluent software to simulate gas explosions in excavation roadways with different cavity structures, and 11 models with different cavity structures were established. The study results show that the propagation law of gas explosion in an excavation roadway with different cavity structures was affected by the cavity shapes, the oval cavity of the long axis/short axis ratio (LA/SA), and the cavity numbers. The overpressure, impulse, and flame speed decreased when a cavity existed, compared to the values in a tube without a cavity. The values of overpressure, impulse, and flame speed were smallest in a rectangular cavity. Furthermore, with increasing the LA/SA, the strength of the gas explosion was reduced significantly. The more the cavities were, the better the intensity of gas explosions was controlled. The research results can provide theoretical support and an experimental basis for preventing and controlling gas explosion accidents.
1. Introduction
Coal is an essential primary energy and industrial raw material. Global energy consumption continued to rise until 2019.1 Due to COVID-19, primary energy consumption has fallen by 4.5%, but that in China still has increased by 2.1%. Coal consumption still dominates the energy structure of China2−5 and has mined 353.2 million tons of coal during production, accounting for 45.6% of the global production in 2020, and it is the world’s largest coal producer. More than 90% of the coal is underground-mined.6−8 Coal and gas outbursts, rock bursts, gas explosions, and other dynamic disasters become more severe as the mining depth gradually extends. After the gas gushes out, the gas concentration in the surrounding environment will increase.9 An explosion occurs when the gas concentration reaches the explosion critical concentration.10 The amount of gas emissions increases with increasing mining depth, which increases the possibility of explosion accidents.11 The main dynamic disasters caused during gas explosion include high temperature and shock waves, which can cause severe casualties and property losses.12
In recent years, many scholars at home and abroad have researched gas/air mixture explosion characteristics, mainly focusing on the change propagation of shock waves and flame waves after explosions. Some effect factors have been investigated, including obstacles, gas concentration, initial temperature and pressure, different structures, ignition energy, and so forth. Wang et al.13 investigated the internal mechanisms of the overpressure and flame changes by conducting experiments and numerical simulations. The results illustrated that this particular phenomenon is closely related to combustion instability. Kim et al.14 described that the flame development instability was affected by the Markstein number (Ma) and the thermal behavior. The experiments obtained the laws of self-acceleration and self-similarity of flame propagation during a large-scale gas explosion. Furthermore, there are many reviews and references on the obstacles that affect explosions, including solid obstacles and flexible obstacles. The ventilators, transportation equipment, and power supply equipment used in the production process of coal mines can all be regarded as obstacles. Li et al.15−20 studied the influence of obstacles on the propagation law of gas explosions and obtained the influence mechanism of the number, shape, and blocking rate of different obstacles on the propagation of an explosion. Gao et al.21−23 proved that flexible obstacles could also promote the development of flames and shock waves, but the degree of promotion is not as strong as that of solid obstacles.
Explosion mechanisms have been explored to estimate the influence of gas concentration on gas explosions. Ma24 simulated the alternation of the maximum explosion overpressure under different concentration conditions based on Fluent software. The results showed that the maximum explosion overpressure increases in the earlier stage and decreases in the later stage in gas explosion concentration limits. Li et al.25 proved that the peak overpressure of low-concentration gas explosions in a tube had a quadratic function relationship with the propagation distance. Moreover, the peak overpressure of the gas explosion initially decreases as we move away from the explosion source. Gao et al.26 experimentally and numerically investigated the effect of a very low gas concentration on a gas explosion using OpenFOAM. The results clarified how a very low gas concentration affected the gas explosion law.
Uncertainty about the roadway structure and potential hazards in the wake of an explosion severely hampers emergency responses. Rescue is challenging and may cause additional casualties. In the explosions of Babao Coal Mine in 2013, 17 rescuers were killed by the secondary explosion after entering the coal mines.27 In the Pike River disaster in New Zealand in 2010, the mine was finally closed without rescue as the underground situation is unknown.28 These tragedies strongly demonstrated the need to study methane–air explosions in large-scale roadways with different structures for safety. Li et al. uncovered the influence of the complex structure of underground coal mines on the flame and shock waves of gas explosions.29−32 Critical parameters such as the peak overpressure (Pmax), time of maximum peak overpressure (tmax), maximum pressure rise rate ((dp/dt)max), and gas deflagration index (KG) are the main focus of the quantitative description of the explosion hazard and closely associated with flame propagation characteristics. The results illustrate that the initial temperature,33−36 pressure,37,38 and ignition conditions39,40 affect the flame propagation in confined spaces.
However, little research has been done on the impact of the cavity structure on gas explosions in an excavation roadway. Mu et al.41,42 proposed that the cavity had a significant effect on gas explosion suppression, but the cavity type was single. In addition, the explosion surface mechanism is not intensive and the engineering background of the research is not transparent, resulting in conclusions that are not universal. There is little research on gas explosions in structures with cavities, and there are few corresponding numerically assisted optimization types of research and experimental research. There is almost no ideal shape for an actual mine roadway, but transition sections of different shapes exist. The excavation working face in a coal mine only relies on local ventilation, and usually, the gas concentrations over the low explosion limit are severe. During the excavation, methane in the coal seam overflows (see Figure 1). The locally accumulated gas explodes when it encounters a naked fire, causing gas explosions to frequently occur at the excavation working face. This study focused on the excavation working face with cavity structures, and a small-scale numerical model was established. The propagation law of gas explosions in different cavity structures was analyzed, explaining the effect of the cavity structures on the production mechanism of gas explosions.
Figure 1.
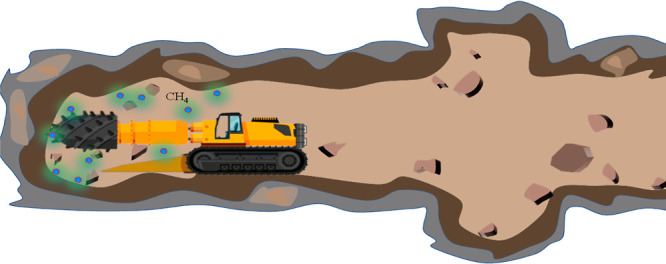
Schematic diagram of actual working conditions.
In this study, inviscid Euler equations used Ansys/Fluent. The LES technique was used for turbulence modeling. A classic gas explosion test was compared to validate the developed numerical model. With the validated model, numerical simulations of gas explosions under different cavity conditions were conducted to determine the influence of the cavity on the excavation roadway. The parameters representing the gas explosion characteristics were analyzed, including the overpressure, maximum overpressure, impulse, gas emission amount, and flame propagation. The results will provide guidelines for loss prediction of gas explosions and also play a significant role in the investigation of gas explosion accidents in coal mines.
2. Results and Discussion
2.1. Propagation Characteristics of Gas Explosions under Different Cavity Shapes
2.1.1. Overpressure Changes under Different Cavity Shapes
The peak overpressure, impulse, and percent of gas emission amount (PGEA) with different cavity shapes (Case1-5) are presented in Figure 2. The peak overpressure values are Pmax Case 1 = 619.65 Pa, Pmax Case 2 = 598.56 Pa, Pmax Case 3 = 779.79 Pa, Pmax Case 4 = 734.72 Pa, and Pmax Case 5 = 597.79 Pa. Impulse was the cumulative effect of explosion pressure on the time scale, and the pressure impulse was calculated according to eq 9, shown in ref (43).
| 2.1 |
Figure 2.
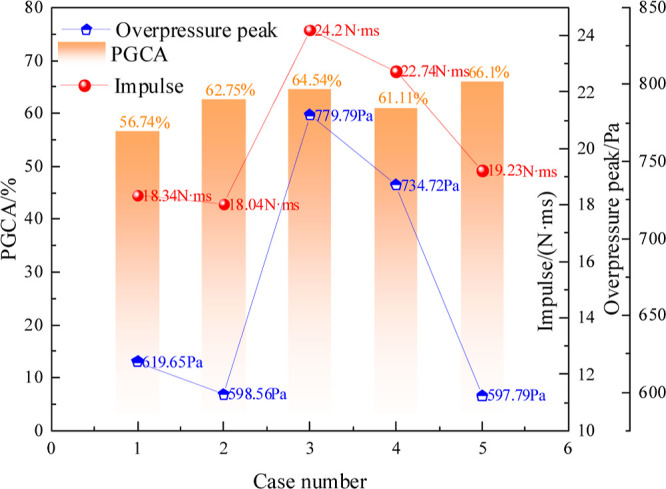
Overpressure, percent of methane emission amount (PGCA), and impulse comparison.
The impulses were ICase 1 = 18.34 N·ms, ICase 2 = 18.04 N·ms, ICase 3 = 24.20 N·ms, ICase 4 = 22.74 N·ms, and ICase 5 = 19.23 N·ms. PGEACase 1 = 56.74%, PGEACase 2 = 62.75%, PGEACase 3 = 64.54%, PGEACase 4 = 61.11%, and PGEACase 5 = 66.1%. The gas explosion parameters, including peak overpressure, impulse, and PGCA, were Pmax Case 6 = 802.18 Pa, ICase6 = 30.01 N·ms, and PGEACase 6 = 75.57%, respectively. The characteristics of the gas explosion mechanism are largely determined by the overpressure, impulse, and PGCA. It can be concluded that the cavity could significantly reduce the intensity of gas explosion. These parameter values vary due to the influence of the cavity shapes. In particular, the value of the explosion characteristic parameter is the smallest in a rectangular cavity in comparison to that in all cavity structures. This proves that the explosion effect of the cavity is better when different cavity structures consume as much methane as possible. The peak overpressure and impulse are still kept small. The amount of initial methane was the same in all cases, but the methane emission had a significant difference after going through different cavity structures. Compared with that without a cavity, the intensity of the gas explosion was reduced when passing through the cavity. In particular, the parameters such as overpressure and impulse in the rectangular cavity were the lowest.
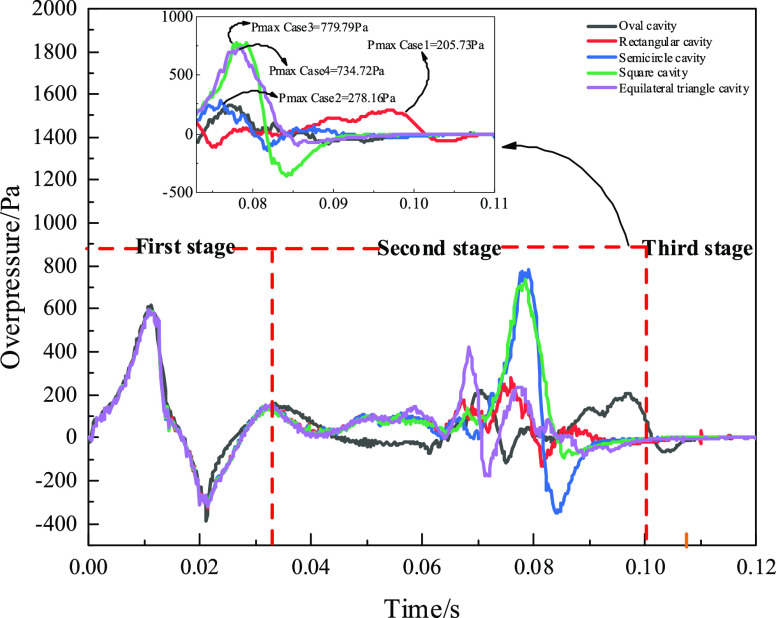
Figure 3 shows that the overpressure–time curve was divided into three stages. The overpressure–time curve was highly consistent in the first stage (0–0.032 s) and the third stage (0.10–0.12 s). The amplitude of the curve oscillation was different in the second stage (0.032–0.10 s). The maximum overpressure was Pmax Case 1 = 205.73 Pa, Pmax Case 2 = 278.16 Pa, Pmax Case 3 = 779.79 Pa, Pmax Case 4 = 734.72 Pa, and Pmax Case 5 = 597.79 Pa in the second stage (0.032–0.10 s). The overpressure of the rectangular, semicircle cavity was approximately 0.26 times that of other structures in the second stage. This is because the shock wave passing by the cavity directly to the monitor was not affected by the cavity in the early stage. Hence, the overpressure curve was highly consistent in the first stage (0–0.032 s). The large difference in overpressure in the second stage was due to cavity effects. In the second stage, the existence of a rectangular cavity showed the smallest overpressure value, Pmax Case 1 = 205.73 Pa. When entering a cavity, the shock wave rapidly expands, dissipates to the sides, and advances toward the exit when the shock wave enters a rectangular cavity. The reflective area of the rectangular cavity is large, and the angle causes the shock wave reflection intensity to increase. Some shock waves are transmitted from the cavity, and the wall surface reflects shock waves. The reflected wave in the cavity reduces the intensity of the shock wave due to repeated reflections. Compared with other cavity structures, on one hand, a rectangular cavity ensures that a large number of shock waves enter the cavity. On the other hand, the shock wave is consumed in the cavity structure. The overpressure, flame intensity, and methane emission amount are the smallest of different shapes. The shock wave is decreased after passing through the cavity structure, and the rectangular cavity especially reduces the shock wave more.
Figure 3.
Overpressure curve of different cavity shapes.
2.1.2. Flame Changes under Different Cavity Shapes
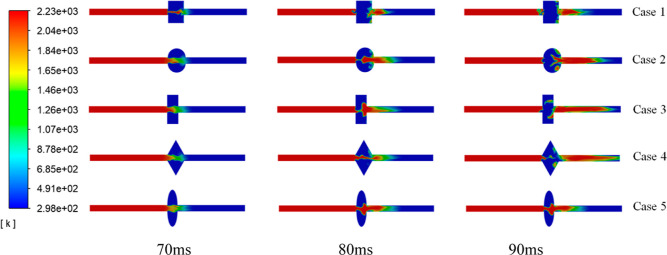
Figure 4 shows the law of flame propagation after gas explosion in different cavity structures in the 0.07–0.09 ms period. The flame propagation speed is significantly reduced in five different cavity structures, compared to that in a straight tube without a cavity structure. The law of flame propagation was analyzed from the flame combustion perspective. The unburnt premixture gas is brought into the cavity when the shock wave enters the cavity. Due to the shock wave reflection and collision in the cavity, a turbulent premixed gas is formed, and an intense explosion occurs. Owing to the shock wave reflection and collision in the cavity, a high-intensity turbulent premixture gas was formed. Afterward, as the flame propagated forward, a strong explosion occurred inside the cavity. In the cavity, the flame vortex falls off during flame propagation. The flame front is stretched by the vortex when passing through the cavity structure. This will enlarge the flame surface and increase the flame burning rate, resulting in a rapid increase in the overpressure. However, enough space is provided in the cavity structure to consume shock waves and flame waves.
Figure 4.
Flame propagation characteristics in different cavity shapes.
The flame propagation speed in the cavity is almost the same in the period of 70–80 ms. As the flame propagates forward, there is a significant difference within 80–90 ms. The flame just came out from the rectangular cavity, but the flame came out in the model in equilateral triangle cavity structures. Compared with other cavity structures, the flame propagation distance in the rectangular was the shortest. In the same time scale, the propagation speed is positively correlated with the flame propagation distance. Therefore, the flame propagation speed is the lowest through the rectangular cavity structure. Part of the pressure wave generated in the rectangular cavity with a 90° angle hits the cavity wall and is reflected to cancel each other, causing the flame speed to decrease. The square cavity also forms a 90° angle with the tube. The flame propagation speed of the square cavity is much faster than that of the rectangular cavity. Because the height of the square cavity is too short, the shock wave amplitude is reduced. The oval and semicircular cavities have more scattered shock waves due to the arc structure, and fewer shock waves are consumed than in other cavity structures. Both will reduce the effect of slowing down the flame speed, and suppression of the explosion will also be weakened.
2.2. Influence of Different Cavity Structures on Gas Explosions
2.2.1. Overpressure Changes for Different Cavity Sizes
Ovals with long axis/short axis (LA/SA) ratios of 3, 2.5, 2.0, and 1.5 were studied to investigate the influence of different cavity sizes on the effect of the gas explosion propagation. Figure 5 shows that the overpressure curves have two peaks, and the overpressures of the LA/SA ratios are not much different. There is little difference in the peak overpressure under the four LA/SA ratios. Therefore, the influence of the cavity size on the characteristic explosion effect can be comprehensively considered from the gas emission amount and impulse. Figure 6 shows that methane emissions and impulses gradually decrease as the length/short diameter ratio decreases. The overpressure and impulse of Case 9 are the smallest with Pmax Case 9 = 596.92 Pa and Imax Case 9 = 18.32 N·ms, respectively.
Figure 5.
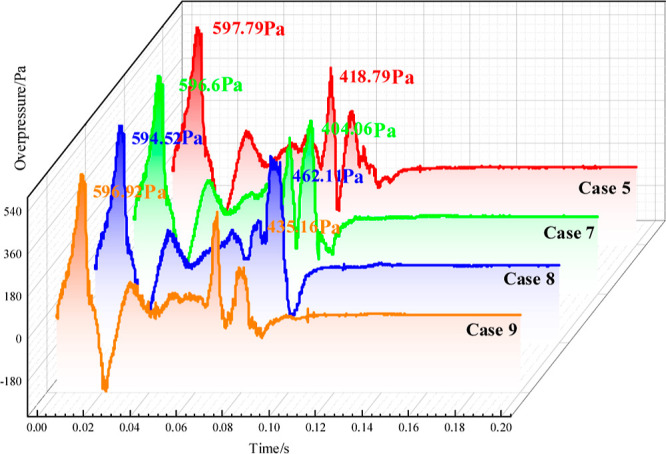
Overpressure–time characteristics for different cavity shapes.
Figure 6.
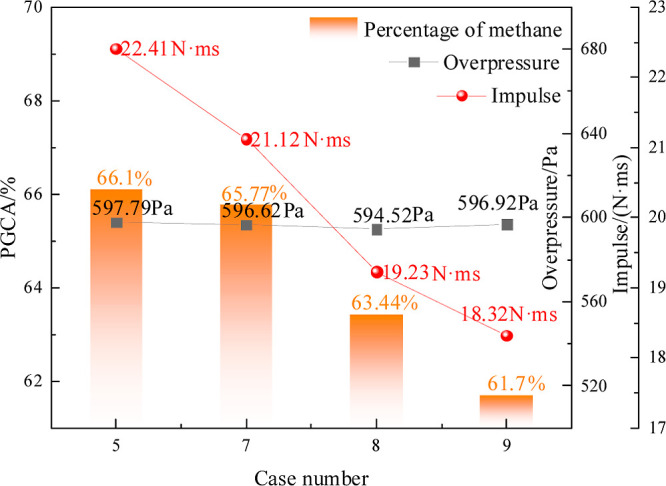
Overpressure, impulse, and PGCA curve.
The principle of a cavity affecting the explosion is that the forward propagation process of the shock wave and flame is blocked at the exit of the cavity wall, and only part of the shock wave and flame propagates into the tube behind the cavity. The shock waves in the cavity are reflected. As the space in the cavity is larger than that of the tube, it provides sufficient space for shock wave oscillation. After the shock wave repeatedly oscillates in the cavity, the intensity of the shock wave transmitted out of the cavity is reduced. With a decrease in LA/SA ratios, the volume of the cavity increases. This can ensure that there are more shock waves in the oval cavity. Moreover, the shock wave in the cavity has a longer reflection time to ensure greater consumption. When the LA/SA ratio is relatively small, the intensity of the shock wave expelled from the cavity is smaller. Therefore, the effect of the cavity on reducing the intensity of the explosion is better, increasing the LA/SA ratios.
2.2.2. Flame Changes for Different Cavity Sizes
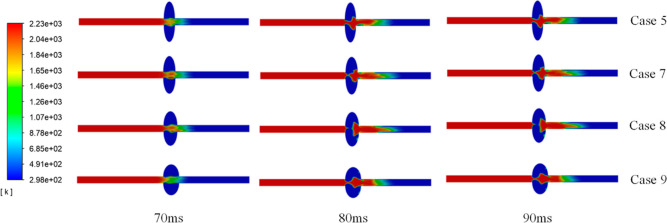
After the premix gas is ignited, the flame propagates forward and enters the cavity structure. Figure 7 shows that a part of the flame is exhausted from the cavity, forming the flame, which is not reflected. The other part is stirred in the cavity and mixed to form a reflected flame. When the flame passes through the cavity, the intensity of the not-reflected flame is reduced due to the disturbing effect of the cavity. Due to the turbulence inside the cavity, the flame burning efficiency is significantly increased. The reflected flame cavity is consumed greatly to facilitate the explosion. More methane participates in the explosion in the cavity. Less methane remains in the entire system to better protect devices. Therefore, the smaller the cavity’s LA/SA ratios are, the smaller the damaging effect on the gas explosion is.
Figure 7.
Flame propagation characteristics in oval cavity tubes.
2.3. Influence of the Number of Cavities on the Gas Explosion
2.3.1. Overpressure Changes under Different Cavity Numbers
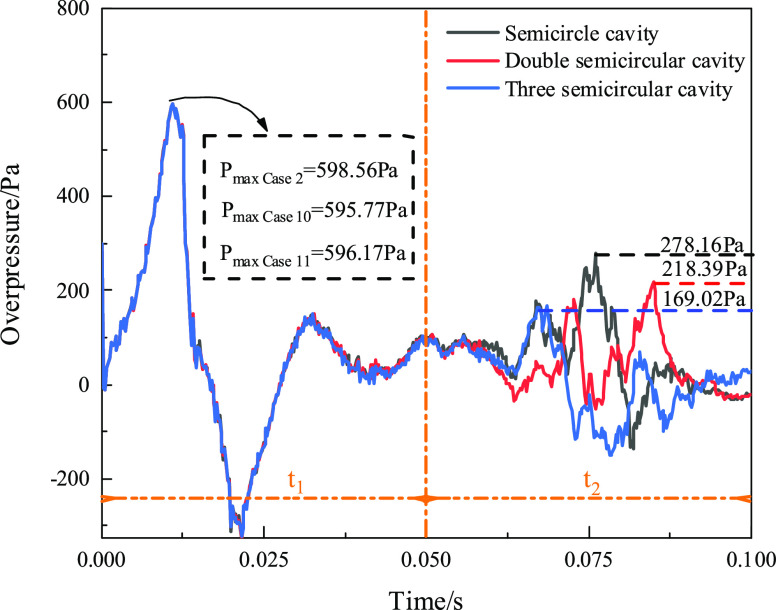
Some models were established with a semicircular cavity, double cavities, and three cavities to study the influence of the cavity number on the gas explosion. Figure 8 shows the change of overpressure in the three cavity structures with time. At 0–50 ms, the three cavities’ overpressure curves in the three kinds of cavity structures almost entirely coincide, and the peaks’ overpressures all appear at approximately 15 ms. The peak overpressure is not significantly different between the three models, Pmax Case 2 = 598.56 Pa, Pmax Case 10 = 595.77 Pa, and Pmax Case 11 = 596.17 Pa severally. The overpressure curve in each cavity is different during 0.05–0.1 ms, and the peak overpressure values in the period are PCase 2 = 278.16 Pa, PCase 10 = 218.39 Pa, and PCase 11 = 169.02 Pa. Furthermore, with an increase in the cavity number, the overpressure curve decreases significantly in the later stage, but it is the opposite in the early stage. The first cavity plays a vital role in the explosion propagation effect. The overpressure curve developed later was suppressed as the number of cavities increased.
Figure 8.
Overpressure–time characteristics in different cavity numbers.
2.3.2. Flame Changes under Different Cavity Numbers
PGEA values from the X = 0.8 m section of the tube to t = 200 ms for Case 2, Case 14, and Case 15 were 62.75, 54.99, and 54.28%, respectively, and the tube without a cavity was at 75.57%. Moreover, because the flame propagation distance is short in the same time, the flame propagation speed in the three cavity structures is slower than that in the tube structure. Figure 9 shows that the flame expands and spreads when it enters the cavity. A part of the flame passes out of the cavity, and the cavity wall reflects a part to form a reverse explosion flame. A reverse explosion flame cannot enter the cavity because the flame is blocked by the cavity wall at the exit of the cavity. Therefore, the flame reflects again and propagates in the direction of the outlet of the cavity. For structures with continuous cavities, the flame from the first cavity enters the next cavity, and a similar process is repeated. The flame is gradually consumed in the cavity structure. Thus, as the number of cavities increases, the explosion intensity is smaller in the entire system.
Figure 9.
Flame propagation characteristics for different cavity numbers.
3. Conclusions
This paper used Ansys/Fluent software to study the gas explosion propagation laws under the influence of cavity shapes, cavity sizes, and cavity numbers based on mine excavation roadways. The cavity structure effect of gas explosions in excavation roadways was analyzed, and the following conclusions were drawn.
-
(1)
The flame exhibits the phenomenon of vortex shedding, and the shock waves are reflected in the cavity. The flame front stretches the vortex, which enlarges the flame surface and increases the burning rate. The shock wave is reflected in the cavity structure and plays a role in wave elimination. A tube with cavities can decrease the intensity of the gas explosion.
-
(2)
The rectangular cavity can decrease, to a greater extent, in the explosion intensity in all cavity structures. When the wall of the cavity is perpendicular to the tube, the flame speed can be slowed down, and the rebound can offset the shock wave to decrease the explosion effect. The rectangular cavity ensures that many shock waves are consumed in the cavity to offset shock waves.
-
(3)
The size of the cavity structure has a more significant impact on the gas explosion intensity. With the decrease in the oval cavity LA/SA ratios, the number of shock waves and flame waves consumed in the cavity increase, and the explosion intensity decreases. A multicavity structure will slow down the flame speed and overpressure compared with the single-cavity structure. The continuous multicavity structure can achieve multiple consumptions of shock waves and flame waves and more effectively reduce the intensity of gas explosions.
4. Numerical Model and Parameter Settings
4.1. Governing Equation
This section details the mathematical equations used to describe the gas explosion process. The process is described by the conservation equation (i.e., conservation of mass, momentum, energy, and chemical species), reaction mechanism equation, and turbulence model equation. There are some assumptions made in the simulation. Single-component methane is used, and only a one-step reaction of methane was considered. Moreover, the gas in the model is an ideal gas. The explosion study ignored the heat exchange between the numerical model and the external environment in the model. The exposition of the governing equations follows.21
4.1.1. Conservation Equation
The motion of a compressible gas explosion flow is governed by the Navier–Stokes equation.
| 4.1 |
which is the statement of the conservation of mass. Here, ρ is the density, kg/m3; t is time, s; ui,j,k is the speed component in i, j, k, m/s; and xi, xj, and xk are the directions.
Here, eq 4.1 must be coupled with the conservation of momentum equation, expressed here as
| 4.2 |
where p is the pressure,
Pa; μ is the dynamic viscosity, N·s/m2; δij is the Kronecker symbol,  ; and gi is the gravity acceleration, m/s2.
The equation for conservation of energy can be expressed as
| 4.3 |
| 4.4 |
where t is the time, s; e is the specific energy, J; and γ is the ratio of specific heats, γ = 5/3.
When the gas participates in the reaction, conservation of mass must be supplemented with an equation for the conservation of chemical species.44,45
 |
4.5 |
where ykis the mass fraction of the species, %; Dkis the diffusion coefficient of species k, m2/s; and ẇk is the rate of production for species k, mol/(L·s).
4.1.2. Reaction Mechanism Equation
The gas emitted from the coal seam may contain 60–95% methane, and other flammable gases are ignored.46 Only a one-step reaction of methane was considered for the gas explosion as follows.
The chemical reaction rate, according to the Arrhenius law, is defined as follows.
| 4.6 |
where A is the pre-exponential
factor, A = 9.76 × 10¹⁴; Ea is the activation energy, Ea = 219.521 J/mol;  is the methane concentration,
vol. %;
  is
the oxygen concentration, vol. %; and R is the universal
gas constant, R = 8.3145
J/(kg·K).
The premixed flame is a reaction wave propagating from burned to unburned gases; the basic parameter of flame is known to be the progress variable (c). In the unburned gas, the progress variable is conventionally put to zero. In the burned gas, it equals unity. The intermediate values describe the progress of the reaction.
The progress variable is defined as a normalized sum of the product species.
| 4.7 |
where c is the progress variable; n is the number of products; Yi is the mass fraction of product species i, %; and Yi,eq is the equilibrium mass fraction of product species i, %. The flame front propagation is modeled by solving a transport equation for the density-weighted mean reaction regress variable denoted.
| 4.8 |
whereSct is the turbulent Schmidt number, Sct = 1; μt is the turbulent viscosity, Pa·s; ρu is the density of the unburnt mixture, kg/m; SL is the laminar flame speed, m/s; and Ξ is the turbulent flame velocity and laminar flame velocity ratio.
| 4.9 |
where ST is the turbulent flame speed, m/s and SLis the laminar flame speed, m/s.
The laminar flame speed has a strong dependence on pressure and temperature. The change in laminar flame speed SL versus initial temperature T0 and pressure p0 could be approximated using a power function with the testing data.
| 4.10 |
where SL,0 is the laminar flame speed with initial parameters, m/s; T0 is the initial temperature, K; P0 is the initial pressure, Pa; and α = 1.612, β = 0.374.
The relationship between the laminar flame speed SL,0 and the stoichiometric methane–air ratio ϕ was calculated.21
| 4.11 |
where ϕ is the stoichiometric methane–air ratio.
4.1.3. Turbulence Model Equation
A gas explosion is a complex, unsteady, and turbulent flow process. It is also a chemical reaction process, and the reaction is closely coupled with the turbulent flow. Reynolds averaging is used to solve the turbulence phenomena. The Navier–Stokes equation is averaged by the ensemble, the turbulent flow in the flow field is decomposed into average motion and pulsating motion, and the Boussinesq assumption is introduced. The turbulence model equation is as follows.
 |
4.12 |
| 4.13 |
| 4.14 |
where k is the turbulence kinetic energy, m2/s2; ε is the turbulent dissertation rate; G is the turbulent kinetic energy generation term; and Cμ = 0.09, C1 = 1.44, C2 = 1.92, σk = 1.0, and σε = 1.3.
The numerical solution is realized using CFD solver ANSYS Fluent, and the whole calculation area adopts the discrete control equation of the finite volume method. The spatial discretization adopts the second-order central difference scheme. The second-order implicit time advancement method is selected to improve the calculation accuracy, and the SIMPLE algorithm is used to decouple the velocity and pressure coupling equations.
4.2. Simulation Initial Condition and Boundary Condition Settings
The surrounding structure is considered to be a wall, and the nonequilibrium wall function is used in simulation. The finite volume method was adopted in the ANSYS Fluent simulation algorithm. Additionally, the inlet diffusion and compressibility effects were considered in the simulation. The simulated wall was designed as a typical nonslip, noninvasive boundary with a closed left end and the right end as the explosive vent. The detailed parameters for the simulation model are included in Table 1.
Table 1. Parameters for the Simulation Model in Simulation Software.
| Initial Conditions | |
| P0 | 101325 Pa |
| T0 | 298.15 K |
| (ui)0 | 0 m/s |
| (uj)0 | 0 m/s |
| (uk)0 | 0 m/s |
| Gas Initial Component Conditions | |
| oxygen in air | 22% |
| nitrogen in air | 78% |
| methane gas mass fraction | 5.3% |
| Progress Variable (C) | |
| ignition area | 1 |
| other areas | 0 |
| Reaction Mechanism Parameters | |
| solver | pressure-based |
| species model | partially premixed combustion |
| out model | pressure outlet |
| time | transient |
| Turbulence Parameters | |
| Cμ | 0.09 |
| C1 | 1.44 |
| C2 | 1.92 |
| σk | 1.0 |
| σε | 1.3 |
| Sct | 1 |
| Reaction Mechanism Parameters | |
| A | 9.76 × 10¹⁴ |
| Ea | 219.521 J/mol |
4.3. Simulation Verification
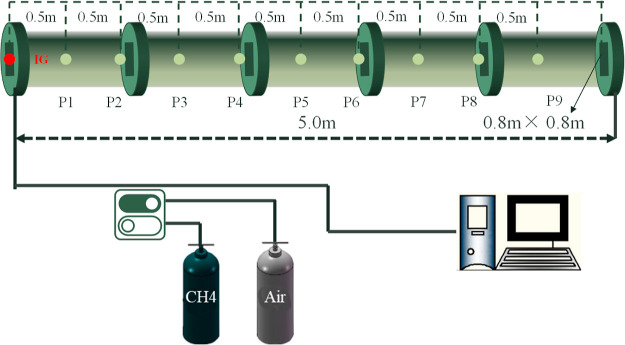
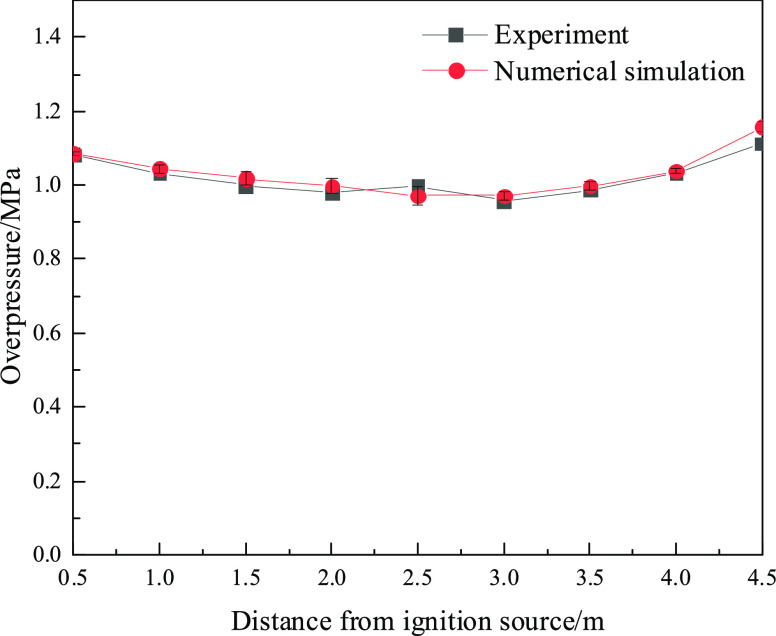
To ensure the accuracy of the numerical model parameters, the experimental data from ref (47) were used to correct the parameters required in the numerical simulation process. The parameters of the numerical study are consistent with the experimental conditions. A 1:1 model with the experimental structure was established (see Figure 10). The length of the experimental tube was 5.0 m with a cross-section of 0.08 m × 0.08 m (0.08 m long by 0.08 m high). The two ends of the tube were closed. The volumetric concentration of methane in the methane/air mixture was approximately 10%. The initial temperature and the initial pressure were 288 K and 101325 Pa, respectively, during the experiments and simulations. Nine pressure sensors were placed along the tube at 0.5 m intervals. Figure 11 shows that the overpressure changing trend of the numerical results is in good agreement with the experimental results.
Figure 10.
Equipment diagram.
Figure 11.
Experimental simulation comparison.
The overpressure changing trend of the numerical results is in good agreement with the experimental results, even though some small deviations in the values were observed (see Figure 11). The relative error between the simulation and experimental results may come from the limitations of the experiments and numerical simulations. First, in the numerical simulation, friction, heat dissipation, and other factors are not considered, making the results of the numerical simulation more ideal than the experimental values. Then, the volume of the constant volume tube used in the pressure simulation is small, and the simulation results have a certain error with the actual experiment. In addition, the pressure sensor has some internal errors that cause the accuracy and sensitivity of the measurement process to decrease. Heat dissipation in the experiment will cause the overpressure value to be smaller than the simulation value. The maximum error between experimental results and numerical simulation is 2.7%, which is within 10%. Zipf et al. proposed that as long as the absolute value of the error between the simulation results and the test results is less than 47%, the results obtained by the numerical simulation can be applied to the project site.48 The maximum error is within the acceptable range so that the model can be used for numerical simulation research. The results obtained using this numerical simulation method can be used to guide actual production.
4.4. Grid Independence Test
To eliminate the influence of the grid size on the numerical simulation results, the appropriate grid size was selected in combination with ref (47) to carry out the grid independence test. In the same experimental model, Jiang et al. used AutoReaGas software to conduct simulations using a grid of 0.02 m × 0.02 m × 0.02 m. Four similar grid sizes are selected in the grid independence test process. The grid sizes are 0.01 m × 0.01 m × 0.01 m, 0.015 m × 0.015 m × 0.015 m, 0.02 m × 0.02 m × 0.02 m, and 0.04 m × 0.04 m × 0.04 m. Table 2 shows that the peak overpressures in the structure were 1.158, 0.62, 0.68, and 0.69 MPa. Compared with other grid sizes, a grid size of 1 cm is more accurate. A grid size of 1 cm was selected in the numerical simulation study.
Table 2. Grid Validation.
| simulation
(grid size) |
|||||
|---|---|---|---|---|---|
| experimental results/MPa | 1 cm | 1.5 cm | 2 cm | 4 cm | |
| Pmax (MPa) | 1.113 | 1.158 | 0.623 | 0.468 | 0.69 |
4.5. Physical Model
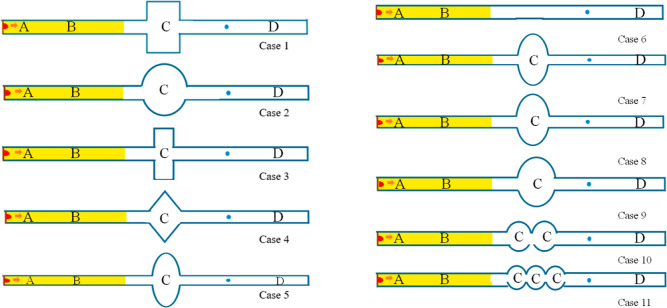
In this study, the actual coal mine excavation working face was used as the engineering background to carry out. There are various chamber structures in coal mines. In this paper, the cavity structure in the model is used to reveal the effect of the underground chamber during the gas explosion. According to the length of use, the chamber structure is divided into permanent and temporary chambers in actual coal production. The chamber is generally a rectangular structure, and there are also triangular-shaped chambers used to place local ventilators. Due to the high mine pressure in some coal mines, which leads to the stress concentration in the corners, some chambers become similar to circular structures. A total of 11 cavity structures, Case 1–Case 11, were selected for research based on the actual working conditions in coal mines. The effects of the cavity structure, cavity size, and cavity number on the gas explosion were studied. The principle of similarity was followed during the numerical simulation, and the rectangular tube with a cavity structure was established (40 mm × 40 mm × 1000 mm) and had an open right end. The different cavities were set to 0.5 m away from the ignition source. The methane/air mixture was ignited at the center of the left end. The monitor (X = 0.8 m) behind the cavity was set to investigate the gas explosion effect when the cavity structure existed. The grid was 0.01 m × 0.01 m × 0.01 m. The effect of the multiscale cavity structure on the explosion overpressure, impulse, and flame propagation was developed and carried out using verified numerical models. Detailed information on the simulation examples is shown in Tables 3 and 4 and in Figure 12.
Table 3. Parametric Simulation Details of the Different Cavity Structuresa.
| category | case no. | cavity shapes | cavity size/mm | cavity number |
|---|---|---|---|---|
| category 1 | 1 | rectangular cavity | 50 × 100 | 1 |
| cavity shapes | 2 | semicircle cavity | φ = 112.84 | 1 |
| 3 | square cavity | 70.71 × 70.71 | 1 | |
| 4 | equilateral triangle cavity | 107 | 1 | |
| 5 | oval cavity (LA/SA = 2.0) | 195.44 × 65.14 | 1 | |
| 6 | tube | 40 × 40×1000 | 0 | |
| category 2 | 7 | oval cavity (LA/SA = 3.0) | 178.42 × 71.36 | 1 |
| cavity sizes | 8 | oval cavity (LA/SA = 2.5) | 159.58 × 79.78 | 1 |
| 9 | oval cavity (LA/SA = 1.5) | 138.20 × 92.14 | 1 | |
| category 3 | 10 | double semicircle cavity | φ = 112.84 | 2 |
| cavity numbers | 11 | three semicircle cavity | φ = 112.84 | 3 |
(1) Category 1 (cavity shapes): the shapes of the cavities were rectangular (50 mm × 100 mm, 100 mm long by 50 mm high), semicircle (φ = 112.84 mm, with a diameter of 112.84 mm), square (70.71 mm × 70.71 mm, 70.71 mm long by 70.71 mm high), equilateral triangle (three sides are 107 mm long), and oval (195.44 mm × 65.14 mm, long and short axis ratio = 2.0, 65.14 mm long by 195.44 mm high). (2) Category 2 (cavity sizes): Based on the oval cavity, the ratios of the long axis and short axis of the oval were established to be 3.0, 2.5, 2.0, and 1.5. The dimensions of case 5, case 7, case 8, and case 9 were 195.44 mm × 65.14 mm (LA/SA = 3, 65.14 mm long by 195.44 mm high), 178.42 mm × 71.36 mm (LA/SA = 2.5, 71.36 mm long by 178.42 mm high), 159.58 mm × 79.78 mm (LA/SA = 2.0, 79.78 mm long by 159.58 mm high), and 78.42 mm × 71.36 mm (LA/SA = 1.5, 71.36 mm long by 78.42 mm high), respectively. (3) Category 3 (cavity numbers): the semicircle cavity, double semicircle cavity, and three semicircle cavities were established. The diameter of the cavity was 112.84 mm.
Table 4. Initial Conditions of the Area.
| area | T0 (k) | P0 (P) | v0 (m/s) | C(CH4)0 | C(O2)0 | C(N2)0 | C(CO2)0 | C(CO)0 | C(H2O)0 |
|---|---|---|---|---|---|---|---|---|---|
| ignition area (A) | 298.15 | 101325 | 0 | 0.047 | 0.202 | 0.733 | 0.004 | 0.002 | 0.012 |
| premix gas area (B) | 298.15 | 101325 | 0 | 0.053 | 0.21 | 0.737 | 0 | 0 | |
| cavity area (C) | 298.15 | 101325 | 0 | 0 | 0.233 | 0.767 | 0 | 0 | |
| area without gas (D) | 298.15 | 101325 | 0 | 0 | 0.233 | 0.767 | 0 | 0 |
Figure 12.
Numerical simulation model diagram.
Acknowledgments
This work was financially supported by the National Natural Science Foundation of China (nos. 52074148 and 52104194) and the Scientific Research Fund of Liaoning Provincial Education Department (LJKZ0341).
The authors declare no competing financial interest.
References
- Wang H.; Gu S.; Chen T. Experimental Investigation of the Impact of CO, C2H6, and H2 on the Explosion Characteristics of CH4. ACS Omega 2020, 5, 24684–24692. 10.1021/acsomega.0c03280. [DOI] [PMC free article] [PubMed] [Google Scholar]
- Hu Y.; Peng L.; Li X.; Yao X.; Lin H.; Chi T. A novel evolution tree for analyzing the global energy consumption structure. Energy 2018, 147, 1177–1187. 10.1016/j.energy.2018.01.093. [DOI] [Google Scholar]
- Jiang H.; Bi M.; Gao Z.; Zhang Z.; Gao W. Effect of turbulence intensity on flame propagation and extinction limits of methane/coal dust explosions. Energy 2022, 239, 122246. 10.1016/j.energy.2021.122246. [DOI] [Google Scholar]
- Zanganeh J.; AlZuraiji M.; Moghtaderi B. Capture and mitigation of fugitive methane: examining the characteristics of methane explosions in an explosion chamber connected to a venting duct. Energy Fuels 2020, 34, 645–654. 10.1021/acs.energyfuels.9b02942. [DOI] [Google Scholar]
- Luo Z.; Su Y.; Li R.; Chen X.; Wang T. Effect of inert gas co2 on deflagration pressure of CH4/CO. ACS Omega 2020, 5, 23002–23008. 10.1021/acsomega.0c02686. [DOI] [PMC free article] [PubMed] [Google Scholar]
- Xu Y.; Bu Y.; Liu Z.; Lv Z.; Chen M.; Wang L. Effect of the reignition characteristics on long-flame coal by oxidization and water immersion. Environ. Sci. Pollut. Res. 2021, 28, 57348. 10.1007/s11356-021-13985-5. [DOI] [PubMed] [Google Scholar]
- Ajrash M. J.; Zanganeh J.; Moghtaderi B. The influences of the initial ignition energy on methane explosion in a flame deflagration tube. Energy Fuels 2017, 31, 6422–6434. 10.1021/acs.energyfuels.6b03375. [DOI] [Google Scholar]
- Li A.; Si J.; Zhou X. Experimental research on rapid fire zone sealing and explosion venting characteristics of an explosion venting door using a large-diameter explosion pipeline. ACS Omega 2021, 6, 27536–27545. 10.1021/acsomega.1c04561. [DOI] [PMC free article] [PubMed] [Google Scholar]
- Lu H.; Huang K.; Fu L.; Zhang Z.; Wu S.; Lyu Y.; Zhang X. Study on leakage and ventilation scheme of gas pipeline in tunnel. J. Nat. Gas Sci. Eng. 2018, 53, 347–358. 10.1016/j.jngse.2018.03.019. [DOI] [Google Scholar]
- Lu H.; Iseley T.; Behbahani S.; Fu L. Leakage detection techniques for oil and gas pipelines: State-of-the-art. Tunn. Undergr. Space Technol. 2020, 98, 103249. 10.1016/j.tust.2019.103249. [DOI] [Google Scholar]
- Song S.; Zhou G.; Duan J.; Meng Q.; Sun B.; Wang Y. CFD simulation of multi-phase and multi-component diffusion of air-dust-gas in a fully mechanized mining face. Environ. Sci. Pollut. Res. 2021, 28, 18260–18275. 10.1007/s11356-020-11850-5. [DOI] [PubMed] [Google Scholar]
- Qin Y.; Guo W.; Xu H.; Song Y.; Chen Y.; Ma L. A comprehensive method to prevent top-coal spontaneous combustion utilizing dry ice as a fire extinguishing medium: test apparatus development and field application. Environ. Sci. Pollut. Res. 2021, 31, 1–11. 10.1007/s11356-021-17213-y. [DOI] [PubMed] [Google Scholar]
- Wang S.; Cai Y.; Guo H.; Wu D.; Xie Y. Effect of fuel concentration, inert gas dilutions, inert gas–water mist twin fluid medium dilutions, and end boundary condition on overpressure transients of premixed fuel vapor explosion. Fuel 2022, 309, 122083. 10.1016/j.fuel.2021.122083. [DOI] [Google Scholar]
- Kim W. K.; Mogi T.; Kuwana K.; Dobashi R. Self-similar propagation of expanding spherical flames in large scale gas explosions. Proc. Combust. Inst. 2015, 35, 2051–2058. 10.1016/j.proci.2014.08.023. [DOI] [Google Scholar]
- Wang C.; Cui Y.; Mebarki A.; Cai Y. Effect of a tilted obstacle on the flame propagation of gas explosion in case of low initial pressure. Combust. Sci. Technol. 2021, 193, 2405–2422. 10.1080/00102202.2020.1740689. [DOI] [Google Scholar]
- Huang C.; Chen X.; Liu L.; Zhang H.; Yuan B.; Li Y. The influence of opening shape of obstacles on explosion characteristics of premixed methane-air with concentration gradients. Process Saf. Environ. Protect. 2021, 150, 305–313. 10.1016/j.psep.2021.04.028. [DOI] [Google Scholar]
- Na’inna A. M.; Phylaktou H. N.; Andrews G. E. Influence of Obstacle Shapes in a Tubular Geometry with Two Obstacles of Variable Spacing. J. Fluid Flow Heat Mass Tran. 2021, 8, 93. 10.11159/jffhmt.2021.011. [DOI] [Google Scholar]
- Schiavetti M.; Carcassi M. N. Experimental tests of inhomogeneous hydrogen deflagrations in the presence of obstacles. Int. J. Hydrogen Energy 2021, 46, 12455–12463. 10.1016/j.ijhydene.2020.09.100. [DOI] [Google Scholar]
- Xing H.; Qiu Y.; Sun S.; Wang M.; Li B.; Xie L. Experimental study of overpressure and temperature field behaviors of a methane-air mixture with different ignition positions, solid structure obstacles and initial turbulence levels. Fuel 2021, 287, 119446. 10.1016/j.fuel.2020.119446. [DOI] [Google Scholar]
- Krivosheyev P. N.; Novitski A. O.; Sevrouk K. L.; Penyazkov O. G.; But I. I.; Kasimov A. R. Experimental and Numerical Investigation of Gaseous Detonation in a Narrow Channel with Obstacles. Fluids 2021, 6, 224. 10.3390/fluids6060224. [DOI] [Google Scholar]
- Gao K.; Li S.; Liu Y.; Jia J.; Wang X. Effect of flexible obstacles on gas explosion characteristic in underground coal mine. Process Saf. Environ. Protect. 2021, 149, 362–369. 10.1016/j.psep.2020.11.004. [DOI] [Google Scholar]
- Li Q.; Ciccarelli G.; Sun X.; Lu S.; Wang X.; Zhang Z.; Xu M.; Wang C. Flame propagation across a flexible obstacle in a square cross-section channel. Int. J. Hydrogen Energy 2018, 43, 17480–17491. 10.1016/j.ijhydene.2018.07.077. [DOI] [Google Scholar]
- Choi C. E.; Goodwin G. R. Interaction between granular flows and flexible obstacles: A grain-scale investigation. Comput. Geotech. 2020, 128, 103800. 10.1016/j.compgeo.2020.103800. [DOI] [Google Scholar]
- Ma X. F. Numerical simulation on the influence of flammable gas concentration on explosion peak pressure. Adv. Mater. Res. 2014, 1010–1012, 1531–1534. 10.4028/www.scientific.net/amr.1010-1012.1531. [DOI] [Google Scholar]
- Li L.; Zhang Z.; Liu P.; Wang K.; Zhang J.; Li X. Experimental study of low-concentration gas explosion in large-scale pipeline. Energy Sci. Eng. 2020, 8, 2129–2140. 10.1002/ese3.652. [DOI] [Google Scholar]
- Gao K.; Liu Z.; Wu C.; Li J.; Liu K.; Liu Y.; Li S. Effect of low gas concentration in underground return tunnels on characteristics of gas explosions. Process Saf. Environ. Protect. 2021, 152, 679–691. 10.1016/j.psep.2021.06.045. [DOI] [Google Scholar]
- Zhu Y.; Wang D.; Shao Z.; Xu C.; Zhu X.; Qi X.; Liu F. A statistical analysis of coalmine fires and explosions in China. Process Saf. Environ. Protect. 2019, 121, 357–366. 10.1016/j.psep.2018.11.013. [DOI] [Google Scholar]
- Watts T.Challenges Encountered by New Zealand Mines Rescue at the Pike River Mine Disaster, 2012.
- Li Z.; Chen L.; Yan H.; Fang Q.; Zhang Y.; Xiang H.; Liu Y.; Wang S. Gas explosions of methane-air mixtures in a large-scale tube. Fuel 2021, 285, 119239. 10.1016/j.fuel.2020.119239. [DOI] [Google Scholar]
- Elshimy M.; Ibrahim S.; Malalasekera W. LES–DFSD modelling of vented hydrogen explosions in a small-scale combustion chamber. J. Loss Prev. Process. Ind. 2021, 72, 104580. 10.1016/j.jlp.2021.104580. [DOI] [Google Scholar]
- Gao K.; Li S.-n.; Han R.; Li R.-z.; Liu Z.-m.; Qi Z.-p.; Liu Z.-Y. Study on the propagation law of gas explosion in the space based on the goaf characteristic of coal mine. Saf. Sci. 2020, 127, 104693. 10.1016/j.ssci.2020.104693. [DOI] [Google Scholar]
- Gao K.; Li S.; Su B.; Liu Y.; Wang X.; Shi L. Hole/pore-scale investigation of gas explosions in a coal-mine gob. Process Saf. Environ. Protect. 2021, 156, 531. 10.1016/j.psep.2021.10.020. [DOI] [Google Scholar]
- Nakahara K.; Yoshida A.; Nishioka M. Experiments and numerical simulation on the suppression of explosion of propane/air mixture by water mist. Combust. Flame 2021, 223, 192–201. 10.1016/j.combustflame.2020.09.014. [DOI] [Google Scholar]
- Marcantoni L. F. G.; Elaskar S.; Tamagno J.; Saldía J.; Krause G. An assessment of the OpenFOAM implementation of the KNP scheme to simulate strong explosions. Shock Waves 2021, 31, 193–202. 10.1007/s00193-021-01008-8. [DOI] [Google Scholar]
- Ibrahim Y. A. An experimental investigation on laminar burning velocity of castor bio-diesel blended with gas oil. Biofuels 2021, 12, 449–457. 10.1080/17597269.2018.1493564. [DOI] [Google Scholar]
- Adamski R.; Siuta D.; Kukfisz B.; Mitkowski P. T.; Szaferski W. Influence of process parameters in superheated steam drying on fire and explosion parameters of woody biomass. Fuel Process. Technol. 2021, 211, 106597. 10.1016/j.fuproc.2020.106597. [DOI] [Google Scholar]
- Tran M.; Scribano G.. Explosion Characteristics of Syngas/air Premixed Flames. 8th International Conference on Fluid Flow; FFHMT, 2021.
- Rokhy H.; Mostofi T. M. 3D numerical simulation of the gas detonation forming of aluminum tubes considering fluid-structure interaction and chemical kinetic model. Thin-Walled Struct. 2021, 161, 107469. 10.1016/j.tws.2021.107469. [DOI] [Google Scholar]
- Wang L.-Q.; Ma H.-H.; Shen Z.-W. Effects of vessel height and ignition position upon explosion dynamics of hydrogen-air mixtures in vessels with low asymmetry ratios. Fuel 2021, 289, 119926. 10.1016/j.fuel.2020.119926. [DOI] [Google Scholar]
- Hisken H.; Mauri L.; Atanga G.; Lucas M.; van Wingerden K.; Skjold T.; Quillatre P.; Dutertre A.; Marteau T.; Pekalski A.; Jenney L.; Allason D.; Johnson M.; Leprette E.; Jamois D.; Hébrard J.; Proust C. Assessing the influence of real releases on explosions: Selected results from large-scale experiments. J. Loss Prev. Process. Ind. 2021, 72, 104561. 10.1016/j.jlp.2021.104561. [DOI] [Google Scholar]
- Zhou H.; Mu C. Influence of cavity width and powder filling in a cavity on overpressure evolution laws and flame propagation characteristics of methane/air explosion. ACS Omega 2021, 6, 10072–10084. 10.1021/acsomega.1c00054. [DOI] [PMC free article] [PubMed] [Google Scholar]
- Benjun S.; Chaomin M.; Haifeng M.; Zhenhua J.; Juan Q. Cavity effect on the characteristics of methane blast wave propagation in the whole roadway. J. China Coal Soc. 2020, 46, 9. [Google Scholar]
- Hayasaka K.; Akihito K.; Kiyama K.; Yoshiyuki K.; Tagaw K. Effects of pressure impulse and peak pressure of a shockwave on microjet velocity in a microchannel. Microfluid. Nanofluidics 2017, 21, 166. 10.1007/s10404-017-2004-6. [DOI] [Google Scholar]
- Palmore J.Numerical Framework for Simulating Multiphase Flows with Phase Change. Ph.D. Thesis, 2018. [Google Scholar]
- Karacan C. Ö. Forecasting gob gas venthole production performances using intelligent computing methods for optimum methane control in longwall coal mines. Int. J. Coal Geol. 2009, 79, 131–144. 10.1016/j.coal.2009.07.005. [DOI] [Google Scholar]
- Warnecke G.Analysis and Numerics for Conservation Laws; Springer Berlin Heidelberg, 2005. [Google Scholar]
- Jiang B.; Tang M.; Shi S. Multiparameter acceleration characteristics of premixed methane/air explosion in a semi-confined pipe. J. Loss Prev. Process. Ind. 2017, 49, 139–144. 10.1016/j.jlp.2017.06.012. [DOI] [Google Scholar]
- Zipf R. K.; Sapko M. J.; Brune J. F.. Explosion Pressure Design Criteria for New Seals in US Coal Mines; US Dept. HHS, NIOSH IC: Pittsburgh, 2007; Vol. 9500, p 76. [Google Scholar]


