Abstract
The presence of alkaline phosphatases has been observed in several species and has been known to play a crucial role in various biological functions. Higher expressions of alkaline phosphatase have been found in several multifactorial disorders and cancer patients, which has led it to be an interesting target for drug discovery. A strong structural similarity exists between intestinal alkaline phosphatases (IAPs) and tissue-nonspecific alkaline phosphatases (TNAPs), which has led to the discovery of only a few selective inhibitors. Therefore, a series of 22 derivatives of 6-(chloromethyl)-4-(4-hydroxyphenyl)-2-oxo-1,2,3,4-tetrahydropyrimidine-5-carboxylate (1) and ethyl 6-(chloromethyl)-4-(2-hydroxyphenyl)-2-oxo-1,2,3,4-tetrahydropyrimidine-5-carboxylate (2) were synthesized to evaluate the anticancer potential of these compounds against breast cancer. The compounds were characterized through spectral and elemental analyses. The inhibitory effect of dihydropyrimidinone derivatives on alkaline phosphatases was evaluated using the calf alkaline phosphatase assay. The antioxidant activity of these compounds was performed to study the radical scavenging effect. In silico molecular docking and molecular dynamic simulations were performed to elucidate the binding mode of active compounds. Moreover, the two-dimensional qualitative-structure–activity relationship (2D-QSAR) was performed to study the structural requirements for enzyme inhibition. The calf alkaline phosphatase inhibitory assay revealed significant inhibition of the enzyme by compound 4d with IC50 1.27 μM at 0.1 mM concentration as compared to standard KH2PO4 having IC50 2.80 μM. The compounds 4f, 4e, and 4i also showed very good inhibition with IC50 values of 2.502, 2.943, and 2.132 μM, respectively, at the same concentration. The antioxidant assay revealed efficient radical scavenging activity of compounds 4f, 4e, and 4g at 100 μg/mL with IC50 values of 0.48, 0.61, and 0.75 μg/mL, respectively. The molecular docking and simulation studies revealed efficient binding of active compounds in the active binding site of the target enzyme. The final QSAR equation revealed good predictivity and statistical validation having R2 = 0.958 and Q2 = 0.903, respectively, for the generated model. The compound 4d showed the highest inhibitory activity with stable binding modes acting as a future lead for identifying alkaline phosphatase inhibitors. The molecular simulations suggested the stable binding of this compound, and the QSAR studies revealed the importance of autocorrelated descriptors in the inhibition of alkaline phosphatase. The investigated compounds may serve as potential pharmacophores for potent and selective alkaline phosphatase inhibitors. We intend to further investigate the biological activities of these compounds as alkaline phosphatase inhibitors.
Introduction
The family of ectonucleotidase enzymes consists of an important family of enzymes, namely, alkaline phosphatases (APs), involved in catalyzing various transphosphorylation reactions.1 Alkaline phosphatases are metallo-enzymes having five cysteine residues, one zinc atom, and one magnesium atom that are responsible for their catalytic activity. Alkaline phosphatases, as the name suggests, work in an alkaline medium and dephosphorylate monoesters to ensure normal functioning of cells such as protein phosphorylation, apoptosis, and cellular growth. Several organisms have been found having APs ranging from bacteria to men. In humans, four types of AP isoenzymes have been found, out of which three are considered tissue-specific, while the fourth one is tissue-nonspecific AP (TNAP). The tissue-specific isoenzymes include placental AP (PLAP), intestinal AP (IAP), and germ cell AP (GCAP).2 The tissue-nonspecific isoenzymes are found throughout the body, with the liver, kidney, and bone having the maximum expression maintaining an optimum pyrophosphate level in bone tissues by performing inorganic pyrophosphate (PPi) hydrolysis. The intestinal APs have been found to act as lipopolysaccharide (LPS)-detoxifying enzymes due to their presence in the epithelial linings of the intestine. The overexpression of intestinal APs has been found in various types of disorders such as atheroscelorosis, sepsis, arthritis, multiple sclerosis, and bowel diseases.3 Moreover, the high level of TNAPs and IAPs has also been associated with several types of cancers such as esophageal, breast, prostrate, intestinal, ovarian, and liver cancers.4 The higher expression of AP in cancer patients suggests metastasis to the liver and bone. Elevated levels of IAPs have been found in hepatocellular carcinomas,5 and higher TNAP plasma levels have been found to be associated with osteocarcinomas, breast cancer, and osteoblastic bone metastasis. A strong structural similarity exists between IAPs and TNAPs, which has led to the discovery of only a few selective inhibitors such as theophylline, l-phenylalanine, levamisole, and imidazole.6 Due to the increased plasma levels of APs in cancer patients as well as in several multifactorial disorders, they act as interesting molecular targets for drug discovery.
The structural similarity of pyrimidinones to the bioactive natural products and because of the presence of pyrimidine as a basic nucleus in DNA and RNA, these compounds have been associated with various biological activities.7 The dihydropyrimidinones (DHPMs) have shown several important biological activities such as antibacterial, calcium channel blocking, antihypertensive, anti-inflammatory, and cytotoxic activities.8 This significant nature of dihydropyrimidinones has led to the synthesis of a series of amine-containing dihydropyrimidinones and the evaluation of their biological activities. The in vitro calf intestinal alkaline phosphatase assay was performed to evaluate the inhibitory effect. The in silico molecular docking and molecular dynamic (MD) simulations were performed to analyze the binding mode of these compounds with the target protein. The two-dimensional qualitative-structure–activity relationship (2D-QSAR) studies were also conducted to evaluate the structural requirements of these compounds for AP inhibition.
Results
Chemistry
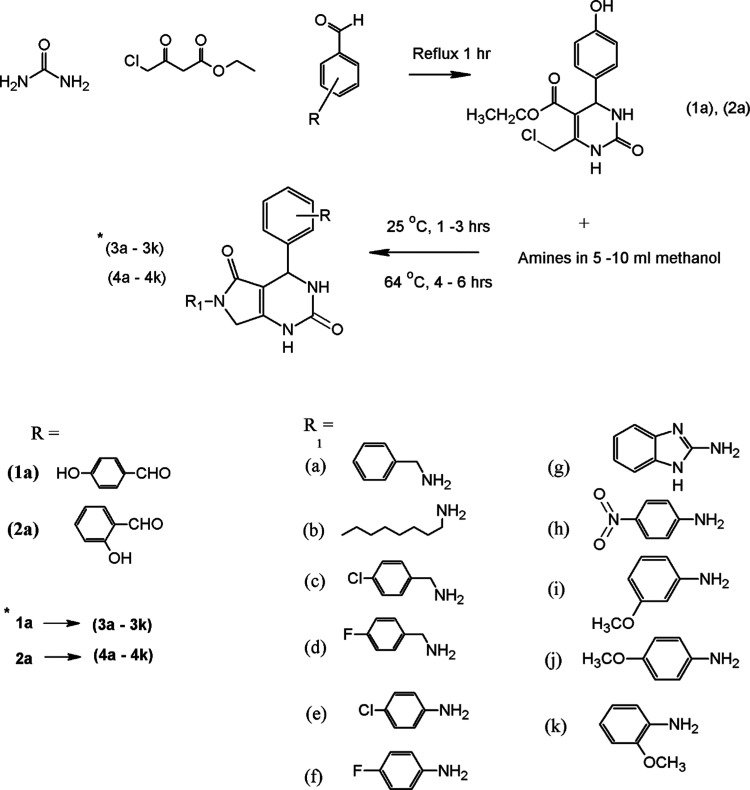
Figure 1 was used to synthesize 22 derivatives of dihydropyrimidinones. 6-Chloromethyl-DHPMs were obtained under a neat reaction of urea, substituted benzaldehyde, and 4-chloroacetoacetate for 1 h under reflux. These compounds were obtained in 72–85% yield after precipitation from water. The resulting compounds were treated with 5–10 mL of methanol benzylamine. The mixture was first refluxed at 25 °C for 1–3 h and then at 64 °C for 5–6 h. The reaction was cooled to ambient temperature and the solid product was filtered and washed with cold methanol to obtain the sample of desired pyrrolopyrimidines. The crystals obtained were then recrystallized in ethanol. The synthesized compounds were purified by column chromatography using petroleum ether/ethyl acetate at a ratio of 4:1 as the eluent. The spectral analysis of these compounds was done using Fourier transform infrared (FTIR), 1H NMR, 13C NMR, and elemental analyses. In FTIR, the presence of the −NH group at 3350 and the aide group at 1680 confirmed the synthesis of compounds (3a to 4k). The 1H NMR showed a singlet at 9.16 ppm, confirming the presence of the −NH group; a singlet of the methylene group at 4.10 and 4.33 ppm and a singlet of the CH group at 5.10 ppm were also observed, indicating the formation of products. Mass spectral analysis of 4f was done using ionization mode electrospray ionization mass spectrometry (EIMS) with the JEOL 600H-1 instrument. Molecular ion peaks were not observed in the spectrum due to expulsion of the CO fragment from the molecular ion. A peak at m/z 311 was observed as a result of this fragmentation. Further expulsion of the C5 H5 moiety from the molecular ion resulted in the base peak at m/z 274. Removal of the p-fluorophenyl moiety from the first fragment resulted in a secondary fragment at m/z 217. Overall, the fragmentation pattern confirmed the structure of the synthesized compound 4f. All of the compounds were screened for in vitro anticancer activity. The in silico molecular docking and QSAR analyses were also performed to evaluate the potential target for breast cancer.
Figure 1.
General scheme for the synthesis of dihydropyrimidinone derivatives.
Alkaline Phosphatase Inhibitory Assay
The potential of synthesized compounds for calf intestinal phosphatase (CIAP) was evaluated. The results are summarized in Table 1. The compound 4d showed the most potent activity with IC50 1.271 μM. The compounds 4e, 4i, and 3f also showed better activities with IC50 values of 2.943, 2.132, and 2.502, respectively. The compounds 4h, 3d, and 3h showed moderate activity having IC50 values of 3.439, 4.768, and 4.167, respectively, while the compounds 3c, 3e, 3k, 4j, and 4f showed low activities. The compounds 3a, 3i, 4c, 4g, and 4k showed no inhibition.
Table 1. Alkaline Phosphatase Inhibitory Activity of Synthesized Compoundsa.
| compound codes | alkaline phosphatase IC50 SEM (μM) |
|---|---|
| 3a | NAb |
| 3b | 8.234 ± 0.265 |
| 3c | 5.356 ± 0.079 |
| 3d | 4.768 ± 0.149 |
| 3e | 6.564 ± 0.210 |
| 3f | 2.502 ± 0.023 |
| 3g | 11.342 ± 0.290 |
| 3h | 4.169 ± 0.154 |
| 3i | NAb |
| 3j | 9.436 ± 0.243 |
| 3k | 6.306 ± 0.179 |
| 4a | 7.678 ± 0.267 |
| 4b | 8.723 ± 0.132 |
| 4c | NAb |
| 4d | 1.271 ± 0.0410 |
| 4e | 2.943 ± 0.121 |
| 4f | 6.543 ± 0.129 |
| 4g | NAb |
| 4h | 3.439 ± 0.139 |
| 4i | 2.132 ± 0.034 |
| 4j | 4.876 ± 0.086 |
| 4k | NAb |
| KH2PO4 | 2.80 ± 0.065 |
Values are presented as mean ± standard error of mean (SEM).
NA - No activity.
Antioxidant Assay
Figure 2 shows the free radical scavenging activity of synthesized compounds. Among all of the compounds, the compound 4f showed the highest percent of inhibition with an IC50 of 0.48 at 100 μg/mL concentration. The compounds 3e and 4g possessed 80% inhibition with IC50 values of 0.61 and 0.75 μg/mL, respectively. The compounds 3g, 4j, and 4h showed approximately 70% inhibition with IC50 values of 1.85, 2.45, and 1.72, respectively. The compounds 3a, 3b, 3f, 3h, 3j, and 4b showed about 60% inhibition with IC50 values of 2.61, 2.6, 2.86, 2.61, 2.48, and 2.731 μg/mL at the same concentration. The compounds 3c, 3d, 3i, 3k, 4c, 4d, 4i, and 4k showed less than 50% inhibition. The standard ascorbic acid showed IC50 of 0.25 μg/mL at 100 μg/mL concentration.
Figure 2.
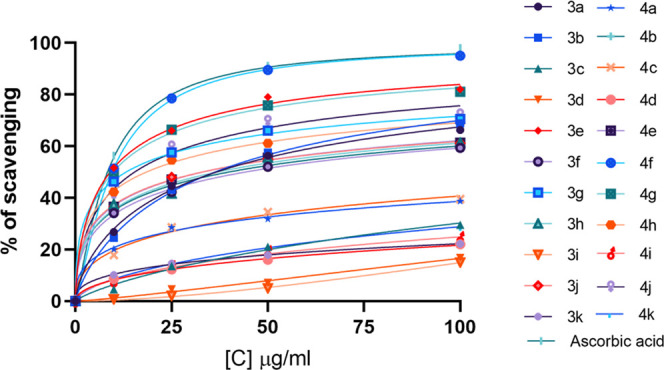
2,2-Diphenyl-1-picryl-hydrazyl (DPPH) radical scavenging activity. The graph shows a linear increase in % inhibition with increasing concentration.
Protein–Ligand Interaction Analysis
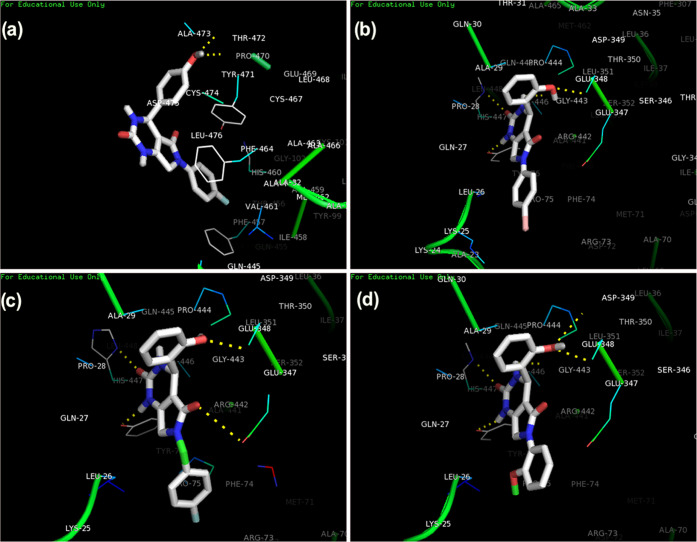
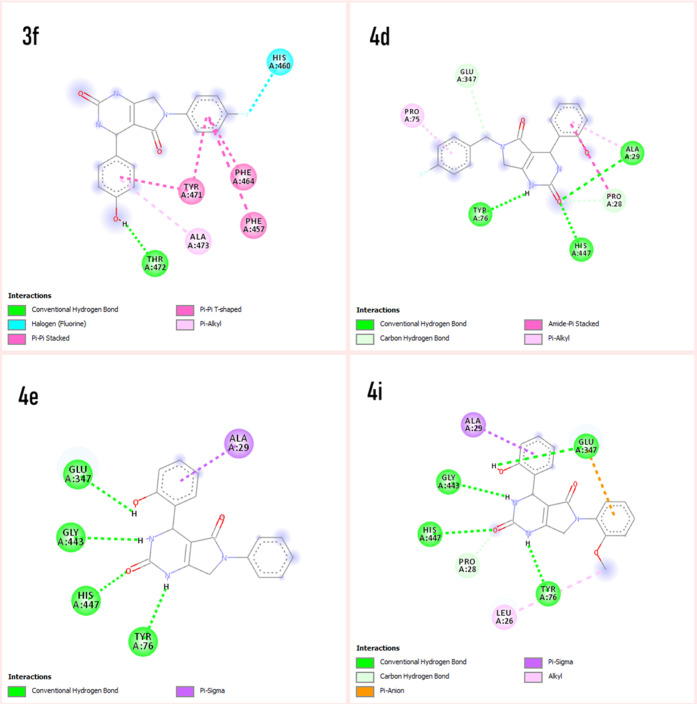
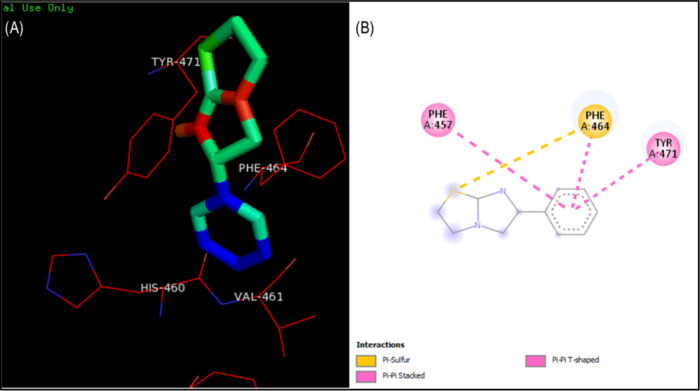
The protein–ligand interaction analysis was performed for the active compounds with the target protein alkaline phosphatase. The visualization of active conformation of the protein–ligand complex was done using Discovery Studio 4.0 and pymol. The protein–ligand interaction analysis showed that the compound 4d had very stable three hydrogen bonds between the hydroxyphenyl group and ALA29, hydrogen of dihydropyrimidinone and TYR76, and oxygen of dihydropyrimidinone and HIS447. The amide−π stacked interactions were also observed between the hydroxyphenyl group and PRO28. Some π–alkyl interactions were observed with PRO75 and ALA29. The compound 4i showed four stable hydrogen bonding of dihydropyrimidinone and GLY443 and TYR76, oxygen of dihydropyrimidinone and HIS447. The hydrogen of the hydroxyphenyl group also showed a hydrogen bond with GLU347. The π–σ and alkyl interactions were observed between the hydroxyphenyl ring and ALA29 and the methoxy group with LEU26. The π–anion interactions were seen with the methoxyphenyl ring and GLU347. In compound 3f, stable hydrogen bonding was observed between the hydrogen of the hydroxyphenyl group and THR472. The π–π stacked and π–π T-shaped interactions were observed between the phenyl ring of flouroaniline and TYR471, PHE464, and PHE457 and the phenyl ring of hydroxyphenyl and TYR471. π–Alkyl interactions were also observed between the phenyl ring and ALA473. However, in compound 4e, a hydrogen bond was observed among GLU347, GLY443, HIS447, and TYR76 (Figures 3 and 4). The standard levimasole was used to compare the binding affinity and the amino acid residues involved in binding to the active site of the protein with that of active compounds. The standard levimasole showed the lowest binding affinity of −5.6 kcal/mol. The interaction analysis showed the interaction of the standard compound levimasole with the amino acid residues PHE457, PHE464, and TYR471. The oxygen atom of levimasole showed π–sulfur interaction with PHE464, while the benzene ring of levimasole showed π–π stacked and π–π T-stacked interaction with the amino acid PHE457 and TYR471, respectively (Figure 5).
Figure 3.
Binding modes of active compounds (a) 3f, (b) 4e, (c) 4d, and (d) 4i in the active binding site of alkaline phosphatase.
Figure 4.
Interaction analysis of active compounds (3f, 4d, 4e, and 4i) with the target protein alkaline phosphatase.
Figure 5.
Binding mode and amino acid interaction of standard levimasole in the active binding site of alkaline phosphatase. (A) Surface interaction of levimasole on the active binding site of the protein. (B) 2D interaction of levimasole showing amino acid residues involved in the interaction.
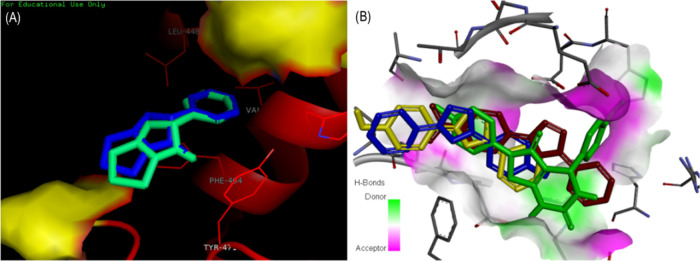
The validation of docking was done by redocking the standard compound in the active binding site of alkaline phosphatase to ensure the docking procedure and efficiencies. The ligand was shown to bind exactly to the same active site of the protein having a root-mean-square deviation (RMSD) of −5.6 kcal/mol. The amino acid residues interacting with the ligand were PHE465, TYR471, LEU448, and VAL461 (Figure 5). The superimposition of the docked complex was done using PyMOL onto the native cocrystallized protein. A very low RMSD of 0.004 Å was observed. The superimposition of the redocked complex is shown in Figure 6. The red-color complex shows the best conformation of levimasole attained during docking, while the blue color signifies the redocked complex in the active site of the protein.
Figure 6.
(A) Superimposition of the redocked complex of levimasole onto the cocrystallized complex into the active site of AP using PyMOL. (B) Superimposition of active compounds (3f, 4d, 4e, and 4i) in the active binding site of the protein.
QSAR Analysis
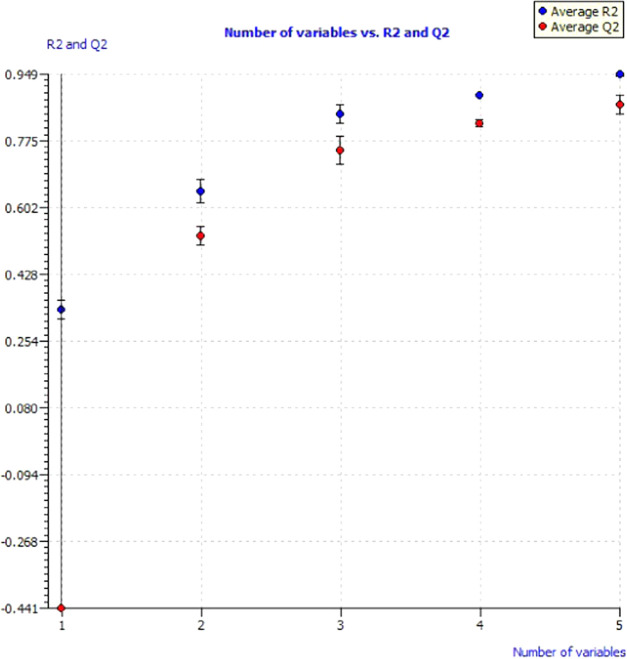
The 22 compounds were divided into two data sets having 15 compounds as training sets and 6 compounds as test sets. PaDEL descriptor software calculated 1445 descriptors, which were further filtered using QSARINS software. The highly correlated descriptors having 90% correlation and 80% constant values were excluded from the study. The all subset method excluded 1058 descriptors from the study, and up to 8 descriptors were added to analyze the effect of descriptors on the quality of the model. Out of 20 models, one best model was selected based on the lowest lack-of-fit value. The overall performances of the models versus the size of the developed models were assessed by plotting the R2 and QLOO2 (with their standard deviation) values (Figure 7). The plot revealed an increase in the value of Q2 and R2 after adding the descriptors. Model 1 with five descriptors having the lowest lack-of-fit value of 0.534 was selected to calculate the alkaline phosphatase inhibitory activities. The best genetic algorithm-multiple linear regression (GA-MLR) model equation was
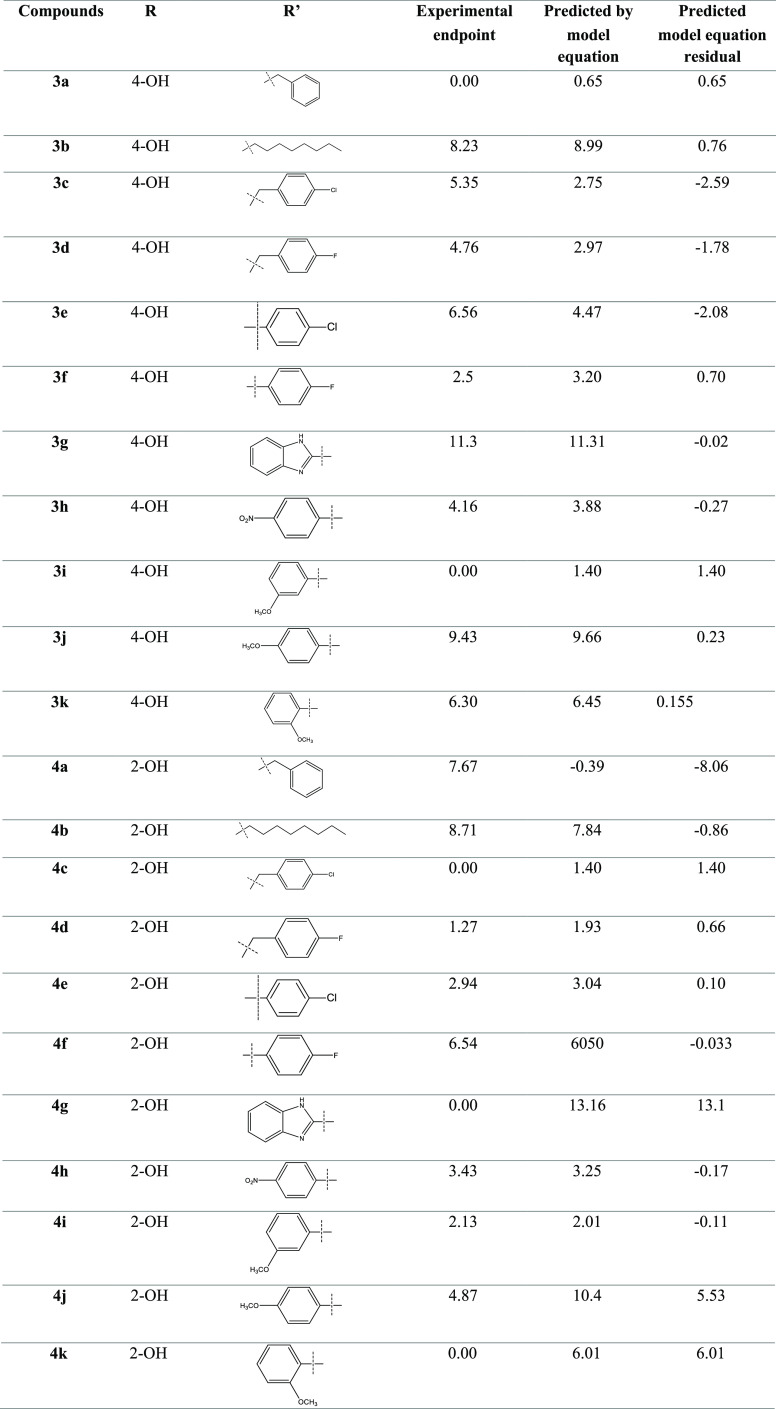
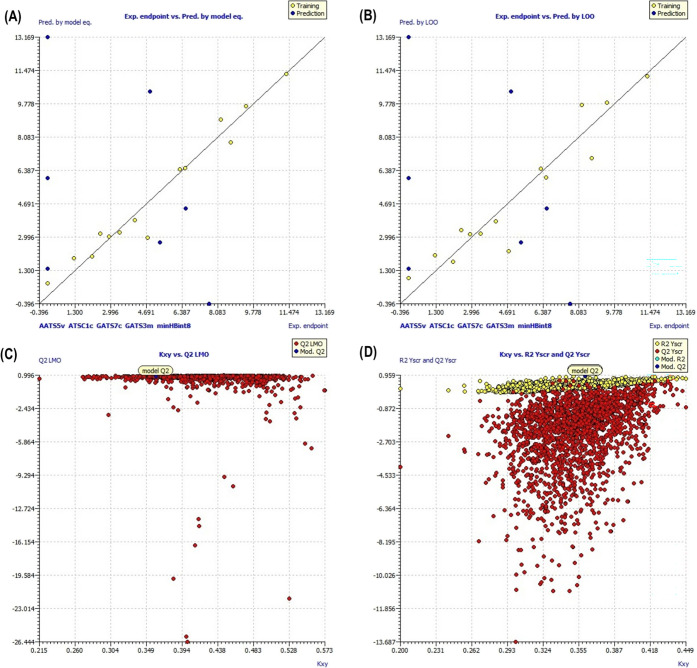
The experimental IC50 and the predicted results by the MLR model for the training set are shown in Table 2. The Pearson correlation matrix describes the no significant multicollinearity (<0.7) among the descriptors generated and is mentioned in Table 3. The internal validation of the model, that is, the scatter plot, scatter plot by leave-one-out (LOO), scatter plot by leave-many-out (LMO), and y-scrambling, predicted the reliability of the model, as shown in Figure 8. William’s plot and the applicability domain (AD) also defined the reliability of the model (Figure 9).
Figure 7.
Model performances of different variables obtained from QSARINS.
Table 2. Chemical Structure and Corresponding Observed and Predicted Activities Obtained from QSARINS.
Table 3. Pearson Correlation Matrix.
| AATS5v | ATSC1c | GATS7c | GATS3m | minHBint8 | |
|---|---|---|---|---|---|
| AATS5v | 1.0000 | ||||
| ATSC1c | –0.3123 | 1.0000 | |||
| GATS7c | –0.1172 | 0.5961 | 1.0000 | ||
| GATS3m | 0.4945 | –0.1520 | 0.1023 | 1.0000 | |
| minHBint8 | 0.0467 | –0.1525 | –0.1751 | 0.1650 | 1.0000 |
Figure 8.
Internal validation of models through different methods. (A) Scatter plot of experimental IC50versus predicted by the model equation. (B) Scatter plot obtained by the LOO method. (C) Plot comparing the original model with the LMO validations. (D) Plot comparing the original model with the y-scrambling model.
Figure 9.
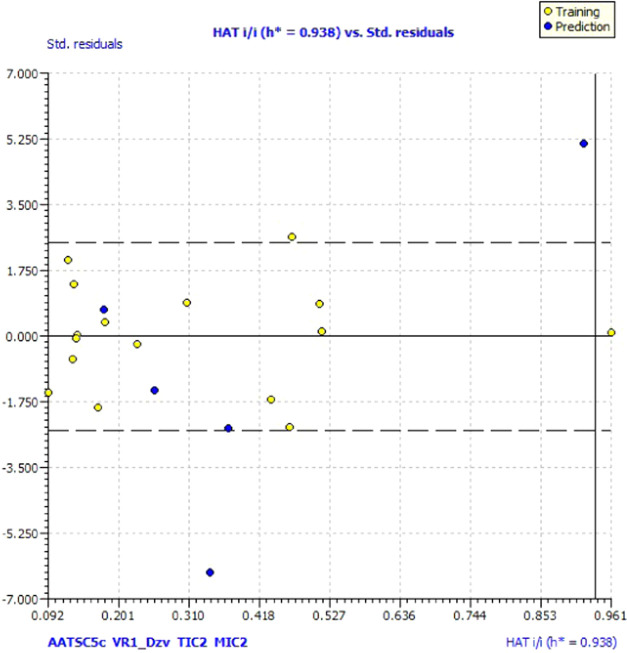
William’s plot of the data set of IC50 standardized against its descriptor.
Molecular Dynamic Simulation
Using Desmond software, the molecular dynamic simulation trajectories were analyzed. The software helped in calculating the root-mean-square deviation (RMSD), root-mean-square fluctuation (RMSF) as well as the protein–ligand contacts from the MD trajectory analysis. Figure 10A displays the root-mean-square-deviation (RMSD) plots showing the complex 4d-1EW2 reached the stable form. Larger RMSD values for the ligand than that of the protein indicate drifting away of the ligand from the initial binding site on the target protein. Figure 10B displays the local changes in the protein chain characterized by RMSF. The peaks shows the most fluctuating portion of the protein with N terminals and C terminals being fluctuating parts on the protein. The α-helices and β-strands fluctuate less in contrast to other loop regions because of their rigid nature.
Figure 10.
(A) With time, C-α atoms of the protein and ligand root-mean-square deviation (RMSD). Change in protein RMSD depicted by the left Y-axis over time. Change in ligand RMSD depicted by the right Y-axis over time. (B) Root-mean-square fluctuation (RMSF) of individual residues of the protein.
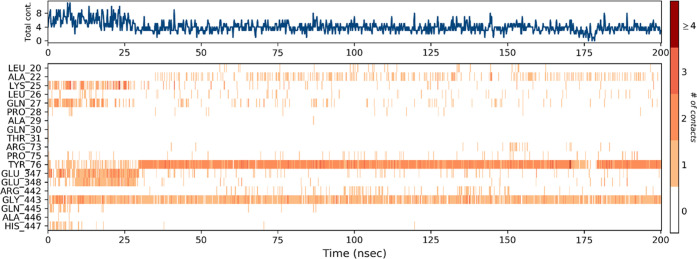
The hydrogen and hydrophobic interactions seemed to be the most significant ligand–protein interactions determined by the molecular dynamic simulations. A schematic representation of detailed ligand atom interactions with the protein residues is displayed in Figures 11 and 12. About greater than 20.0% of the interactions of the simulation time in the selected trajectory (0.00–200.20 ns) are shown. The total number of specific contacts the protein makes with the ligand is shown in the top panel of Figure 13 over the course of the trajectory. In each trajectory frame, the interaction of residues with the ligand is shown in the bottom panel. The trajectory shows more than one specific contact with the ligand for some of the residues displayed by a darker shade of orange.
Figure 11.
Protein–ligand contact histogram and ligand (4d) interactions of atoms with the protein residues of alkaline phosphatase.
Figure 12.
Representation showing the distribution of the secondary protein structure element by a residue index throughout the protein structure. The α-helices are represented by red columns, while β-strands are represented by blue columns.
Figure 13.
Timeline illustration of the protein–ligand interactions and contacts (H-bonds, ionic, hydrophobic, water bridges).
Discussion
Several disorders have been linked to alkaline phosphatases contributing to cancer and bone diseases. The serum levels of AP can also be used to detect multiple diseases. Hence, the alkaline phosphate inhibitory activities of synthesized dihydropyrimidinones were evaluated. The in vitro alkaline phosphatase inhibition assay revealed that the compounds having aromatic groups are more active than the alkyl group (b). Similarly, the substituted benzyl amines are more active than the substituted aromatic amines. Moreover, the −OH group at the ortho position and the electron-withdrawing group −F in compound 4d have more potency; on replacing the group to the −para position (3d), the activity reduced significantly. Also, on replacing the fluorine group with chlorine (3c), the activity reduced significantly. The compound 4e having the −Cl group and the ortho hydroxyl group is more active when compared to 3e having the para hydroxyl group having a very low activity. The electron-donating group (−OCH3) in 4i at the ortho position showed good activity when compared to 3i having the para hydroxyl group, with the activity reducing further on replacing the group from the ortho to the meta position. Compounds 3h and 4h having the electron-withdrawing nitro group also showed moderate activity with no significant difference in activity. The compounds were also tested for their antioxidant activities and showed significant radical scavenging activities. The most potent activity of compound 4f is thought to be due to the highly electronegative fluorine atom; however, by replacing the −OH group from the ortho to the para position, the activity decreased significantly to 60% in 3f. However, in the case of 3e, the IC50 was 0.61, but replacing the −OH group at the ortho position reduced the activity to 60% in 4e, having IC50 2.48. Both 3g and 4g showed 70–80% inhibition with IC50 values of 1.85 and 0.75, respectively, suggesting the effective nature of the benzimidazole group. The compounds 3h and 4h showed IC50 values of 2.61 and 1.72 μg/mL, having not much difference in inhibition, suggesting no significant effect in the change in activity by replacing the groups. The compounds having the anisidine group (i–j) showed fewer activities, with compounds 3j and 4j showing 60 and 70% inhibition, while 3i, 4i, 3k, and 4k showed less than 50% inhibition. The better activity of compound 4j with IC50 1.45 μg/mL may be due to the meta position of −OCH3 and the ortho position of the −OH group. The compounds 3b and 4b showed 68 and 59% scavenging activities with IC50 values of 2.6 and 2.73, respectively. The compound 3a showed IC50 2.61, while 4a showed less than 50% inhibition. The compounds 3c, 3d, 4c, and 4d showed less than 50% inhibition. The standard ascorbic acid showed IC50 0.25 μg/mL with 97% inhibition (Figure 2).
QSARINS software was used to generate the model having the fitting criteria of:
N (number of compounds in the training set) = 15 R2 (coefficient of determination) = 0.958 Radj2 (adjusted R2) = 0.933 s (standard error of estimate) = 0.87 F (variance ratio) = 37.36.
R2– Radj2 = 0.0257, Friedman lack of fit9 (LOF) = 5.343, kxx (intercorrelation among descriptors10) = 0.332, ΔK (difference of correlation among the descriptors and descriptors plus the responses) = 0.029.
Root-mean-square error in fitting of the training set (RMSEtr) = 0.360.
The coefficient of determination R2 was found to be 0.958, closer to 1, depicting a good-quality model for inhibition of alkaline phosphatases. The low value of LOF and Radj2 of 0.933 showed no overfitting in the model and the convenience of adding a new descriptor in the model. The quality of the model can also be assessed by the presence of the least amount of descriptors, and a high F value of 37.36 and a low kxx value of 0.332 showed a minimum correlation between the descriptors. The appropriate correlation between the descriptors was confirmed by the ΔK (0.029) and the small error in training sets (RMSEtr = 0.460; MAEtr = 0.468; RSStr = 6.107; s = 0.87). The potential outliers can be seen by the scatter plot obtained by the model equation versus the experimental IC50 for training sets (Figure 8A).
Internal and External Validation of the Model
The internal validation of the model was done to check the fitting and stability of the model. The cross-validation by the leave-one-out (LOO) method showed good internal prediction as QLOO2 = 0.903 (variance explained by LOO) has a comparable value with R2 = 0.958. Moreover, the small error in prediction of RMSEcv = 1.013 and MAEcv = 0.765 shows a robust and stable model. Figure 8B shows the plot between the predicted values by LOO and the experimental values of IC50. The internal validation by the leave-many-out (LMO) method showed QLMO2 = 0.690, and the calculations in each iteration of LMO and their averages are comparable to the values of R2 and QLOO2 of the model, revealing the stability of the model. Figure 8C displays the plot between the QLMO2 and the correlation between descriptors and IC50 (kxy), showing that the model is a good fit having robustness and stability. The y-scrambling of the model revealed a low chance of correlation as the values of R2 and Q2 and their averages Ry-scr2 and Qy-scr2 were lower than the values obtained by previous methods. The Ry-scr2 and Qy-scr2 values were 0.38 and −2.20, respectively, which are far from the values obtained for R2 and Q2, indicating that the model has not been obtained by random correlation. Figure 8D shows the plot between the Ry-scr2 and Qy-scr2 values against the R2 and Q2 of the model.
The predictive ability of the model was also tested by external validation methods showing Q2-F1: 0.7640; Q2-F2: 0.882; Q2-F3 (variances explained in external prediction11): 0.791; concordance correlation coeffecient12 (CCCext): 0.9; rm2 aver.: 0.71; and Δrm2 (Roy’s criteria average and Δ13): 0.0122. The parameters were equivalent to the values of the R2 model. The predictions of the compound in the external set are shown in Figure 8A.
The reliability of the model is detected by analyzing the number of compounds falling in the applicability domain (AD). The leverage (h) and standardized residuals were used as described by ref (14). The compounds lying in the applicability domain of the model were observed in William’s graph (Figure 9) by plotting the standardized residuals for each compound against the leverage values. In the applicability domain, a leverage threshold of HAT i/ih* = 1.000 was set up along with a defined domain constituting all of the data points within the boundary for residuals.15 It was observed that most of the compounds fall in the applicability domain except for compounds 4a and 4g having values greater than the critical leverage (h = 1.29) and were considered as outliers.
Interpretation of Descriptors
The model generated by QSARINS consisted of five variables with a coefficient intercept of −26.585. The five descriptors generated were the autocorrelated descriptors AATS5v and ATSC1c (average centered Broto–Moreau’s autocorrelation – lag 1/weighted by charges), GATS7c (Geary’s autocorrelation – lag 7/weighted by charges), GATS3m (Geary’s autocorrelation – lag 6/weighted by mass), and minHBint8.
The autocorrelated descriptors ATS5v, ATSC1c, GATS7c, and GATS3m are calculated by the Moreau–Broto (ATS) and Geary (GATS) algorithms from lag 1 to lag 8 with different weighing patterns. These descriptors are the sum of products of atom weights of terminal atoms of all paths of the considered path length (lag). The two indices lag (d) and weight (w) are the symbols of autocorrelated descriptors, where the lag defines the topological distance between two pairs of atoms and the weight can be defined by polarizability (p), relative atomic mass (m), Sanderson’s electronegativity (e), charges (c), ionization potential (i), and van der Waals volume (v). These descriptors define specific physicochemical properties associated with the topology of these structures. The GAT7c is the Geary autocorrelation descriptor of lag 7, which is weighted by charge. Similarly, GATS3m is the Geary autocorrelation descriptor of lag 3, which is weighted by the relative atomic mass. ATS5v and ATSC1c are the Moreau–Broto autocorrelation descriptors of lags 5 and 1 weighted by the van der Waals volume and charge, respectively. The AATS5v, ATSC1c, and GATS3m consist of the negative mean effect. This shows that by increasing these descriptors, there will be a decrease in the inhibitory activity. The negative coefficient is linked to enhanced binding activities of dihydropyrimidinone derivatives. The descriptor GATS7c contributed positively to the activity, suggesting that higher values would be supportive in enhancing the activity.
In the molecular simulation studies, the RMSD plot of the complex indicates that the complex reaches stability at 50 ns. From then, changes in RMSD values remain within 0.5 Å for the protein during the simulation period, which is quite acceptable. A fluctuation within 1.54 Å was observed for RMSD values of the ligand fit to the protein after gaining stability. The value indicated stable binding of the ligand to the active binding site of the protein during the simulation period (Figure 10). Keeping in view the H-bonds, the amino acid TYR_76 and GLY_443 proved to be the most important residues. The normalization of the stacked bar charts was done over the course of the trajectory: for example, a value of 1.0 suggests that the particular interactions were retained for 100% of the simulation time (Figure 13). Due to multiple contacts of some protein residues of the same subtype with the ligand, values of over 1.0 are possible.
Conclusions
In this study, the inhibitory role of dihydropyrimidinone derivatives on alkaline phosphatase was studied to ascertain the possible drug targets for this enzyme. The study identified potential targets having significant alkaline phosphatase inhibitory effects that can serve as a template in drug designing. The ligand–protein binding interactions and the molecular dynamic simulations validate the molecular docking results. Among the compounds, 4d, 4i, 3f, and 4e showed potential inhibitory effects, acting as alkaline phosphatase inhibitors. Moreover, the QSAR analysis revealed the importance of autocorrelated descriptors in the structural molecule for its inhibitory activities. The investigated compounds may serve as potential pharmacophores for potent and selective alkaline phosphatase inhibitors to combat the pathological disorders due to alkaline phosphatase overexpression. We intend to further investigate the biological activities of these compounds as alkaline phosphatase inhibitors.
Materials and Methods
Experimental Section
Instrumentation
The Gallenkamp (SANYO) model MPD.BM 3.5 apparatus was used to record the melting points. 1H NMR spectra were measured on a Bruker AV400 spectrophotometer in CD3OD and CD3Cl3 at 300 MHz with tetramethylsilane (TMS) as the internal standard. Thin-layer chromatography was used to monitor the reaction progress using silica gel HF-254-coated plates in different solvent systems with detection by UV-light absorption. The Alpha Bruker FTIR spectrophotometer (vmax cm–1) was used to measure the FTIR of the synthesized compounds. All of the chemicals and reagents used in the study were obtained from Aldrich Chemical Co. Mass spectral analysis was done using ionization mode MS (EI) with the JEOL 600H-1 instrument.
General Procedure for the Synthesis of Ethyl 6-(Chloromethyl)-4-(4-hydroxyphenyl)-2-oxo-1,2,3,4-tetrahydropyrimidine-5-carboxylate (1)
Urea (0.01 mol), 4-chloroethylacetoacetate (0.02 mol), and 4-hydroxy benzaldehyde (0.02 mol) were refluxed for 1 h. The resulting solid was washed with water and filtered.
Yield: 53%. MP: 120 °C. Rf: 0.66. IR (vmax cm–1) 3408 (N–H, str); 1674 (C=O, amide, str); 755 (C–Cl, str).
General Procedure for the Synthesis of Ethyl 6-(Chloromethyl)-4-(2-hydroxyphenyl)-2-oxo-1,2,3,4-tetrahydropyrimidine-5-carboxylate (2)
Urea (0.01 mol), 4-chloroethylacetoacetate (0.02 mol), and 2-hydroxy benzaldehyde (0.02 mol) were refluxed for 1 h. The resulting solid was washed with water and filtered.
Yield: 53%. MP: 190 °C. Rf: 0.66. IR (vmax cm–1) 3408 (N–H, str); 1674 (C=O, amide, str); 755 (C–Cl, str).
General Procedure for the Synthesis of Pyrolopyrimidines
A total of 0.001 mol of 6-chloromethyl dihydropyrimidinone was stirred in 5–10 mL of methanol, after which 0.003 mol of benzylamine was added subsequently. The mixture was first refluxed at 25 °C for 1–3 h, and then, the temperature was raised at 64 °C for 5–6 h. After completion of the reaction, the solution was cooled to ambient temperature and the solid product was filtered and washed with cold methanol to obtain the sample of desired pyrrolopyrimidines. Recrystallization was performed to obtain the analytically pure samples.
6-Benzyl-4-(4-hydroxyphenyl)-3,4,6,7-tetrahydro-1H-pyrrolo[3,4-d]pyrimidine-2,5-dione (3a)
Yield: 70%. MP: ±155 °C; Rf = 0.41 (ethyl acetate/petroleum ether, 1:7); FTIR: 3590 (OH), 3455 (NH), 3100 (CH2, sp3), 2870 (CH, sp3), 1690 (CO, amide), 1560 (C=C, aromatic). 1H NMR (dimethyl sulfoxide (DMSO)-d6, δ ppm): 4.10 (s, 2H), 4.33 (s, 2H), 5.10 (s, 1H), 6.65 (d, J = 8.19, Ar–2H), 7.28 (d, J = 7.7, Ar–2H), 7.29–7.34 (m, Ar–5H), 8.10–9.14 (NH, OH). 13C NMR: δ = 50.1 (1C, sp3), 52.8, 53.7 (2C, sp3), 115–125 (4C, Ar), 128.6–128.9 (5C, Ar), 129.2 (1C, sp2), 134.1–136.8 (2C, Ar), 137.5 (1C, sp2), 152.4 (1C, C=O), 157.8 (1C, C–OH), 169.2 (1C, C=O). MS (EI) m/z: 335 [M].
4-(4-Hydroxyphenyl)-6-octyl-3,4,6,7-tetrahydro-1H-pyrrolo[3,4-d]pyrimidine-2,5-dione (3b)
Yield: 70%. MP: ±150 °C; Rf = 0.41; FTIR: 3600 (OH), 3350 (NH), 3100 (CH, sp2), 2870 (CH, sp3), 1680 (CO, amide), 1560 (C=C, aromatic). 1H NMR (DMSO-d6, δ ppm): 0.86 (t, J = 7.1 Hz, J = 7.0, 3H), 1.27–3.12 (m, 14H), 4.37 (s, 2H), 5.11 (s, 1H), 6.65 (d, J = 8.19, Ar–2H), 7.28 (d, J = 7.7, Ar–2H), 8.08–9.16 (NH, OH). 13C NMR: δ = 14.3–49.6 (8C, sp3), 50.1 (1C, sp3), 52.8 (1C, sp3), 115–125 (4C, Ar), 129.2 (1C, sp2), 134.8 (1C, Ar), 137.5 (1C, sp2), 152.6 (1C, C=O), 157.8 (1C, C–OH), 169.8 (1C, C=O). MS (EI) m/z: 357 [M].
6-(4-Chlorobenzyl)-4-(4-hydroxyphenyl)-3,4,6,7-tetrahydro-1H-pyrrolo[3,4-d]pyrimidine-2,5-dione (3c)
Yield: 70%. MP: ± 215 °C; Rf = 0.41; FTIR: 3650 (OH), 3490 (NH), 3100 (CH, sp2), 2870 (CH, sp3), 1695 (CO, amide), 1560 (C=C, aromatic). 1H NMR (DMSO-d6, δ ppm): 4.10 (s, 2H), 4.40 (s, 2H), 5.18 (s, 1H), 6.75 (d, J = 8.1, Ar–2H), 7.29 (d, J = 7.5, Ar–2H), 7.35 (d, J = 8.4, Ar–2H), 7.44 (d, J = 7.9, Ar–2H), 8.18–9.16 (NH, OH). 13C NMR: δ = 50.1 (1C, sp3), 52.8, 53.7 (2C, sp3), 115–125 (4C, Ar), 128.3–129.9 (4C, Ar), 129.2 (1C, sp2), 134.1–136.8 (3C, Ar), 137.5 (1C, sp2), 152.4 (1C, C=O), 157.8 (1C, C–OH), 165.7 (1C, C=O). MS (EI) m/z: 369 [M].
6-(4-Fluorobenzyl)-4-(4-hydroxyphenyl)-3,4,6,7-tetrahydro-1H-pyrrolo[3,4-d]pyrimidine-2,5-dione (3d)
Yield: 70%. MP: ± 200 °C; Rf = 0.41; FTIR: 3595 (OH), 3500 (NH), 3100 (CH, sp2), 2870 (CH, sp3), 1700 (CO, amide), 1560 (C=C, aromatic). 1H NMR (DMSO-d6, δ ppm): 4.19 (s, 2H), 4.30 (s, 2H), 5.19 (s, 1H), 6.64 (d, J = 7.9, Ar–2H), 7.34 (d, J = 7.7, Ar–2H), 7.11 (d, J = 7.7, Ar–2H), 7.31 (d, J = 8.3, Ar–2H), 8.8–9.10 (OH, NH). 13C NMR: δ = 50.1 (1C, sp3), 52.8, 53.7 (2C, sp3), 112.11, 112.17 (2C, 3JC–F = 18 Hz), 115–125.5 (4C, Ar), 129.2 (1C, sp2), 134.1 (1C, Ar), 139.5, 136.8 (2C, d, 2JC–F = 11.5 Hz), 137.5 (1C, sp2), 137.9 (1C, Ar), 141.1, 145.9 (1C, d, 2JC–F = 275 Hz), 152.4 (1C, C=O), 157.8 (1C, C–OH), 168.7 (1C, C=O). MS (EI) m/z: 353 [M].
6-(4-Chloroophenyl)-4-(4-hydroxyphenyl)-3,4,6,7-tetrahydro-1H-pyrrolo[3,4-d]pyrimidine-2,5-dione (3e)
Yield: 70%. MP: ±220 °C; Rf = 0.41; FTIR: 3610 (OH), 3430 (NH), 3100 (CH, sp2), 2870 (CH, sp3), 1680 (NH, amide), 1560 (C=C, aromatic). 1H NMR (DMSO-d6, δ ppm): 4.10 (s, 2H), 5.10 (s, 1H), 6.65 (d, J = 8.19 Hz, Ar–2H), 7.29 (d, J = 7.9 Hz, Ar–2H), 7.32 (d, J = 8.2 Hz, Ar–2H), 7.69 (s, J = 7.9 Hz, Ar–2H), 9.16 (s, NH, 1H). 13C NMR: δ = 50.1 (1C, sp3), 52.8 (1C, sp3), 115–125 (5C, Ar), 126.2 (2C, Ar), 129.2 (1C, sp2), 132.2–138.9 (4C, Ar), 137.5 (1C, sp2), 152.4 (1C, C–O), 157.8 (1C, C–OH), 163.9 (1C, C=O). MS (EI) m/z: 399 [M].
6-(4-Fluorophenyl)-4-(4-hydroxyphenyl)-3,4,6,7-tetrahydro-1H-pyrrolo[3,4-d]pyrimidine-2,5-dione (3f)
Yield: 70%. MP: ±210 °C; Rf = 0.41; FTIR: 3600 (OH), 3490 (NH), 3100 (CH, sp2), 2870 (CH, sp3), 1690 (CO, amide), 1560 (C=C, aromatic). 1H NMR (DMSO-d6, δ ppm): 3.9 (s, 2H), 5.15 (s, 1H), 6.7 (d, J = 8.0 Hz, Ar–2H), 7.29 (d, J = 7.9 Hz, Ar–2H), 7.05 (d, J = 8.1 Hz, Ar–2H), 7.60 (s, J = 7.9, Ar–2H), 9.06 (s, NH, 1H). 13C NMR: δ = 50.1 (1C, sp3), 52.8 (1C, sp3), 113.23, 113.29 (2C, 3JC–F = 18 Hz), 115–125.5 (4C, Ar), 129.2 (1C, sp2), 134.1 (1C, Ar), 138.3, 135.5 (2C, d, 2JC–F = 11.5 Hz), 137.5 (1C, sp2), 140 (1C, Ar), 140.7, 144.7 (1C, d, JC–F = 275 Hz), 152.4 (1C, C=O), 157.4 (1C, C–OH), 168.1 (1C, C=O). EIMS: m/z (%) = 311 (9.7, M+ – CO), 274 (100), 263 (55), 245 (16.5), 237 (87.4), 229 (33), 219 (45), 217 (98.7), 201(68.6), 189 (20.3), 172 (14.7), 148 (29), 117 (23.5), 104 (10), 91 (15.6), 77 (12).
6-(1H-Benzo[d]imidazol-2-yl)-4-(4-hydroxyphenyl)-3,4,6,7-tetrahydro-1H-pyrrolo[3,4-d]pyrimidine-2,5-dione (3g)
Yield: 70%. MP: ±170 °C; Rf = 0.41; FTIR: 3640 (OH), 3455 (NH), 3090 (CH, sp2), 2870 (CH, sp3), 1690 (CO, amide), 1585 (C=C, aromatic). 1H NMR (DMSO-d6, δ ppm): 4.09 (s, 2H), 4.90 (s, 1H), 6.78 (d, J = 7.19 Hz, Ar–2H), 7.48 (d, J = 7.3 Hz, Ar–2H), 6.93–7.4 (m, Ar–4H), 8.7–9.6 (NH, OH). 13C NMR: δ = 50.1 (1C, sp3), 52.8 (1C, sp3), 115–125.7 (8C, Ar), 129.2 (1C, sp2), 134.1–136.8 (3C, Ar), 137.5 (1C, sp2), 152.4 (1C, C=O), 153.7 (1C, sp2), 157.6 (1C, C–OH), 166.4 (1C, CO-NH). MS (EI) m/z: 361 [M].
6-(4-Hydroxyphenyl)-6-(2-nitrophenyl)-3,4,6,7-tetrahydro-1H-pyrrolo[3,4-d]pyrimidine-2,5-dione (3h)
Yield: 70%. MP: ±210 °C; Rf = 0.41; FTIR: 3630 (OH), 3375 (NH), 3080 (CH, sp2), 2900 (CH, sp3), 1700 (CO, amide), 1490 (C=C, aromatic). 1H NMR (DMSO-d6, δ ppm): 4.10 (s, 2H), 5.10 (s, 1H), 6.65 (d, J = 8.19 Hz, Ar–2H), 7.28 (d, J = 7.9 Hz, Ar–2H), 7.6–8.1 (m, Ar–4H), 9.16 (s, NH, 1H). 13C NMR: δ = 50.1 (1C, sp3), 52.8 (1C, sp3), 115.1–127.4 (8C, Ar), 129.2 (1C, sp2), 133.8–140.5 (2C, Ar), 137.5 (1C, sp2), 152.4 (1C, C–O), 157.4 (1C, C–OH), 169.8 (1C, C=O). MS (EI) m/z: 355 [M].
4-(4-Hydroxyphenyl)-6-(3-methoxyphenyl)-3,4,6,7-tetrahydro-1H-pyrrolo[3,4-d]pyrimidine-2,5-dione (3i)
Yield: 70%. MP: ±190 °C; Rf = 0.41; FTIR: 3610 (OH), 3490 (NH), 3100 (CH, sp2), 2960 (CH, sp3), 1685 (CO, amide), 1595 (C=C, aromatic). 1H NMR (DMSO-d6, δ ppm): 3.83 (s, 3H), 4.15 (s, 2H), 5.15 (s, 1H), 6.8 (d, J = 7.9, Ar–2H), 7.18 (d, J = 7.9, Ar–2H), 6.95–7.6 (m, Ar–4H), 8–9.04 (NH, OH). 13C NMR: δ = 50.1 (1C, sp3), 52.8 (1C, sp3), 56.0 (1C, OCH3) 115.6–125.3 (8C, Ar), 129.2 (1C, sp2), 133.2–134.8 (2C, Ar), 137.5 (1C, sp2), 152.4 (1C, C=O), 157.4 (1C, C–OH), 154.9 (1C, Ar), 172.5 (1C, C=O). MS (EI) m/z: 351 [M].
4-(4-Hydroxyphenyl)-6-(4-methoxyphenyl)-3,4,6,7-tetrahydro-1H-pyrrolo[3,4-d]pyrimidine-2,5-dione (3j)
Yield: 70%. MP: ±205 °C; Rf = 0.41; FTIR: 3640 (OH), 3455 (NH), 3100 (CH, sp2), 2965 (CH, sp3), 1690 (CO, amide), 1560 (C=C, aromatic). 1H NMR (DMSO-d6, δ ppm): 3.65 (s, 3H), 4.10 (s, 2H), 5.10 (s, 1H), 6.65 (d, J = 8.19 Hz, Ar–2H), 7.28 (d, J = 8.2 Hz, Ar–2H), 6.68 (d, J = 8.7Hz, Ar–2H), 7.2 (d, J = 8.7, Ar–2H), 8.08–9.16 (NH, OH). 13C NMR: δ = 50.1 (1C, sp3), 52.8 (1C, sp3), 55.5 (1C, OCH3) 114.4–125.8 (8C, Ar), 129.2 (1C, sp2), 134.4–138.9 (2C, Ar), 137.5 (1C, sp2), 152.4 (1C, C=O), 157.2 (1C, C–OH), 156.9 (1C, Ar), 170.6 (1C, C=O). MS (EI) m/z: 351 [M].
4-(4-Hydroxyphenyl)-6-(2-methoxyphenyl)-3,4,6,7-tetrahydro-1H-pyrrolo[3,4-d]pyrimidine-2,5-dione (3k)
Yield: 87%. MP: ±215 °C; Rf = 0.41; FTIR: 3615 (OH), 3495 (NH), 3090 (CH, sp2), 2940 (CH, sp3), 1690 (CO, amide), 1500 (C=C, aromatic). 1H NMR (DMSO-d6, δ ppm): 3.7 (s, 3H), 4.09 (s, 2H), 5.25 (s, 1H), 6.68 (d, J = 8.0 Hz, Ar–2H), 7.30 (d, J = 7.9 Hz, Ar–2H), 6.8–7.45 (m, Ar–4H), 9.10 (s, NH, OH). 13C NMR: δ = 50.1 (1C, sp3), 52.8 (1C, sp3), 55.5 (1C, OCH3) 103.1–120.5 (4C, Ar), 115.1–125.8 (4C, Ar), 129.2 (1C, sp2), 134.2–144.3 (2C, Ar), 137.5 (1C, sp2), 152.4 (1C, C=O), 158.8 (1C, C–OH), 160.3 (1C, Ar), 163.4 (1C, CO–NH). MS (EI) m/z: 351 [M].
6-Benzyl-4-(2-hydroxyphenyl)-3,4,6,7-tetrahydro-1H-pyrrolo[3,4-d]pyrimidine-2,5-dione (4a)
Yield; 87%. MP: ±195 °C; Rf = 0.41 (ethyl acetate/petroleum ether, 1:7); FTIR: 3595 (OH), 3350 (NH), 3100 (CH, sp2), 2960 (CH, sp3), 1695 (CO, amide), 1585 (C=C, aromatic). 1H NMR (DMSO-d6, δ ppm): 4.10 (s, 2H), 4.33 (s, 2H), 5.10 (s, 1H), 6.64–7.8 (m, Ar–9H), 8.02–9.16 (NH, OH). 13C NMR: δ = 50.1 (1C, sp3), 52.8–53.7 (2C, sp3), 114–131.9 (10C, Ar), 129.2 (1C, sp2), 137.1 (1C, Ar), 137.5 (1C, sp2), 152.4 (1C, C=O), 154.6 (1C, C–OH), 172.6 (1C, C=O). MS (EI) m/z: 335 [M].
4-(2-Hydroxyphenyl)-6-octyl-3,4,6,7-tetrahydro-1H-pyrrolo[3,4-d]pyrimidine-2,5-dione (4b)
Yield: 87%. MP: ±175 °C; Rf = 0.41; FTIR: 3640 (OH), 3455 (NH), 3100 (CH, sp2), 2870 (CH, sp3), 1660 (CO, amide), 1560 (C=C, aromatic). 1H NMR (DMSO-d6, δ ppm): 0.86 (t, J = 7.0, 3H), 1.27–3.12 (m, 14H), 4.11 (s, 2H), 5.10 (s, 1H), 6.64–7.3 (m, Ar–4H), 7.8–9.16 (NH, OH). 13C NMR: δ = 14.3–49.6 (8C, sp3), 50.1 (1C, sp3), 52.8–128.9 (5C, Ar), 129.2 (1C, sp2), 137.5 (1C, sp2), 152.2 (1C, C=O), 154.8 (1C, C–OH), 167.5 (1C, C=O). MS (EI) m/z: 357 [M].
6-(4-Chlorobenzyl)-4-(2-hydroxyphenyl)-3,4,6,7-tetrahydro-1H-pyrrolo[3,4-d]pyrimidine-2,5-dione (4c)
Yield: 87%. MP: ±220 °C; Rf = 0.41; FTIR: 3600 (OH), 3395 (NH), 3110 (CH, sp2), 2930 (CH, sp3), 1680 (CO, amide), 1535 (C=C, aromatic). 1H NMR (DMSO-d6, δ ppm): 4.15 (s, 2H), 4.43 (s, 2H), 5.2 (s, 1H), 6.7–7.4 (m, Ar–4H), 7.36 (d, J = 7.7, Ar–2H), 7.63 (s, J = 7.8, Ar–2H), 8.01–9.06 (NH, OH). 13C NMR: δ = 50.1 (1C, sp3), 52.8, 53.7 (2C, sp3), 114–131.9 (9C, Ar), 129.2 (1C, sp2), 135.5–136.8 (2C, Ar), 137.5 (1C, sp2), 152.4 (1C, C=O), 154.6 (1C, C–OH), 169.3 (1C, C=O). MS (EI) m/z: 369 [M].
6-(4-Fluorobenzyl)-4-(2-hydroxyphenyl)-3,4,6,7-tetrahydro-1H-pyrrolo[3,4-d]pyrimidine-2,5-dione (4d)
Yield: 87%. MP: ±190 °C; Rf = 0.41; FTIR: 3605 (OH), 3495 (NH), 3100 (CH, sp2), 2900 (CH, sp3), 1685 (CO, amide), 1560 (C=C, aromatic). 1H NMR (DMSO-d6, δ ppm): 3.9 (s, 2H), 4.29 (s, 2H), 4.90 (s, 1H), 6.73–7.5 (m, Ar–4H), 7.35 (d, J = 7.7, Ar–2H), 7.45 (d, J = 7.9, Ar–2H), 7.9–9.2 (NH, OH). 13C NMR: δ = 50.4 (1C, sp3), 52.8, 53.7 (2C, sp3), 112.11, 112.17 (2C, 3JC–F = 18 Hz), 115–125.5 (4C, Ar), 129.2 (1C, sp2), 134.1 (1C, Ar), 140.5, 137.8 (2C, d, 2JC–F = 11.5 Hz) 137.5 (1C, sp2), 139.9 (1C, Ar), 142.1, 146.9 (1C, d, JC–F = 275 Hz), 152.4 (1C, C=O), 154.8 (1C, C–OH), 171.7 (1C, C=O). MS (EI) m/z 353: [M].
6-(4-Chlorophenyl)-4-(2-hydroxyphenyl)-3,4,6,7-tetrahydro-1H-pyrrolo[3,4-d]pyrimidine-2,5-dione (4e)
Yield: 87%. MP: ±175 °C; Rf = 0.41; FTIR: 3640 (OH), 3455 (NH), 3090 (CH, sp2), 2890 (CH, sp3), 1670 (CO, amide), 1600 (C=C, aromatic). 1H NMR (DMSO-d6, δ ppm): 4.12 (s, 2H), 5.10 (s, 1H), 6.7–7.35 (m, Ar–4H), 7.32 (d, J = 7.6, Ar–2H), 7.8 (d, J = 7.8, Ar–2H), 7.88–9.05 (NH, OH). 13C NMR: δ = 50.1 (1C, sp3), 52.8 (1C, sp3), 114–131.9 (8C, Ar), 129.2 (1C, sp2), 132.2–138.9 (3C, Ar), 137.5 (1C, sp2), 152.4 (1C, C=O), 154.0 (1C, C–OH), 160.8 (1C, C=O). MS (EI) m/z = 399 [M].
6-(4-Fluorophenyl)-4-(2-hydroxyphenyl)-3,4,6,7-tetrahydro-1H-pyrrolo[3,4-d]pyrimidine-2,5-dione (4f)
Yield: 87%. MP: ±215 °C; Rf = 0.41; FTIR: 3610 (OH), 3385 (NH), 3120 (CH, sp2), 2910 (CH, sp3), 1690 (CO, amide), 1515 (C=C, aromatic); 1H NMR (DMSO-d6, δ ppm): 4.20 (s, 2H), 5.20 (s, 1H), 6.64–7.3 (m, J = 8.1, Ar–4H), 7.01 (d, J = 7.7, Ar–2H), 7.6 (s, J = 7.9, Ar–2H), 7.89–9.16 (NH, OH). 13C NMR: δ = 50.1 (1C, sp3), 52.8 (1C, sp3), 114.23, 114.29 (2C, 3JC–F = 18 Hz), 115–125.5 (4C, Ar), 129.2 (1C, sp2), 134.1 (1C, Ar), 138.3, 135.5 (2C, d, 2JC–F = 11.5 Hz), 137.5 (1C, sp2), 140 (1C, Ar), 140.7, 144.7 (1C, d, JC–F = 275 Hz), 152.4 (1C, C=O), 154.4 (1C, C–OH), 171.1 (1C, C=O). MS (EI): m/z = 311 (9.7, M+ – CO), 274 (100), 263 (55), 245 (16.5), 237 (87.4), 229 (33), 219 (45), 217 (98.7), 201 (68.6), 189 (20.3), 172 (14.7), 148 (29), 117 (23.5), 104 (10), 91 (15.6), 77 (12).
6-(1H-Benzo[d]imidazol-2-yl)-4-(2-hydroxyphenyl)-3,4,6,7-tetrahydro-1H-pyrrolo[3,4-d]pyrimidine-2,5-dione (4g)
Yield: 87%. MP: ±200 °C; Rf = 0.41; FTIR: 3640 (OH), 3455 (NH), 3100 (CH, sp2), 2870 (CH, sp3), 1660 (CO, amide), 1560 (C=C, aromatic). 1H NMR (DMSO-d6, δ ppm): 4.05 (s, 2H), 5.05 (s, 1H), 6.7–7.5 (m, Ar–8H), 10.1 (s, NH, 1H). 13C NMR: δ = 50.1 (1C, sp3), 52.8 (1C, sp3), 114.2–136.1 (11C, Ar), 129.2 (1C, sp2), 137.5 (1C, sp2), 152.4 (1C, C=O), 153.7 (1C, sp2), 154.6 (1C, C–OH), 170.8 (1C, C=O). MS (EI) m/z: 361 [M].
4-(2-Hydroxyphenyl)-6-(2-nitrophenyl)-3,4,6,7-tetrahydro-1H-pyrrolo[3,4-d]pyrimidine-2,5-dione (4h)
Yield: 87%. MP: ±210 °C; Rf = 0.41; FTIR: 3590 (OH), 3485 (NH), 3110 (CH, sp2), 2900 (CH, sp3), 1690 (CO, amide), 1545 (C=C, aromatic). 1H NMR (DMSO-d6, δ ppm): 4.10 (s, 2H), 5.10 (s, 1H), 6.66–8 (m, Ar–8H), 9.56 (NH, OH). 13C NMR: δ = 50.1 (1C, sp3), 52.8 (1C, sp3), 114.2–133.7 (10C, Ar), 129.2 (1C, sp2), 137.5 (1C, sp2), 140.5 (1C, Ar), 152.4 (1C, C=O), 154.6 (1C, C–OH), 165.8 (1C, C=O). MS (EI) m/z: 355 [M].
4-(2-Hydroxyphenyl)-6-(2-methoxyphenyl)-3,4,6,7-tetrahydro-1H-pyrrolo[3,4-d]pyrimidine-2,5-dione (4i)
Yield: 87%. MP: ±215 °C; Rf = 0.41; FTIR: 3640 (OH), 3395 (NH), 3120 (CH, sp2), 2935 (CH, sp3), 1695 (CO, amide), 1590 (C=C, aromatic). 1H NMR (DMSO-d6, δ ppm): 3.9 (s, 3H), 4.24 (s, 2H), 5.18 (s, 1H), 6.68–7.4 (m, Ar–8H), 9.02–10.06 (NH, OH). 13C NMR: δ = 50.1 (1C, sp3), 52.8 (1C, sp3), 55.5 (1C, OCH3), 114.2–133.3 (10C, Ar), 129.2 (1C, sp2), 137.5 (1C, sp2), 152.4 (1C, C=O), 154.6 (1C, C–OH), 154.9 (1C, Ar), 169.8 (1C, C=O). MS (EI) m/z: 351 [M].
4-(2-Hydroxyphenyl)-6-(4-methoxyphenyl)-3,4,6,7-tetrahydro-1H-pyrrolo[3,4-d]pyrimidine-2,5-dione (4j)
Yield: 87%. MP: ±220 °C; Rf = 0.41; FTIR: 3640 (OH), 3455 (NH), 3100 (CH, sp2), 2950 (CH, sp3), 1680 (CO, amide), 1500 (C=C, aromatic). 1H NMR (DMSO-d6, δ ppm): 3.68 (s, 3H), 4.18 (s, 2H), 5.15 (s, 1H), 6.68–7.35 (m, 8H), 7.9–9.18 (NH, OH). 13C NMR: δ = 50.1 (1C, sp3), 52.8 (1C, sp3), 55.5 (1C, OCH3), 114.4–131.8 (9C, Ar), 129.2 (1C, sp2), 138.9 (1C, Ar), 137.5 (1C, sp2), 152.4 (1C, C=O), 154.6 (1C, C–OH), 156.9 (1C, Ar), 162.8 (1C, C=O). MS (EI) m/z: 351 [M].
4-(2-Hydroxyphenyl)-6-(3-methoxyphenyl)-3,4,6,7-tetrahydro-1H-pyrrolo[3,4-d]pyrimidine-2,5-dione (4k)
Yield: 87%. MP: ±215 °C; Rf = 0.41; FTIR: 3625 (OH), 3475 (NH), 3110 (CH, sp2), 2910 (CH, sp3), 1680 (CO, amide), 1585 (C=C, aromatic). 1H NMR (DMSO-d6, δ ppm): 3.75 (s, 3H), 4.19 (s, 2H), 5.16 (s, 1H), 6.62–7.42 (m, Ar–8H), 8.01–9.26 (NH, OH). 13C NMR: δ = 50.1 (1C, sp3), 52.8 (1C, sp3), 55.5 (1C, OCH3), 104.1–130.5 (9C, Ar), 129.2 (1C, sp2), 144.3 (1C, Ar), 137.5 (1C, sp2), 152.4 (1C, C=O), 154.6 (1C, C–OH), 160.3 (1C, Ar), 172.8 (1C, C=O). MS (EI) m/z: 351 [M].
Alkaline Phosphatase Inhibition Assay
The calf intestinal alkaline phosphatase (CAIP) activity was performed according to the previously reported method using the spectrophotometric assay.16 The inhibitory activity was measured using 50 mM Tris–HCl buffer comprising 5 mM MgCl2 and 0.1 mM ZnCl2 (pH 9.5). CAIP of 5 μL (0.025 U/mL) was added by preincubating the tested compounds (0.1 mM) with final DMSO 1% (v/v) and mixed for 10 min. Then, 10 μL of substrate (0.5 mM) para-nitrophenylphosphate disodium salt (p-NPP) was added to initiate the reaction and the assay mixture was incubated again for 30 min at 37 °C. A 96-well microplate reader (OptiMax, Tunable USA) was used to monitor the change in absorbance of the released p-nitrophenolate at 405 nm. All of the experiments were performed in triplicate by repeating. KH2PO4 was used as the reference inhibitor of calf ALP.
Antioxidant Activities
The 2,2-diphenyl-1-picryl-hydrazyl (DPPH) assay was used to study the free radical scavenging activity of synthesized compounds.17 DPPH solution was prepared by dissolving 3.92 mg of DPPH in 82% methanol of 100 mL and adding it to a glass vial, making a 2800 μL DPPH solution. This was followed by the addition of 200 μL of tested compounds leading to final concentrations of 100, 50, 25, and 10 μg/mL. Mixtures were shaken well and incubated at 25 °C in the dark for 1 h. A spectrophotometer was used to measure the absorbance at 517 nm. Ascorbic acid was used as the positive control. The test was performed in triplicates, and the percentage inhibition was measured. IC50 values were calculated by the graphical method. The following equation was used to calculate the percent inhibition.
where As is the absorbance of the sample, Ab is the absorbance of the blank, and Ac is the absorbance of the control.
Molecular Docking
Preparation of the Protein
The in silico protein–ligand interactions were studied to understand the binding mode of these ligands with the target protein alkaline phosphatase. The protein was retrieved from the protein data bank (www.rcsb.org) PDB ID: 1EW2. The protein was prepared before docking analysis by removing the water molecules, heteroatoms, and the cocrystallized ligands using MGL Tools-1.5.6, nonpolar hydrogen bonds were merged, AD4.2 type and Gasteiger charges were assigned, and proteins were saved in the .pdbqt format.
Preparation of the Ligand
The structures of synthesized ligands and standard Levimasole were drawn using ChemBioDrawUltra 14.0, and energy was minimized using MM2 using ChemBio3D Ultra 14.0. The structures were saved in the PDB format for AutoDock compatibility. The ligands were prepared by adding polar hydrogen atoms, the root was chosen for defining the torsion tree, and the number of rotatable bonds was identified. The ligand .pdb files were converted to the ligand.pdbqt format using MGL Tools-1.5.6 (The Scripps Research Institute).
AutoDock Run
The protein–ligand binding was analyzed with the help of the PyRx tool linked with AutoDock Vina to find the correct conformation and configuration of the ligands having the minimum energy structure.18 The grid box center values (center X = 43.3, Y = 23.161, Z = 9.1269, size X = 65.56, Y = 71.79, Z = 64.64) were specified for a better conformational pattern in the active binding site of the target protein. The ligands were ranked based on the lowest binding score (kcal/mol) values. The ligand binding interaction of the best conformation was visualized using Discovery Studio 4.0 and PyMOL.
Docking Validation
The validation of the docking procedure was done by redocking the best conformation of standard levimasole to the active binding site of the protein. The same protocol was used, keeping the grid parameters unchanged. The redocking confirms the exact binding of the ligand to the active site if less deviation is observed compared to the actual complex. The redocked complex was superimposed using the Discovery studio 4.0 and PyMOL 2.3 on the reference complex. The root-mean-square deviation was calculated, and a superimposed 2D image showing amino acid residues was highlighted.
QSAR Studies
The synthesized compounds were evaluated for their structure–activity relationship for their activity against alkaline phosphatase. The models were generated using QSARINS software in accordance with the OECD standards.20 Initially, the quantum molecular descriptors were calculated using PaDEL descriptor software linked to QSARINS. A total of 1445 descriptors were calculated. The descriptors were then imported into QSARINS software, and the highly correlated descriptors were excluded from the study.
Division of Data Sets
The data sets were divided according to the Kennard–Stone algorithm method into the training and test sets in a 4:1 ratio having 70% of the data in the training set and 30% in the test set.
QSAR Model Building
The models were built according to the all subset technique by adding descriptors one by one to see the overall effect of addition of new descriptors on the quality of the model. Up to eight descriptors were added to obtain the MLR models using the genetic algorithm (GA) technique. Twenty models were generated, and the best model was selected based on the lowest lack-of-fit (LOF) value.21
Validation of Models
The best model was validated by the internal and external validation methods according to the OECD principles20 and the RMSE external, Q2-F1, Q2-F2, Q2-F3, rm2, Δrm2, and CCC.
Cross-Validation
The cross-validation was performed by the leave-one-out (LOO) method, in which one compound is removed from the data set, while the model is calculated with the rest of the compounds. The parameters that were used to assess the quality of the model were R2, QLOO2, R2 – Q2, and RMSE. The leave-many-out (LMO) method was also employed for the cross-validation of the model by excluding a large number of compounds from the data set. The calculated values of R2 and Q2 (LMO), along with their averages that were close to R2 and QLOO2 values, suggested the stability of the model.
y-Scrambling
To validate whether the generated model was not due to chance correlation, the y-scrambling technique was employed. The responses were shuffled so that they were not correlated with the descriptors resulting in the poor performance of the model. The R2 and Q2 and their averages for y-scrambling should be less than the previously generated values for a good-quality model.
Applicability Domain
The domain of applicability was evaluated to confirm the consistency of the model within the chemical space it was developed.22 The leverage approach was used, and William’s plot was generated between the standardized residuals versus leverages.
Molecular Dynamic Simulation
The Desmond (2012) module of Schrodinger software was used to carry out the molecular dynamic simulation of the most active compound 4d for 200 ns.23 Based on the good binding score, the best conformation of 4d was chosen for simulation studies obtained from the molecular docking studies using the OPLS-2005 force field. While the molecular docking approach provides a static view of active compounds in the active binding site of the protein, giving a prediction of the ligand binding status, the molecular dynamic simulation employs Newton’s classical equation of motion by computing the atom movements over time. The physiological environment was used to carry out the simulation studies to predict the ligand binding mode. Initially, preprocessing of the ligand–protein binding complex was done using the Protein Preparation Wizard of Maestro, followed by optimization and minimization of complexes. In the orthorhombic box in a predefined TIP3P water model, the protein–ligand complex was bounded. The ions were added (Na+ and Cl–) to neutralize the overall charge of the system. The box volume was also minimized. The pressure and temperature were kept constant at 300 K and 1.0132 bar, and the NPT ensemble was used to perform simulations keeping in view the number of atoms, the pressure, and the time scale. The root-mean-square deviation (RMSD) was calculated for all of the trajectories to evaluate the stability of simulations.
The authors declare no competing financial interest.
Notes
All data generated or analyzed during this study are included in this published article.
References
- a De Prada P.; Loveland-Curtze J.; Brenchley J. E. Production of two extracellular alkaline phosphatases by a psychrophilic arthrobacter strain. Appl. Environ. Microbiol. 1996, 62, 3732–3738. 10.1128/aem.62.10.3732-3738.1996. [DOI] [PMC free article] [PubMed] [Google Scholar]; b Zappa S.; Rolland J.-L.; Flament D.; Gueguen Y.; Boudrant J.; Dietrich J. Characterization of a highly thermostable alkaline phosphatase from the euryarchaeon Pyrococcus abyssi. Appl. Environ. Microbiol. 2001, 67, 4504–4511. 10.1128/AEM.67.10.4504-4511.2001. [DOI] [PMC free article] [PubMed] [Google Scholar]
- Sharma U.; Pal D.; Prasad R. Alkaline phosphatase: an overview. Indian J. Clin. Biochem. 2014, 29, 269–278. 10.1007/s12291-013-0408-y. [DOI] [PMC free article] [PubMed] [Google Scholar]
- a Vincent J. B.; Crowder M. W.; Averill B. Hydrolysis of phosphate monoesters: a biological problem with multiple chemical solutions. Trends Biochem. Sci. 1992, 17, 105–110. 10.1016/0968-0004(92)90246-6. [DOI] [PubMed] [Google Scholar]; b Patel P.; Mendall M.; Carrington D.; Strachan D.; Leatham E.; Molineaux N.; Levy J.; Blakeston C.; Seymour C.; Camm A.; Northfield T. C. Association of Helicobacter pylori and Chlamydia pneumoniae infections with coronary heart disease and cardiovascular risk factors. BMJ 1995, 311, 711–714. 10.1136/bmj.311.7007.711. [DOI] [PMC free article] [PubMed] [Google Scholar]
- Schepeler T.; Reinert J. T.; Ostenfeld M. S.; Christensen L. L.; Silahtaroglu A. N.; Dyrskjøt L.; Wiuf C.; Sørensen F. J.; Kruhøffer M.; Laurberg S.; et al. Diagnostic and prognostic microRNAs in stage II colon cancer. Cancer Res. 2008, 68, 6416–6424. 10.1158/0008-5472.CAN-07-6110. [DOI] [PubMed] [Google Scholar]
- Lallès J. Intestinal alkaline phosphatase: novel functions and protective effects. Nutr. Rev. 2014, 72, 82–94. 10.1111/nure.12082. [DOI] [PubMed] [Google Scholar]
- a Ghosh N. K.; Fishman W. H. On the mechanism of inhibition of intestinal alkaline phosphatase by L-Phenylalanine I. Kinetic studies. J. Biol. Chem. 1966, 241, 2516–2522. 10.1016/S0021-9258(18)96570-1. [DOI] [PubMed] [Google Scholar]; b Hoylaerts M.; Manes T.; Millán J. Molecular mechanism of uncompetitive inhibition of human placental and germ-cell alkaline phosphatase. Biochem. J 1992, 286, 23–30. 10.1042/bj2860023. [DOI] [PMC free article] [PubMed] [Google Scholar]
- Rami C.; Patel L.; Patel C. N.; Parmar J. P. Synthesis, antifungal activity, and QSAR studies of 1,6-dihydropyrimidine derivatives. J. Pharm. Bioallied Sci. 2013, 5, 277–289. 10.4103/0975-7406.120078. [DOI] [PMC free article] [PubMed] [Google Scholar]
- a Snider B. B.; Chen J.; Patil A. D.; Freyer A. J. Synthesis of the tricyclic portions of batzelladines A, B and D. Revision of the stereochemistry of batzelladines A and D. Tetrahedron Lett. 1996, 37, 6977–6980. 10.1016/0040-4039(96)01575-4. [DOI] [Google Scholar]; b Gupta R. A.; Kaskhedikar S. G. Synthesis, antitubercular activity, and QSAR analysis of substituted nitroaryl analogs: Chalcone, pyrazole, isoxazole, and pyrimidines. Med. Chem. Res. 2013, 22, 3863–3880. 10.1007/s00044-012-0385-3. [DOI] [Google Scholar]; c Jetti S. R.; Upadhyaya A.; Jain S. 3, 4-Hydropyrimidin-2-(1 H) one derivatives: solid silica-based sulfonic acid catalyzed microwave-assisted synthesis and their biological evaluation as antihypertensive and calcium channel blocking agents. Med. Chem. Res. 2014, 23, 4356–4366. 10.1007/s00044-014-0988-y. [DOI] [Google Scholar]
- Friedman J. H. Multivariate adaptive regression splines. Ann. Stat. 1991, 19, 1–67. 10.1214/aos/1176347963. [DOI] [Google Scholar]
- Todeschini R.; Consonni V.; Maiocchi A. The K correlation index: theory development and its application in chemometrics. Chemom. Intell. Lab. Syst. 1999, 46, 13–29. 10.1016/S0169-7439(98)00124-5. [DOI] [Google Scholar]
- Consonni V.; Ballabio D.; Todeschini R. Comments on the definition of the Q 2 parameter for QSAR validation. J. Chem. Inf. Model. 2009, 49, 1669–1678. 10.1021/ci900115y. [DOI] [PubMed] [Google Scholar]
- a Chirico N.; Gramatica P. Real external predictivity of QSAR models: how to evaluate it? Comparison of different validation criteria and proposal of using the concordance correlation coefficient. J. Chem. Inf. Model. 2011, 51, 2320–2335. 10.1021/ci200211n. [DOI] [PubMed] [Google Scholar]; b Chirico N.; Gramatica P. Real external predictivity of QSAR models. Part 2. New intercomparable thresholds for different validation criteria and the need for scatter plot inspection. J. Chem. Inf. Model. 2012, 52, 2044–2058. 10.1021/ci300084j. [DOI] [PubMed] [Google Scholar]; c Lawrence I.; Lin K. A concordance correlation coefficient to evaluate reproducibility. Biometrics 1989, 255–268. 10.2307/2532051. [DOI] [PubMed] [Google Scholar]
- Ojha P. K.; Mitra I.; Das R. N.; Roy K. Further exploring rm2 metrics for validation of QSPR models. Chemom. Intell. Lab. Syst. 2011, 107, 194–205. 10.1016/j.chemolab.2011.03.011. [DOI] [Google Scholar]
- Atkinson A. C.Plots, Transformations and Regression; An Introduction to Graphical Methods of Diagnostic Regression Analysis; Oxford University Press, 1985. [Google Scholar]
- Roy K.; Kar S.; Ambure P. On a simple approach for determining applicability domain of QSAR models. Chemom. Intell. Lab. Syst. 2015, 145, 22–29. 10.1016/j.chemolab.2015.04.013. [DOI] [Google Scholar]
- Iqbal J. An enzyme immobilized microassay in capillary electrophoresis for characterization and inhibition studies of alkaline phosphatases. Anal. Biochem. 2011, 414, 226–231. 10.1016/j.ab.2011.03.021. [DOI] [PubMed] [Google Scholar]
- Bibi G.; Haq I.; Ullah N.; Mannan A.; Mirza B. Antitumor, cytotoxic and antioxidant potential of Aster thomsonii extracts. Afr. J. Pharm. Pharmacol. 2011, 5, 252–258. 10.5897/AJPP10.417. [DOI] [Google Scholar]
- Dallakyan S.; Olson A. J.. Small-Molecule Library Screening by Docking with PyRx. Chemical Biology; Springer, 2015; Vol. 1263, pp 243–250. [DOI] [PubMed] [Google Scholar]
- Worth A.; Bassan A.; De Bruijn J.; Gallegos Saliner A.; Netzeva T.; Pavan M.; Patlewicz G.; Tsakovska I.; Eisenreich S. The role of the European Chemicals Bureau in promoting the regulatory use of (Q) SAR methods. SAR QSAR Environ. Res. 2007, 18, 111–125. 10.1080/10629360601054255. [DOI] [PubMed] [Google Scholar]
- Gramatica P.; Chirico N.; Papa E.; Cassani S.; Kovarich S.. QSARINS: A New Software for the Development, Analysis, and Validation of QSAR MLR Models; Wiley Online Library, 2013. [Google Scholar]
- Tropsha A.; Gramatica P.; Gombar V. K. The importance of being earnest: validation is the absolute essential for successful application and interpretation of QSPR models. QSAR Comb. Sci. 2003, 22, 69–77. 10.1002/qsar.200390007. [DOI] [Google Scholar]
- Release, S., 1: Desmond Molecular Dynamics System, version 3.7; D. E. Shaw Research: New York, NY, 2014.; Maestro-Desmond Interoperability Tools, version, 2014, 3.


