

Abstract

In the growing field of single-molecule mechanochromism, the potential of transition metal complexes is yet to be examined. In this work, we have synthesized a series of [Cu(phen)2]+ complexes: bis-Cu(I)-phenanthroline, bis-Cu(I)-phenanthroline-2-amine, and bis-Cu(I)-phenanthroline-2-acetamide. After that, we characterized the complexes by UV–vis spectroscopy and employed density functional theory (DFT) calculations to investigate the changes in UV–vis upon mechanical pulling via force calculations. The results of our examination of time-dependent (TD)-DFT-calculated UV–vis suggests that the bis-Cu(I)-phenanthroline-2-acetamide complex is predicted to have an observable shift of the metal-to-ligand charge transfer band upon pulling from 0 to 0.6 nN in the visible region. We have demonstrated the ability to synthesize and characterize bis-Cu(I)-phenanthroline-2-acetamide. In addition, the TD-DFT calculations predict an observable shift in the visible region of the UV–vis spectrum. This indicates that transition metal complexes are feasible candidates as mechanophores and are worthy of further exploration as to their potential role in a new subclass of mechanochromic indicators.
Introduction
The incorporation of mechanophores, or compounds that are responsive to mechanical stimuli, into polymeric systems is a burgeoning area of research.1−4 One such subclass of this research is mechanochromism, wherein organic compounds, most notably spiropyrans, have dominated the field.2,5−7 Such molecules exhibit a spectral change upon applying an external mechanical force. The external force is usually transduced through a polymer and acts on a pair of target atoms of mechanically sensitive molecular fragment, the mechanophore. The induced deformation is best understood as stretching the molecule along the force vector. A similar, but a conceptually different class of mechanochromic materials uses macroscopic force acting on a polycrystalline material, often a transition metal complex.8,9 The force-induced polymorphic transition causes the change in molecular geometry, electronic structure, and spectral properties. The geometric perturbation itself is rather unpredictable, as it is a result of inter- and intramolecular interactions in a crystal lattice.
Herein, we propose the design of a new class of metal-based compounds to open up a new avenue of research based on single-molecule transition metal mechanochromic indicators.
The main design goal is to synthesize and study a deformable transition metal complex, which ultimately can be incorporated within a polymer. In order to simplify the design, the metal should coordinate two identical ligands. This is most reasonably fulfilled by two bidentate ligands around a tetra-coordinated metal.
The [Cu(phen)2]+ class of complex was selected for probing for its potential use as mechanochromic indicators for two chief reasons, the first of which is that this class of complex has a well-established history of research documenting its geometric changes associated with its photophysical properties. Copper(I) complexes have been studied extensively for their photophysical properties, namely, the family possessing two bidentate N-donor atoms, [Cu(NN)2]+.10 In particular, copper(I) phenanthroline-based complexes have been studied in depth for their potential as photosensitizers.11,12 Perhaps one of the more unique features of Cu(I) complexes is that although they formally have a 3d10, closed-shell electronic configuration in the ground state, the lowest energy triplet excited state is formally 3d9 and experiences geometric flattening.13 Additionally, in 2004, Coppens et al. documented severe geometric flattening in a [Cu(NN)2]+ complex upon photoexcitation via time-resolved X-ray diffraction.14
The second reason [Cu(NN)2]+-type complexes were chosen was because they exhibit a moderately intense metal-to-ligand charge transfer (MLCT) absorption band that occurs in the visible region.11 The UV–vis of bis-Cu(I)-phenanthroline complexes comprises intense bands due to the phenanthroline ligand in the UV region as a result of π → π* transitions.15 However, they also exhibit a weaker, yet notable, MLCT transitions in the visible region.16
The flexibility of the [Cu(phen)2]+ complexes has been observed in the crystalline state, depending on the substitution and the crystal packing. Dihedral angles between the ligands are 87° in [CuI(2,9-dibutylphen)2](ClO4), but flattens to 46° [CuI(phen)2](PF6),17 presumably due to intermolecular π-stacking interactions.
To simulate the effect of the external force, we have employed EFEI (“external force is explicitly included”), the most established method of applying force while simultaneously optimizing geometry.18−20 Use of the EFEI approach leads to the deformation of the molecule, consequentially influencing its electronic structure and altering the spectroscopic properties.
Results and Discussion
In this work, we combine a theoretical approach based on density functional theory (DFT) with experimentally observed UV–vis spectra to probe the photophysical properties of three [Cu(phen)2]+ complexes. The aim is to provide theoretical evidence, bolstered by experimental results, to show that the deformation of a tetrahedral geometry about the copper atom upon mechanical force will give rise to a change in the visible region of a UV–vis spectrum, thus introducing the design of a new class of mechanochromic indicators. The desired deformation is flattening, as a result of torque acting on the tetrahedral center, which is best achieved by the substitution in the 2 position. Applying the force on positions 4 to 7 of phenanthroline would lead to tearing the complex apart without the desired flexible deformation. However, only by first understanding the properties at the thermal limit (zero external force) will we then able to elucidate force-dependent changes.
We have synthesized three bis-Cu(I)phenanthroline complexes: bis-Cu(I)-phenanthroline (1), bis-Cu(I)-phenanthroline-2-amine (2), and bis-Cu(I)-phenanthroline-2-acetamide (3) (Figure 1). The complexes have been prepared by combining the Cu(I) source and ligand in solution and used directly for spectroscopy without isolation. Complex 3 will be the main focus of this paper, as it will serve as a model for the envisioned polymeric system. The use of bulky substituents in both the 2 and 9 positions was avoided because this has been shown to reduce the geometric flattening in phenanthroline-based Cu(I) complexes in excited states.13
Figure 1.

Structure of complexes and DFT-optimized geometries of Cu(I) of bis-Cu(I)-phenanthroline (1), bis-Cu(I)-phenanthroline-2-amine (2), and bis-Cu(I)-phenanthroline-2-acetamide (3) (copper—orange, nitrogen—blue, oxygen—red, carbon—cyan, and hydrogen—white).
Complexes 1, 2, and 3 were synthesized, and their respective experimental UV–vis spectra were recorded (Figure 2). Complex 1 is the only complex which (to our knowledge) has been described in literature.4 Our experimental UV–Vis spectrum of 1 is consistent with the most recently reported spectrum which gives a π → π* band at 33,898 cm–1 (295 nm) and an MLCT at 22,522 cm–1 (444 nm) (Figure 2).21 The experimental spectra for complexes 2 and 3 follow suit, exhibiting a strong π → π* band at 35,336 and 34,968 cm–1 and an MLCT band at 23,040 and 24,099 cm–1 for complexes 2 and 3, respectively (Figure 2).
Figure 2.
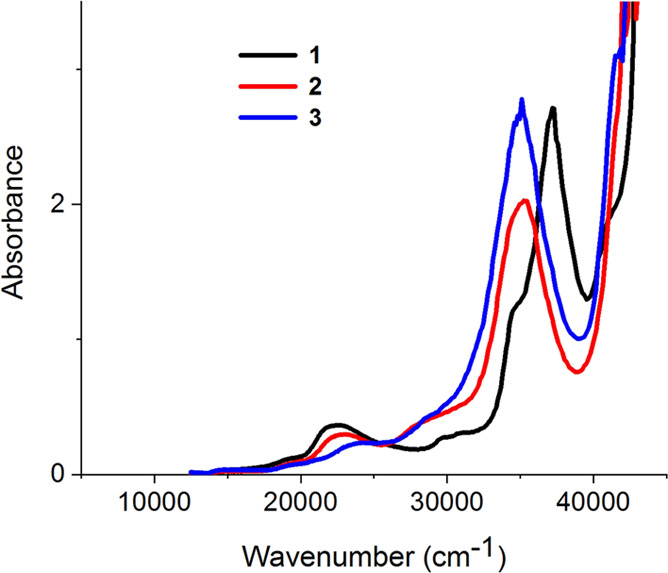
Experimental UV–vis of complexes 1 (black trace), 2 (red trace), and 3 (blue trace) (0.05 mM in dichloromethane).
Calculations have been performed in ORCA22 using the PBE023 hybrid-GGA functional and def2-SVP24 basis set. Geometry optimizations were performed on both the Cu(I) (tetrahedral) (Figure 1) and Cu(II) (pseudo-square planar) oxidation states. It is well known that [Cu(NN)2]+ complexes maintain a pseudo-tetrahedral geometry (D2d) in the ground state.13,25,26 However, when such a complex undergoes photoexcitation, the transient [Cu(NN)2]2+ species experiences a geometric flattening that has been described as a second-order pseudo-Jahn–Teller distortion resulting in a D2 geometry.27,28 As such, hereafter, we refer to the geometries as tetrahedral (D2d) and pseudo-square planar (D2). Although the main topic is to understand the behavior of [Cu(phen)2]+, the existence of its planar counterpart [Cu(phen)2]2+ leads to the question of whether the mechanical twist deformation brings the tetrahedral [Cu(phen)2]+ toward the planar [Cu(phen)2]2+ geometry or such deformation is of totally different nature. The possible deformation toward the planar Cu(II) geometry could be then observed also in the change in redox behavior.
The average Cu–N bond length for the optimized 1–3 geometries in the Cu(I) oxidation state was 2.06 Å, while the average for the Cu(II) state was slightly lower (2.01 Å). These bond lengths are in agreement with the experimentally observed X-ray absorption fine structure measurements of Cu–N bond lengths in [Cu(I)(bis-2,9-diphenyl-phenanthroline)2]+ and [Cu(II)(bis-2,9-diphenyl-phenanthroline)2]2+ of 2.02 and 1.99, respectively.28 Furthermore, the trend follows suit with lengths observed in a crystallographic study by Miller et al.29 A dihedral angle was measured for the Cu(I) and Cu(II) complexes to ascertain the magnitude of flattening that occurs upon oxidation of Cu(I); N42–Cu–N40–C24 (θ1) (Figure 3). The calculated Δ|θ1| for complexes 1, 2, and 3 upon formal oxidation of Cu was calculated to be 18.4°, 10.4°, and 14.3°, respectively. This trend follows the expectation that the flattening will be reduced upon the addition of an increasingly bulkier substituent.13 Additionally, we confirmed that regardless of the substituent on the phenanthroline ligand, the tetrahedral geometry is always preferred for the Cu(I) state and the pseudo-square planar geometry is always preferred in the Cu(II) oxidation state (Table 1). The ΔE given in Table 1 indicates an ∼8 kcal/mol preference for tetrahedral geometry for Cu(I) complexes and a ∼12 kcal/mol preference for the pseudo-square planar geometry in the Cu(II) state. An additional pseudo-square planar geometry was explored where the substituents were on opposite sides; however, the energy was 0.4 kcal/mol higher and thus the geometry where substituents were on the same side was used for all calculations (Figure S9).
Figure 3.

Structure of 1, highlighted atoms and bond represent the dihedral angle θ1 that was measured in all complexes. For comparison, optimized structures of tetrahedral Cu(I) and square planar Cu(II) complexes are shown.
Table 1. Electronic Energy Differences (kcal/mol) for Cu(I) and Cu(II) Complexes in Tetrahedral and Pseudo-Square Planar Geometry.
| Cu(I) |
Cu(II) |
|||
|---|---|---|---|---|
| D2d | D2 | D2d | D2 | |
| 1 | 0 | 8.8 | 14.1 | 0 |
| 2 | 0 | 8.2 | 11.8 | 0 |
| 3 | 0 | 8.9 | 10.8 | 0 |
UV–vis spectra were calculated using time-dependent (TD)-DFT for both Cu(I) and Cu(II) oxidation states of complexes 1–3 to compare the change in spectra in the tetrahedral and the pseudo-square planar geometry (Figure 4). As can be seen in the experimental spectrum, the MLCT bands for 1, 2, and 3 appear at 22,679, 23,040, and 24,099 cm–1, respectively. Figure 4 shows that the calculated spectra of the Cu(I) complexes with D2d geometries are consistent with the experimentally observed spectra. In addition, the overall trend of a red shift, 1 > 2 > 3, of the MLCT band that is seen in the experimental spectra is reproduced in the calculated spectra (Figure 4). In order to examine the feasibility of deforming the geometry from a tetrahedral to a pseudo-square planar, external force calculations were performed to model the mechanical force that would be applied to the complex. Complex 3 was used in order for the DFT calculations to realistically model the target system, wherein it is envisioned to be attached to a polymer (Figure 5). Although 3 is truncated at the acetamide ligand, it provides a comparable electronic picture to the target system, as shown in Figure 4.
Figure 4.

Experimental (solid trace) (0.05 mM in dichloromethane) and TD-DFT-calculated (dotted trace) UV–vis for Cu(I) series. 1—black trace, 2—red trace, and 3—blue trace.
Figure 5.

Mechanosensitive coordination polymer 4 based on [Cu(phen)2]+.
(Note: Because 1 is the most well studied of the series, it was used to test the effects of functional and basis set size and solvent on the calculated UV–vis spectrum; additional data can be found in the Supporting Information.)
To simulate the mechanical pulling effects on the UV–vis spectrum, force calculations were performed on 3 in the range of 0.1–1.0 nN, followed by TD-DFT calculations to obtain the UV–vis spectra of 3 at each force (Figures 6 and 7). The mechanical pulling was modeled by optimizing the geometry while imposing a constant external force on the C atoms on the terminal methyl group of the acetamide ligand in the Cu(I) complex. Upon pulling, there is a linear correlation between external force and the dihedral angle, θ1, which undergoes a deformation of 34.5° from 0 to 0.6 nN of force (Figure 6a). Additional pulling beyond 0.6 nN results in the destruction of the complex.
Figure 6.

(a) Correlation of θ1 as a function of external force on complex 3 and (b) electronic energy of mechanically deformed complex 3 in Cu(I) (black squares) and Cu(II) (red circles) oxidation states.
Figure 7.

TD-DFT-calculated UV–vis spectra of 3, with 0–0.6 nN of force pulling.
There is an important question of whether the mechanical deformation toward the square planar geometry could start to favor the Cu(II) oxidation state. The electronic energy, relative to the zero applied force, represents the energetic cost of complex deformation and increases monotonically for the Cu(I) state, as expected (Figure 6b). The Cu(II) potential energy curve is calculated as a single point Cu(II) energy at mechanically deformed Cu(I) geometry, relative to the fully relaxed Cu(II) square planar complex energy. The curve starts at 10.8 kcal/mol and stays approximately 8 kcal/mol higher over the whole force range. Hence, the mechanical force is not expected to significantly alter the redox behavior.
Analysis of the calculated UV–vis spectra of 3 was performed for the force range 0.1–0.6 nN—which is the greatest force where a MLCT band is still observed (Figure 7). Three bands have been identified as MLCT bands in the TD-DFT-calculated UV–Vis spectrum of 3: 20,930 cm–1 (state 1), 23,880 cm–1 (state 2), and 27,271 cm–1 (state 3) (Table 2). Analysis of the molecular orbital contributions to each state was done by examining the difference density plots30−33 of each state at forces 0–0.6 nN (animations of the difference density plots can be found in the Supporting Information). From the difference density plots, it was surmised that each state (1–3) was a result of dxy or dxz to py or pz (Figures S16–18 and Table S1). A range of functionals were also tested on 3 to verify that states 2 and 3 were not artifacts (Figure S11). Due to the broadening in the experimental MLCT band observed for 3, it is difficult to attribute states 1 and 3 to an experimental band. This may be a result of the shortcomings of TD-DFT’s ability to consistently reproduce charge transfer in excited states,30,34 but we demonstrated agreement by comparing computational and experimental data. Other methods have been introduced to address the failures of TD-DFT in excited states, but the alternatives are either nuanced35 or costly.36 However, be that as it may, all MLCT states clearly exhibit a strong shift in the visible region (Table 2 and Figure 7). Given the predicted magnitude of the shift of the MLCT bands for 3 in the visible region of the spectrum, it is expected that a color change will be observed in the physical pulling of 4.
Table 2. Wavenumber (k) in cm–1 at 0 and 0.6 nN Forces for MLCT States 1, 2, and 3 of Complex 3.
| state | k0 | k0.6 | Δk |
|---|---|---|---|
| 1 | 20,930 | 19,032 | –1898 |
| 2 | 23,880 | 25,201 | 1321 |
| 3 | 27,271 | 28,403 | 1132 |
The origin of the color change in the lowest-lying excited state has been studied in more detail. The state is dominated by the HOMO → LUMO and HOMO → LUMO+1 transitions (Figure 8). Both virtual orbitals are ligand-based p orbitals, and their shape slightly changes with increasing force and can be described as C2′ symmetric and antisymmetric, respectively. The observed red shift of the lowest-lying absorption band stems from the HOMO (copper d orbital) energy increase and small energy decrease of the first two unoccupied orbitals.
Figure 8.

Composition of the lowest-lying excited state (left) and orbital energies (right) of complex 3 as a function of force.
Although the flattening of the complex is the main process observed, the application of the external force also decreases the symmetry of the coordination sphere. This effect can be illustrated by the change in Cu–N bond lengths. At the zero applied force, the complex is slightly asymmetric, due to the acetamide substitution on the phenanthroline ligand. With increasing force, distance to the nitrogen atoms closer to the pulling point increases, while the remaining two Cu–N bonds become shorter (Figure 9).
Figure 9.

Bond lengths in complex 3 as a function of external force. The inset shows geometry and bond lengths at 0.5 nN.
The force-induced structural modifications in the metal complex are gradual, and no qualitative changes are observed. This leads mainly to change in transition energies in the UV spectra, while the intensities are mostly unaffected.
Conclusions
We have proposed a transition metal complex, which undergoes a reversible, spectroscopically observable mechanochemical deformation. The twist distortion induced by external mechanical force leads to planarization and desymmetrization of the complex. We have synthesized and characterized model complexes 1–3 and have provided theoretical evidence that indicates 3 will undergo an observable photophysical change in the visible region upon mechanical pulling. This evidence introduces a new avenue of research for mechanochromic indicators that have not been previously explored. Our future work includes incorporating 3 into a polymeric system and synthesizing and studying other phenanthroline-based transition metal complexes for their use as mechanochromic indicators.
Experimental Methods
General Remarks
1H and 13C NMR spectra were recorded on a Varian Gemini 300 HC spectrometer. The samples were measured in deuterated solvents and referenced internally to the residual nondeuterated solvent. Chemical shifts δ are denoted in ppm values, and the coupling constants of the corresponding signals J are denoted in Hz. High-resolution mass spectra were recorded on LTQ Orbitrap Velos (Thermo Scientific) under ESI+ ionization. Thin layer chromatography (TLC) analyses were conducted on TLC Silica gel 60F254 (Merck). Purification by column chromatography was carried out using silica gel Kieselgel 60 (Merck) with a granularity of 63–100 μm, or on aluminum oxide (alumina) for chromatography, neutral, Brockmann I, granularity 50–200 μm, 60A (Acros Organics). All solvents were distilled before use. The starting reagent (1,10-phenantroline) was purchased from Aldrich in 99+% purity and used without further purification. The procedure for the ligand synthesis is shown in Figure 10.
Figure 10.

Reaction scheme for the synthesis of ligands.
General Procedure for Cu+ Complexation
Tetrakis(acetonitrile)copper(I) hexafluorophosphate ([(ACN)4Cu]PF6; 1.00 equiv) as a Cu+ source was suspended in dry degassed dichloromethane (DCM, 0.5 mL) in an argon-flushed dark glass vial sealed with a rubber septum. A solution of the corresponding phenantroline-type ligand (2.00 equiv) in dry DCM (1.5 mL) was added via a syringe. The reaction mixture was mechanically stirred with a vortex for 5 min. Afterward, the solvent was evaporated directly from the reaction vessel. The vial with the solidified complex was sealed, flushed with argon via septum, and stored in dark.
1,10-Phenantroline-1-oxide
A 30% solution of hydrogen peroxide (1.0 mL; 9.8 mmol; 1.16 equiv) was added via a syringe into a solution of phenantroline (1.51 g; 8.4 mmol; 1.00 equiv) in glacial acetic acid (10 mL) and water (0.67 mL). The resulting solution was heated to 70 °C and stirred for 2 h. Afterward, another portion of 30% hydrogen peroxide (1.0 mL) was added, and the solution was further stirred for 1 h. The reaction mixture was poured on water (90 mL), neutralized with solid Na2CO3, and washed with ethyl acetate (4 × 50 mL) to remove the unreacted phenantroline. The residual aqueous layer was extracted with CHCl3 (4 × 30 mL) and dried over Na2SO4. The solvent was evaporated, and the resulting yellow solid (1.06 g; 64%) was used without further purification.
1H NMR (CDCl3): 7.46 dd, 1H, J1 = 8.22 Hz, J2 = 6.26 Hz; 7.67 dd, 1H, J1 = 8.22 Hz, J2 = 4.10 Hz; 7.74 d, 1H, J = 8.22 Hz; 7.75 d, 1H, J = 9.00 Hz; 7.81 d, 1H, J = 9.00 Hz; 8.25 dd, 1H, J1 = 8.22 Hz, J2 = 1.96 Hz; 8.74 d, 1H, J = 6.26 Hz; 9.32 dd, 1H, J1 = 4.10 Hz, J2 = 1.96 Hz.
13C NMR (CDCl3): 122.8, 123.1, 124.6, 126.4, 128.9, 129.0, 133.2, 135.9, 138.2, 140.7, 142.5, 149.9.
HR-MS (APCI+): for C12H9N2O+; calculated: 197.0709; found: 197.0708.
(1,10-Phenantrolin-2-yl)azide
Phenantroline-1-oxide (981 mg; 5.00 mmol; 1.00 equiv), diphenyl phosphoryl azide (3.44 g; 12.50 mmol; 2.50 equiv), and pyridine (831 mg; 10.5 mmol; 2.10 equiv) were mixed in an argon-flushed flask and sealed with septum. The reaction mixture was stirred at 100 °C for 3 days. The resulting suspension was cooled down to ambient temperature and diluted with methanol (30 mL). Solids were filtered off, washed with methanol, and dried on air to give the first ratio of the crude product. The combined filtrates were evaporated in vacuo, dissolved in DCM (30 mL), and washed with 1 M NaOH and water (both 30 mL). The organic layer was dried over Na2SO4 to yield the second ratio of the crude product. The collected solids were purified by column chromatography (silica gel; mobile phase DCM:methanol, 97:3) and recrystallized from the toluene/ethanol mixture to yield 708 mg (64%) of pale gray solids.
1H NMR (CDCl3): 7.76 dd, 1 H, J1 = 8.20 Hz, J2 = 4.10 Hz; 8.02 d, 1H, J = 8.79 Hz; 8.08 d, 1H, J = 8.79 Hz; 8.14 d, 1H, J = 8.79 Hz; 8.22 d, 1H, J = 8.79 Hz; 8.43 dd, 1H, J1 = 8.20 Hz, J2 = 1.76 Hz; 9.48 dd, 1H, J1 = 4.10 Hz, J2 = 1.76 Hz.
13C NMR (CDCl3): 115.1, 123.2, 125.2, 126.2, 128.3, 128.6, 129.6, 133.4, 136.4, 139.3, 148.8, 151.8.
HR-MS (APCI+): for C12H8N5+; calculated: 222.0774; found: 222.0772.
(1,10-Phenantrolin-2-yl)amine
(Phenantrolin-2-yl)azide (700 mg; 3.16 mmol; 1.00 equiv) was dissolved in a 1:1 ethanol/DCM mixture (60 mL). The resulting solution was degassed and overflown with argon before the addition of 10% Pd/C (337 mg; 0.32 mmol; 0.10 equiv). The obtained suspension was degassed again, overflown with a H2 atmosphere, and stirred at r.t. for 2 days. Pd/C was filtered off through a short celite plug, and the filtrate was evaporated in vacuo. The residual crude solids were purified by column chromatography (silica gel; mobile phase DCM:methanol, from 95:5 to 80:20) to afford 463 mg (75%) of yellowish solids.
1H NMR (CDCl3): 5.22 bs, 2H; 6.91 d, 1 H, J = 8.61 Hz; 7.50–7.55 m, 2H; 7.64 d, 1H, J = 8.61 Hz; 7.97 d, 1H, J = 8.61 Hz; 8.17 dd, 1H, J1 = 8.20 Hz, J2 = 1.76 Hz; 9.10 dd, 1H, J1 = 4.69 Hz, J2 = 1.76 Hz.
13C NMR (CDCl3): 111.9, 121.9, 122.4, 122.7, 126.4, 129.2, 135.9, 138.0, 145.0, 145.6, 149.5, 157.7.
HR-MS (APCI+): for C12H10N3+; calculated: 196.0869; found: 196.0870.
(1,10-Phenantrolin-2-yl)acetamide
Acetanhydride (61.3 mg; 0.60 mmol; 1.20 equiv) was added into a solution of (phenantrolin-2-yl)amine (97.6 mg; 0.50 mmol; 1.00 equiv) and DMAP (73.3 mg; 0.60 mmol; 1.20 equiv) in DCM (6 mL). The resulting solution was stirred at r.t. in an argon atmosphere for 6 h; then, another portion of acetanhydride (61.3 mg) was added, and the solution was stirred for 16 h. The solvent was removed in vacuo, and the crude product was purified by column chromatography (neutral alumina; mobile phase DCM:methanol, 99.5:0.5) and recrystallized from toluene to give 61 mg (51%) of yellowish crystals.
1H NMR (CDCl3): 2.26 s, 3H; 7.61 dd, 1H, J1 = 8.20 Hz, J2 = 4.10 Hz; 7.69 d, 1H, J = 8.79 Hz; 7.77 d, 1H, J = 8.79 Hz; 8.21–8.29 m, 2H; 8.61 d, 1H, J = 8.78 Hz; 8.68 bs, 1H; 9.15 dd, 1H, J1 = 4.69 Hz, J2 = 1.76 Hz.
13C NMR (CDCl3): 24.8, 115.1, 123.0, 124.8, 126.3, 129.0, 129.1, 136.3, 138.8, 144.6, 145.2, 150.0, 151.0, 169.1.
HR-MS (APCI+): for C14H13N3O+; calculated: 238.0975; found: 238.0976.
Bis-(1,10-Phenantrolin-1,10-diyl)copper(I) Hexafluorophosphate
The reaction was carried out according to the general procedure for Cu+ complexations with the following quantities of reagents: 1,10-phenantroline (11.94 mg; 66.3 mmol); [(ACN)4Cu]PF6 (12.62 mg; 33.9 mmol).
1H NMR (DMSO-d6): 8.02 bs, 4H; 8.30 bs, 4H; 8.85 bs, 4H; 9.01 bs, 4H.
HR-MS (ESI+): for C24H16N4Cu+; calculated: 423.0666; found: 423.0665.
Bis-(2-Amino-1,10-phenantrolin-1,10-diyl)copper(I) Hexafluorophosphate
The reaction was carried out according to the general procedure for Cu+ complexations with the following quantities of reagents: (1,10-phenantrolin-2-yl)amine (11.48 mg; 58.8 mmol); [(ACN)4Cu]PF6 (10.74 mg; 28.8 mmol).
1H NMR (DMSO-d6): 7.22 d, 2H, J = 8.8 Hz; 7.76 dd, 2H, J1 = 8.2 Hz, J2 = 4.5 Hz; 7.84 d, 2H, J = 8.7 Hz; 7.99 d, 2H, J = 8.7 Hz; 8.33 d, 2H, J = 8.8 Hz; 8.62 d, 2H, J = 8.3 Hz; 8.72 d, 2H, J = 4.5 Hz.
HR-MS (ESI+): for C24H18N6Cu+; calculated: 453.0884; found: 453.0884.
Bis-(2-Acetamido-1,10-phenantrolin-1,10-diyl)copper(I) Hexafluorophosphate
The reaction was carried out according to the general procedure for Cu+ complexations with the following quantities of reagents: (1,10-phenantrolin-2-yl)acetamide (12.34 mg; 51.9 mmol); [(ACN)4Cu]PF6 (9.54 mg; 25.6 mmol).
1H NMR (CD2Cl2): 2.28s, 6H; 8.22m, 2H, 8.44m, 2H; 8.58m, 4H; 9.13m, 4H; 9.25m, 2H; 2.94m, 2H.
HR-MS (ESI+): for C28H22N6O2Cu+; calculated: 537.1095; found: 537.1092.
Acknowledgments
This work was funded by the Czech Science Foundation, Project No. 18-17187Y.
Supporting Information Available
The Supporting Information is available free of charge at https://pubs.acs.org/doi/10.1021/acsomega.1c05279.
NMR spectra, computational details, and spectra and coordinates of stationary points (PDF)
The authors declare no competing financial interest.
Supplementary Material
References
- Caruso M. M.; Davis D. A.; Shen Q.; Odom S. A.; Sottos N. R.; White S. R.; Moore J. S. Mechanically-Induced Chemical Changes in Polymeric Materials. Chem. Rev. 2009, 109, 5755–5798. 10.1021/cr9001353. [DOI] [PubMed] [Google Scholar]
- Zhang H.; Gao F.; Cao X.; Li Y.; Xu Y.; Weng W.; Boulatov R. Mechanochromism and Mechanical-Force-Triggered Cross-Linking from a Single Reactive Moiety Incorporated into Polymer Chains. Angew. Chem., Int. Ed. 2016, 55, 3040–3044. 10.1002/anie.201510171. [DOI] [PubMed] [Google Scholar]
- Chen Y.; Spiering A. J. H.; Karthikeyan S.; Peters G. W. M.; Meijer E. W.; Sijbesma R. P. Mechanically Induced Chemiluminescence from Polymers Incorporating a 1,2-Dioxetane Unit in the Main Chain. Nat. Chem. 2012, 4, 559–562. 10.1038/nchem.1358. [DOI] [PubMed] [Google Scholar]
- Davis D. A.; Hamilton A.; Yang J.; Cremar L. D.; Van Gough D.; Potisek S. L.; Ong M. T.; Braun P. V.; Martínez T. J.; White S. R.; et al. Force-Induced Activation of Covalent Bonds in Mechanoresponsive Polymeric Materials. Nature 2009, 459, 68–72. 10.1038/nature07970. [DOI] [PubMed] [Google Scholar]
- Li M.; Zhang Q.; Zhou Y.-N.; Zhu S. Let Spiropyran Help Polymers Feel Force!. Prog. Polym. Sci. 2018, 79, 26–39. 10.1016/j.progpolymsci.2017.11.001. [DOI] [Google Scholar]
- Kim T. A.; Robb M. J.; Moore J. S.; White S. R.; Sottos N. R. Mechanical Reactivity of Two Different Spiropyran Mechanophores in Polydimethylsiloxane. Macromolecules 2018, 51, 9177–9183. 10.1021/acs.macromol.8b01919. [DOI] [Google Scholar]
- Gossweiler G. R.; Hewage G. B.; Soriano G.; Wang Q.; Welshofer G. W.; Zhao X.; Craig S. L. Mechanochemical Activation of Covalent Bonds in Polymers with Full and Repeatable Macroscopic Shape Recovery. ACS Macro Lett. 2014, 3, 216–219. 10.1021/mz500031q. [DOI] [PubMed] [Google Scholar]
- Han J.; Tang K.-M.; Cheng S.-C.; Ng C.-O.; Chun Y.-K.; Chan S.-L.; Yiu S.-M.; Tse M.-K.; Roy V. A. L.; Ko C.-C. Mechanochemical Changes on Cyclometalated Ir(Iii) Acyclic Carbene Complexes – Design and Tuning of Luminescent Mechanochromic Transition Metal Complexes. Inorg. Chem. Front. 2020, 7, 786–794. 10.1039/C9QI01278H. [DOI] [Google Scholar]
- Seki T.; Takamatsu Y.; Ito H. A Screening Approach for the Discovery of Mechanochromic Gold(I) Isocyanide Complexes with Crystal-to-Crystal Phase Transitions. J. Am. Chem. Soc. 2016, 138, 6252–6260. 10.1021/jacs.6b02409. [DOI] [PubMed] [Google Scholar]
- Armaroli Photoactive Mono- and Polynuclear Cu(i)–Phenanthrolines. A Viable Alternative to Ru(Ii)–Polypyridines?. Chem. Soc. Rev. 2001, 30, 113–124. 10.1039/b000703j. [DOI] [Google Scholar]
- Zhang Y.; Schulz M.; Wächtler M.; Karnahl M.; Dietzek B. Heteroleptic Diimine–Diphosphine Cu(I) Complexes as an Alternative towards Noble-Metal Based Photosensitizers: Design Strategies, Photophysical Properties and Perspective Applications. Coord. Chem. Rev. 2018, 356, 127–146. 10.1016/j.ccr.2017.10.016. [DOI] [Google Scholar]
- Zhang Y.; Traber P.; Zedler L.; Kupfer S.; Gräfe S.; Schulz M.; Frey W.; Karnahl M.; Dietzek B. Cu(I) vs. Ru(II) Photosensitizers: Elucidation of Electron Transfer Processes within a Series of Structurally Related Complexes Containing an Extended π-System. Phys. Chem. Chem. Phys. 2018, 20, 24843–24857. 10.1039/C8CP04595J. [DOI] [PubMed] [Google Scholar]
- Everly R. M.; Ziessel R.; Suffert J.; McMillin D. R. Steric Influences on the Photoluminescence from Copper(I) Phenanthrolines in Rigid Media. Inorg. Chem. 1991, 30, 559–561. 10.1021/ic00003a041. [DOI] [Google Scholar]
- Coppens P.; Vorontsov I. I.; Graber T.; Kovalevsky A. Y.; Chen Y.-S.; Wu G.; Gembicky M.; Novozhilova I. V. Geometry Changes of a Cu(I) Phenanthroline Complex on Photoexcitation in a Confining Medium by Time-Resolved X-Ray Diffraction. J. Am. Chem. Soc. 2004, 126, 5980–5981. 10.1021/ja049781k. [DOI] [PubMed] [Google Scholar]
- Armaroli N.; Cola L. D.; Balzani V.; Sauvage J.-P.; Dietrich-Buchecker C. O.; Kern J.-M. Absorption and Luminescence Properties of 1, 10-Phenanthroline, 2, 9-Diphenyl-1, 10-Phenanthroline, 2,9-Dianisyl-1, 10-Phenanthroline and Their Protonated Forms in Dichloromethane Solution. J. Chem. Soc., Faraday Trans. 1992, 88, 553–556. 10.1039/FT9928800553. [DOI] [Google Scholar]
- McMillin D. R.; Buckner M. T.; Ahn B. T. A Light-Induced Redox Reaction of Bis(2,9-Dimethyl-1,10-Phenanthroline)Copper(I). Inorg. Chem. 1977, 16, 943–945. 10.1021/ic50170a046. [DOI] [Google Scholar]
- Xu F.; Tao T.; Zhang K.; Wang X.-X.; Huang W.; You X.-Z. C–C Bond Cleavage in Acetonitrile by Copper(II)–Bipyridine Complexes and in Situ Formation of Cyano-Bridged Mixed-Valent Copper Complexes. Dalton Trans. 2013, 42, 3631–3645. 10.1039/C2DT32281A. [DOI] [PubMed] [Google Scholar]
- Ribas-Arino J.; Marx D. Covalent Mechanochemistry: Theoretical Concepts and Computational Tools with Applications to Molecular Nanomechanics. Chem. Rev. 2012, 112, 5412–5487. 10.1021/cr200399q. [DOI] [PubMed] [Google Scholar]
- Ribas-Arino J.; Shiga M.; Marx D. Understanding Covalent Mechanochemistry. Angew. Chem., Int. Ed. 2009, 48, 4190–4193. 10.1002/anie.200900673. [DOI] [PubMed] [Google Scholar]
- Ribas-Arino J.; Shiga M.; Marx D. Unravelling the Mechanism of Force-Induced Ring-Opening of Benzocyclobutenes. Chem. – Eur. J. 2009, 15, 13331–13335. 10.1002/chem.200902573. [DOI] [PubMed] [Google Scholar]
- Soria-Castro S. M.; Andrada D. M.; Caminos D. A.; Argüello J. E.; Robert M.; Peñéñory A. B. Mechanistic Insight into the Cu-Catalyzed C–S Cross-Coupling of Thioacetate with Aryl Halides: A Joint Experimental–Computational Study. J. Org. Chem. 2017, 82, 11464–11473. 10.1021/acs.joc.7b01991. [DOI] [PubMed] [Google Scholar]
- Neese F. The ORCA Program System. Wiley Interdiscip. Rev.: Comput. Mol. Sci. 2012, 2, 73–78. 10.1002/wcms.81. [DOI] [Google Scholar]
- Adamo C.; Barone V. Toward Reliable Density Functional Methods without Adjustable Parameters: The PBE0 Model. J. Chem. Phys. 1999, 110, 6158–6170. 10.1063/1.478522. [DOI] [Google Scholar]
- Weigend F.; Ahlrichs R. Balanced Basis Sets of Split Valence, Triple Zeta Valence and Quadruple Zeta Valence Quality for H to Rn: Design and Assessment of Accuracy. Phys. Chem. Chem. Phys. 2005, 7, 3297–3305. 10.1039/B508541A. [DOI] [PubMed] [Google Scholar]
- Shinozaki K.; Kaizu Y. Structure and State-Energy Relationship of Photo-Excited Cu(I) Complex. Bull. Chem. Soc. Jpn. 1994, 67, 2435–2439. 10.1246/bcsj.67.2435. [DOI] [Google Scholar]
- Eggleston M. K.; McMillin D. R.; Koenig K. S.; Pallenberg A. J. Steric Effects in the Ground and Excited States of Cu(NN)2+ Systems. Inorg. Chem. 1997, 36, 172–176. 10.1021/ic960698a. [DOI] [Google Scholar]
- Chen L. X.; Shaw G. B.; Novozhilova I.; Liu T.; Jennings G.; Attenkofer K.; Meyer G. J.; Coppens P. MLCT State Structure and Dynamics of a Copper(I) Diimine Complex Characterized by Pump–Probe X-Ray and Laser Spectroscopies and DFT Calculations. J. Am. Chem. Soc. 2003, 125, 7022–7034. 10.1021/ja0294663. [DOI] [PubMed] [Google Scholar]
- Mara M. W.; Jackson N. E.; Huang J.; Stickrath A. B.; Zhang X.; Gothard N. A.; Ratner M. A.; Chen L. X. Effects of Electronic and Nuclear Interactions on the Excited-State Properties and Structural Dynamics of Copper(I) Diimine Complexes. J. Phys. Chem. B 2013, 117, 1921–1931. 10.1021/jp311643t. [DOI] [PubMed] [Google Scholar]
- Miller M. T.; Gantzel P. K.; Karpishin T. B. Structures of the Copper(I) and Copper(II) Complexes of 2,9-Diphenyl-1,10-Phenanthroline: Implications for Excited-State Structural Distortion. Inorg. Chem. 1998, 37, 2285–2290. 10.1021/ic971164s. [DOI] [PubMed] [Google Scholar]
- Dreuw A.; Head-Gordon M. Single-Reference Ab Initio Methods for the Calculation of Excited States of Large Molecules. Chem. Rev. 2005, 105, 4009–4037. 10.1021/cr0505627. [DOI] [PubMed] [Google Scholar]
- Plasser F.; Bäppler S. A.; Wormit M.; Dreuw A. New Tools for the Systematic Analysis and Visualization of Electronic Excitations. II. Applications. J. Chem. Phys. 2014, 141, 024107 10.1063/1.4885820. [DOI] [PubMed] [Google Scholar]
- Plasser F.; Wormit M.; Dreuw A. New Tools for the Systematic Analysis and Visualization of Electronic Excitations. I. Formalism. J. Chem. Phys. 2014, 141, 024106 10.1063/1.4885819. [DOI] [PubMed] [Google Scholar]
- Head-Gordon M.; Grana A. M.; Maurice D.; White C. A. Analysis of Electronic Transitions as the Difference of Electron Attachment and Detachment Densities. J. Phys. Chem. 1995, 99, 14261–14270. 10.1021/j100039a012. [DOI] [Google Scholar]
- Dreuw A.; Head-Gordon M. Failure of Time-Dependent Density Functional Theory for Long-Range Charge-Transfer Excited States: The Zincbacteriochlorin–Bacteriochlorin and Bacteriochlorophyll–Spheroidene Complexes. J. Am. Chem. Soc. 2004, 126, 4007–4016. 10.1021/ja039556n. [DOI] [PubMed] [Google Scholar]
- Stein T.; Kronik L.; Baer R. Reliable Prediction of Charge Transfer Excitations in Molecular Complexes Using Time-Dependent Density Functional Theory. J. Am. Chem. Soc. 2009, 131, 2818–2820. 10.1021/ja8087482. [DOI] [PubMed] [Google Scholar]
- Dutta A. K.; Nooijen M.; Neese F.; Izsák R. Exploring the Accuracy of a Low Scaling Similarity Transformed Equation of Motion Method for Vertical Excitation Energies. J. Chem. Theory Comput. 2018, 14, 72–91. 10.1021/acs.jctc.7b00802. [DOI] [PubMed] [Google Scholar]
Associated Data
This section collects any data citations, data availability statements, or supplementary materials included in this article.