

Abstract

Undoped and Nb-doped TiO2 nanocrystals are prepared by a microwave-assisted non-aqueous sol–gel method based on a slow alkyl chloride elimination reaction between metal chlorides and benzyl alcohol. Sub-4 nm nanoparticles are grown under microwave irradiation at 80 °C in only 3 h with precise control of growth parameters and yield. The obtained nanocrystals could be conveniently used to cast compact TiO2 or Nb-doped TiO2 electron transport layers for application in formamidinium lead iodide-based photovoltaic devices. Niobium doping is found to improve the cell performance by increasing the conductivity and mobility of the electron transport layer. At the same time, a measurable decrease in parasitic light absorption in the low wavelength portion of the spectrum was observed.
1. Introduction
One of the efficient ways to address the increasing energy demand and to mitigate the environmental issues caused by excessive use of fossil fuels is to expedite the utilization of low carbon footprint, ecofriendly and high-performance materials for decarbonization,1,2 and renewable energy conversion and storage applications. Metal oxide materials are promising materials for sustainable energy applications and are widely used as active components of solar cells,3,4 photocatalysts,5−8 sensors, and other electronic devices.9−11 Compared to their bulk counterparts, nanostructured oxide materials have received great interest in academia and industry due to their distinctive optoelectronic properties.12,13 In particular, titania nanoparticles (NPs), nanocrystals (NCs), nanowires, nanorods, and hierarchical nanostructures have been widely used in catalysis,14−16 photocatalysis,17,18 energy conversion,10,11,19,20 energy storage,21−24 and gas sensing25,26 applications. Anatase TiO2 NPs grown at low temperatures are excellent starting materials for the fabrication of compact TiO2 films as electron transport layers in halide perovskite solar cells.10,11,19,27−29 Heterometallic doping was also introduced to improve the electron mobility of the oxide films and, in turn, reduce the series resistance of the device.27,30,31 The power conversion efficiencies obtained for solar cells fabricated utilizing anatase nanoparticles are comparable to or better than cells based on solution-processed compact or mesoporous titania.10,11,19,32−34 Various bulk and nanoscale TiO2 materials were synthesized by solution-based methods such as aqueous sol–gel.35−39 However, aqueous sol–gel chemistry is quite complex due to the large number of reaction parameters that have to be carefully controlled (hydrolysis and the condensation rate of the metal oxide precursors, pH, temperature, method of mixing, rate of oxidation, the nature and concentration of anions, etc.).40,41 Another fundamental problem of aqueous sol–gel chemistry is that the as-synthesized precipitates are generally amorphous and need a postsynthetic thermal treatment involving high temperatures (T ≥ 500 °C) for proper crystallization. On the other hand, non-aqueous solution routes are able to overcome these issues through non-hydrolytic processes, which drastically decrease the reaction rates and lead to controlled crystallization.42,43 The application of the non-aqueous sol–gel (NASG) route or glycothermal synthesis, involving condensation reactions of metal precursors and high-boiling alcohols to grow metal oxide NPs, was reported by Bourget et al.42 and by Niederberger et al.43 Several binary, ternary, and mixed metal oxides NPs were prepared by this method.3,44−46 In addition, metal sulfides NPs were also prepared using a non-hydrolytic thio-sol-gelmethod.47,48 This methodology yields sub-5 nm scale NPs that do not need surfactant stabilization to remain dispersed in mildly polar solvents such as ethanol or isopropanol. TiO2 and other doped or undoped oxide NPs were synthesized in the past by the NASG approach, and the obtained materials were successfully used for energy conversion,49 gas sensing,50 catalysis,45,46,51 and energy storage applications.23,24 Although the traditional NASG synthesis of TiO2-NCs is typically carried out at 80 °C under inert conditions, the particle growth is time-consuming, i.e., in general, the production of a few hundreds of milligrams of material by this technique may take 1 day or more.10,44−46,52,53 The microwave-assisted nonaqueous sol–gel (MW-NASG) synthesis leads to shorter reaction times and increases the TiO2-NC production scale.54,55
We report on the microwave-assisted non-hydrolytic-synthesis of TiO2 and Nb-doped TiO2 (Nb:TiO2) NCs. We demonstrate that it is possible to specifically produce TiO2 and Nb:TiO2 NCs suitable for the fabrication of an electron transport layer in organohalide perovskite solar cells based on formamidinium lead triiodide perovskite (FAPbI3) as light absorbers by exploiting the microwave-assisted nonhydrolytic route. The resulting devices showed external quantum efficiency (EQE) comparable to devices based on electron transport layers deposited from NCs grown by the traditional route, i.e., aqueous sol–gel. Furthermore, it was demonstrated that the incorporation of niobium in anatase TiO2 has a beneficial effect on cell performance. The efficiency improvement obtained by the Nb doping of a TiO2 ETM layer in a halide perovskite solar cell is explained in terms of enhanced carrier mobility and higher conductivity of the ETL, which are investigated by current density–voltage (J/V) characterization and electrochemical impedance spectroscopy (EIS), as well as by a reduction of the parasitic light absorption in the low wavelength spectral region (near-UV).
2. Results and Discussion
2.1. Characterization of TiO2 and Nb:TiO2 Nanocrystals
2.1.1. Transmission Electron Microscopy (TEM) Characterization
Low-resolution transmission electron microscopy (TEM) images of TiO2 and Nb:TiO2-NCs drop-cast from an ethanol solution on a TEM copper grid are shown in Figure 1a,e. The images reveal the tendency of the particles to aggregate in the dry form. Referring to the scale bar, it is evident that the aggregate size is far below 10 nm. High-resolution (HR)TEM images (in Figure 1b,c,f,g) demonstrate that the NCs have a size span of 2.5–5 nm without a regular aspect ratio. A statistical analysis of the size of TiO2-NCs (3.48 ± 0.1 nm) and Nb:TiO2-NCs (3.15 ± 0.03 nm) is reported in the histograms shown in Figure 1d and h for TiO2 and Nb:TiO2, respectively. Compositional analysis of Nb:TiO2-NCs made by energy-dispersive spectrometry (EDS)-TEM shows that the concentration of niobium is 3 wt % (Figure S1). This concentration is lower than the nominal initial 5 wt % utilized to synthesize the NCs, which is probably due to a lower reactivity of NbCl5 with respect to TiCl4. The HRTEM images show that both doped and undoped as-synthesized NCs are highly crystalline (see selected area electron diffraction (SAED) patterns in Figure S2), confirming that the short-time microwave irradiation could provide TiO2-NCs with similar characteristics as NCs grown by the classical NASG method.10,11,19
Figure 1.

(a) Low-resolution TEM images of TiO2-NCs. (b,c) High-resolution TEM images of TiO2-NCs with two different magnifications. (d) Histograms of size distribution of TiO2-NCs obtained from TEM images. (e) Low-resolution TEM images of Nb:TiO2-NCs. (f,g) High-resolution TEM images of Nb:TiO2-NCs with two different magnifications. (h) Histograms of size distribution of Nb:TiO2-NCs obtained from TEM images.
2.1.2. Powder X-ray Diffraction (XRD) Characterization
XRD diffractograms (Figure 2) of the Nb-doped and undoped TiO2-NC powder revealed that both as-synthesized NCs have an anatase crystalline structure with typical diffraction peaks occurring at 2θ = 25.25° {101}, 2θ = 37.8° {004}, 2θ = 47.9° {200}, 2θ = 53.59° {105}, and 2θ = 62.36° {204}. The slight asymmetry of the (105) peaks at 53.59° might be attributed to the presence of traces of the rutile phase.56 However, other rutile peaks are totally absent or could be covered by the dominant anatase peaks due to their high broadness. For TiO2-NCs, the intensity ratios of the peaks follow calculated database values, and the recorded diffractogram compares very well to other reports.10,24,57 In the Nb-doped TiO2-NC XRD pattern, the positions of the observed peaks as well as their relative intensities remain unaltered.58 This can be attributed to the relatively low Nb-doping level.
Figure 2.
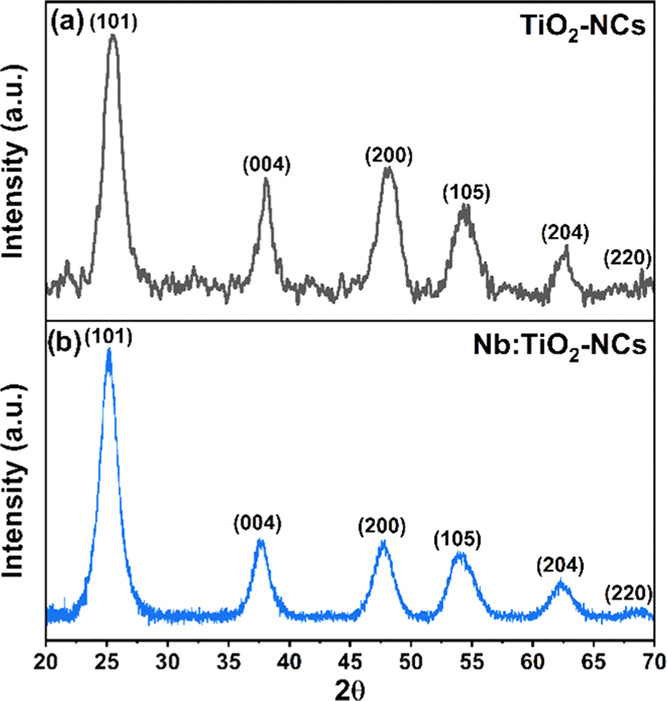
Powder XRD patterns of (a) TiO2 and (b) Nb:TiO2-NCs. The family of planes responsible for the diffraction peaks include {101} at 2θ = 25.25°, {004} at 2θ = 37.8°, {200} at 2θ = 47.9°, {105} at 2θ = 53.59°, and {204} at 2θ = 62.36°.
2.1.3. UV–Vis Optical Absorption Spectroscopy of Nanocrystals
The absorption of (Nb:)TiO2-NC dispersions in ethanol are shown in Figures 3, whereas the absorption of the same NCs deposited as thin films by spin coating on quartz slides are shown in S3. Optical transmission spectra of the same NC films are shown in Figure S4. The estimated absorption onsets for the NC dispersion are λonset(TiO2) = 332.7 nm and λonset(Nb:TiO2) = 328 nm. It is evident that the Nb doping blue shifts the TiO2 absorption edge. However, simple UV–vis absorption measurements in transmission mode of NC dispersions are not sufficient to estimate the band gap of the nanomaterial. For this reason, diffuse reflectance spectroscopy measurements on a thin film of NCs were carried out (vide infra).
Figure 3.
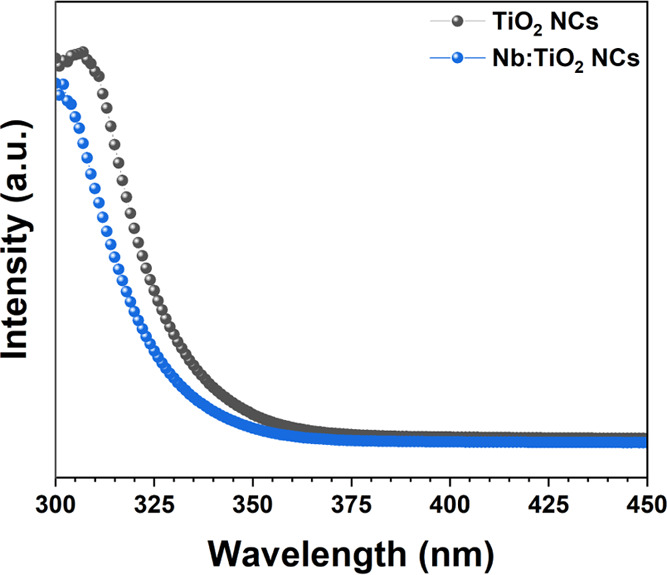
Optical absorption of TiO2-NC and Nb:TiO2-NC dispersions in ethanol.
2.2. Characterization of the Thin Film
2.2.1. Scanning Electron Microscopy (SEM) Characterization of the Films
The Nb-doped and undoped titania film morphology is further characterized by scanning electron microscopy (SEM). High- and low-resolution SEM images, shown in Figure 4, reveal a good homogeneity of the films obtained after sintering at 150 °C. The thickness of the films is estimated via SEM cross-sectional images of the photovoltaics device on the fracture side. TiO2 and Nb:TiO2 films have a comparable thickness of around 50 nm and a very compact morphology. The film does not show any localized aggregation of NCs but rather a compact and uniform assembly of the NCs into a thin film. The TiO2 film’s compactness and the lack of pinholes are critical for its usage as an ETL in solar cells because they prevent infiltration of the photoactive material (FAPbI3), which would cause the entire device to shunt.
Figure 4.

High-resolution (a, c) and low-resolution (b, d) SEM images of TiO2 and Nb:TiO2-NC films deposited on ITO after the films were annealed at 150 °C.
2.2.2. UV–Vis Optical Absorption Spectroscopy of Thin Films
The optical properties of the TiO2-NC and Nb:TiO2-NC films were studied by UV–vis diffuse reflectance spectroscopy. The Kubelka–Munk function and the Tauc plot of TiO2-NCs Nb:TiO2-NC films are shown in Figure 5a, 5b, respectively. The estimated absorption onsets (Kubelka–Munk plots) for NC films are λonset(TiO2) = 311.2 nm and λonset(Nb:TiO2) = 317.5 nm. From the linear interpolation of Tauc’s plot in Figure 5b, it can be found that Nb doping slightly shifts the band gap of the TiO2-NC film from 3.69 to 3.8 eV. The TiO2 single-crystal indirect band gap is reported to be 3.47 eV, whereas the direct band gap is 3.97 eV.13 However, due to the variable defect concentrations that can vary from sample to sample, mainly depending on the synthetic method utilized, the anatase TiO2 band gap is reported to range from 3.14 to 3.5 eV.59 On the other hand, for TiO2, the quantum size effect has been shown to occur only for NPs as small as 2R ≤ 1.5 nm,12 (R = nanoparticle radius), thus, an NC size range below that of the reported in this work. Therefore, in the present case, the quantum size effect is not responsible for the blue shift of the TiO2 absorption edge. This behavior is also backed up by ab initio calculations that indicate that neither an increase or decrease of the band gap nor an appearance of intraband states takes place,60−62 although a shift of the Fermi level toward the conduction band due to an excess of electrons in the crystal is expected.62 Hence, the major role in blue shifting of the absorption band edge is attributed to plasmonic resonance due to the excess of charges in the CB induced by the Nb doping.63
Figure 5.

(a) Kubelka–Munk function of TiO2-NC and Nb:TiO2-NC films on glass and (b) Tauc’s plot of TiO2-NC and Nb:TiO2-NC films on the glass substrate.
In addition, the relatively small blue shift of the observed absorption onset for the film in respect of the dispersion is probably due to the measurement methodology used, i.e., diffuse reflectance spectroscopy in the first case, absorption in transmission for the latter. Tauc’s plot of the FAPbI3 film deposited on quartz and crystallized following the same procedure used for the photovoltaic device is shown in Figure S5. By linear regression of Tauc’s plot, the band gap was estimated to be 1.48 eV. As expected, this value is in line with the literature reported value for the polycrystalline thin film59 and is a bit higher than the band gap of the single crystal.64 For comparison, Tauc’s plot of extensively used MAPbI3 is also reported, providing a 1.58 eV band gap (Figure S5).
2.2.3. X-ray Photoelectron Spectroscopy (XPS) Characterization of Thin Films
XPS compositional analysis of TiO2 and Nb-doped TiO2-NC thin films, deposited on glass/ITO substrates (Figure 6), reveals the presence of niobium in the doped TiO2 film (Figure 6c). The observed doublets at 365.9 and 381 eV (Figure 6e) as well as at 207.6 and 210.4 eV (Figure 6d) correspond to Nb 3d and Nb 3p core level emissions of oxygen hexacoordinated niobium (NbO6–) in the Nb5+ oxidation state65 rather than Nb4+ and Nb3+.66 The observed N 1s and C 1s signals are due to synthesis-related impurities, as it is the case for sulfur- and chlorine-containing species, as in the case of sulfur- and chlorine-containing species, as those are also present in the bare undoped TiO2 film (cf. Figure 6a,b). The presence of Nb4N5 was excluded as it displays the Nb 3d5/2 core level at ca. 204 eV rather than the measured value of 207.6 eV.66
Figure 6.

XPS survey spectra of TiO2 (a) and (b) expansion of the spectral area containing Ti 2p3/2 and Ti 2p1/2 peaks. The XPS survey of Nb:TiO2 NC films deposited on the ITO substrate (c) and expansion of the Nb 3d (d) and Nb 3p (e) core level emissions.
2.2.4. UV Photoelectron Spectroscopy (UPS) Characterization of Thin Films
UPS spectra of TiO2 and Nb:TiO2 thin films deposited on glass/ITO substrates are shown in Figure 7. The determined high binding energy cutoffs (EHBEC) are 17.24 and 17.13 eV, respectively, yielding a work function of 3.98 and 4.09 eV, respectively. The valence band (VB) onsets wrt to the Fermi level (EF) are estimated to be 3.50 eV for TiO2 and 3.41 eV for Nb:TiO2, which yields ionization energies (IEs) of 7.48 and 7.50 eV, respectively. These values are similar to IEs reported for compact rutile TiO2-NCs prepared in a hydrolytic sol–gel process.67 However, the VB onsets are slightly higher here, indicating that the microwave-assisted synthesis yields TiO2 films being more n-type.59 As estimated from optical measurements via Tauc’s plot shown in Figure 5b, the (optical) gaps are 3.69 eV for TiO2 and 3.80 eV for Nb:TiO2, i.e., the conduction band minima (CBM) are 3.79 and 3.70 eV below the vacuum level, and thus, only a few tens of meV each above the Fermi level. Since these values match well the CBMs of MAPbI368 and FAPbI3,69 it is expected that the synthesized films are suitable as ETL in corresponding perovskite solar cells, as demonstrated in section 2.4.
Figure 7.
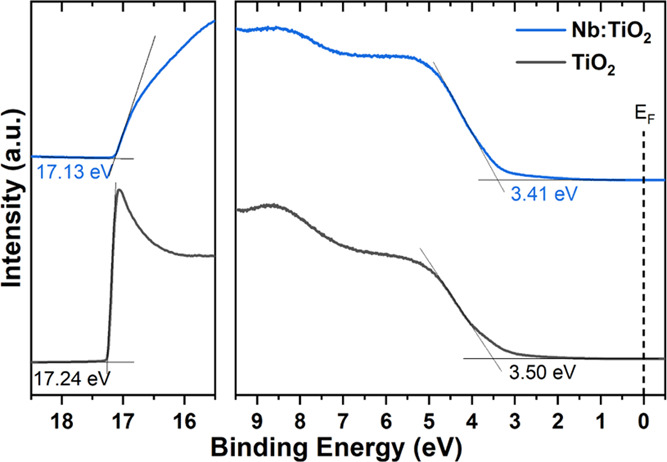
UPS spectrum of TiO2 and Nb:TiO2 films on ITO substrates.
2.3. Characterization of Electronic Transport Properties of the Films
2.3.1. Electrochemical Measurement of the Electron Mobility and Conductivity of TiO2 and Nb:TiO2 Films
The conductivity and the electron mobility of the TiO2 and Nb:TiO2 films were measured by electrochemical impedance spectroscopy (EIS) carried out in an electrolytic medium and by solid-state current–voltage (J/V) characterization. The results of the latter measurements are shown in Table 1.
Table 1. Conductivity and Mobility Values for TiO2 and Nb:TiO2 Films.
| EIS |
solid-state J–V |
|||
|---|---|---|---|---|
| sample | σ (S/cm) | μ (cm2/V s) | σ (S/cm) | μ (cm2/V s) |
| TiO2 | 3.02 × 10⁻⁷ | 2.84 × 10⁻² | 5.59 × 10⁻⁶ | 3.51 × 10⁻³ |
| Nb:TiO2 | 4.06 × 10⁻⁷ | 3.27 × 10⁻² | 1.69 × 10⁻⁵ | 3.75 × 10⁻³ |
Figure S6 shows the Nyquist plots of the TiO2 and Nb:TiO2 films obtained by spin-coating six layers of (Nb:)TiO2-NCs on ITO-coated glass. The equivalent circuit of the fabricated layer on ITO and immersed in the electrolytic medium is shown in Scheme 1.
Scheme 1. Equivalent Circuit of the Device/Electrolytic Solution Interface.

In Scheme 1, R1 is the resistance of the ITO substrate (negligible), R2 is the resistance of the (Nb:)TiO2 film, R3 is the resistance of the electrolytic solution, C1 is the ITO/(Nb:)TiO2 interface capacitance, and C2 = Cμ is the capacitance of the electrolyte/(Nb:)TiO2 interface, namely, chemical capacitance. The values of conductivity (σ) were estimated from the EIS measurements using the σ = L/RA relation, where L is the (Nb:)TiO2 film thickness, A is the device area, and R is the extracted resistance from the impedance (R2 in Scheme 1). The calculated conductivity values reported in Table 1 suggest that Nb doping results in increased conductivity.
Electron mobility (μ) was also extracted from EIS data using the Stoke–Einstein diffusion relation70
| 1 |
where e is the elementary charge of the electron, kB is Boltzmann’s constant, and T is the absolute temperature in Kelvin and it is taken to be the room temperature (298 K). The electron (chemical) diffusion coefficient (Dn) was obtained from the fitting of the Nyquist plot through the equation
| 2 |
where Ln is the electron diffusion length, τn is the period of the charge transfer process as well as electron lifetime, and Rt is the charge transfer resistance (Rt = R2 and C2 = Cμ in Scheme 1). The calculated μEIS values reported in Table 1 also show evidence of the improvement in electrical transport properties imparted by Nb doping.
2.3.2. Solid-State J/V Measurement of the Mobility and Conductivity of TiO2 and Nb:TiO2 Films
In addition to EIS, σ and μ of TiO2 and Nb:TiO2 films were also estimated from the J/V characteristics of solid-state devices. The J/V characteristics on a linear scale with the linear fit in the Ohmic region of the devices are shown in Figure S7, whereas those on a double logarithmic scale with the fit in the space-charge-limited current (SCLC) region are shown in Figure S8.
The σ values were extracted from the linear equation fitting the J/V curve in the Ohmic region by J = V/RA with σ = L/RA, where R is the resistance, A is the area of the device determined by the crossing between the top and bottom metal contacts (0.04 cm2), and d is the distance between the two electrodes, i.e., the thickness of the (Nb:)TiO2 film measured by a profilometer. As can be seen from the values of σ reported in Table 1, Nb doping improves the conductivity of the TiO2 film by a factor of about 2.5. The values of mobility (μSCLC) were obtained by fitting the experimental data in the trap-free SCLC region (V ≈ 4 V) by the Mott–Gurney equation (Figure S8a,b)71
| 3 |
where ε0 is the permittivity of vacuum and εr is the dielectric constant of the material [εr(TiO2) = 16].72 The calculated μ values are reported in Table 1 that further corroborate that Nb doping can improve the electrical transport properties of TiO2.
The data from both EIS and J/V characteristics consistently show that doping by Nb can result in the improvement of electrical transport properties in the prepared TiO2 films. The improvement of both conductivity and mobility can be ascribed to the excess electrons spilling into the conduction band caused by the introduction of Nb5+ ions in place of Ti4+ ions in the TiO2 crystal (n-doping).60,65 Nb doping also causes a shift of the Fermi energy EF toward the conduction band.62 The introduction of Nb5+ also leads to a reduction of oxygen vacancies and thus defects of the host TiO2 crystal, reducing the electron scattering and trapping, which results in higher mobility and conductivity.73 From the comparison with literature mobility values reported in Table S2, the mobility in our TiO2 and Nb:TiO2 films cast from NCs is constantly of 1 or 2 orders of magnitude higher (amongst values determined from the same SCLC analysis). This positive trend can be explained based on better crystallinity and lower defect concentrations for NC-derived films compared to films fabricated by the solution process.74−76 It is worth noting that the estimated μ values in this work are even better than in some TiO2 films deposited by the atomic layer deposition (ALD) technique, which is known to provide highly uniform and crystalline films.77 As shown further below, when applied in perovskite solar cells, the Nb-doped TiO2-NC film with higher mobility and conductivity also results in an increase in photocurrent, further highlighting the advantage of Nb doping.
2.4. Characterization of Photovoltaic Devices
The TiO2 and Nb-doped TiO2 NC films were used as ETL in halide perovskite solar cells with the ITO/(Nb:)TiO2/FAPbI3/spiro-MeOTAD/Au (2,2′,7,7′-tetrakis(N,N-di-p-methoxyphenylamine)-9,9′-spirobifluorene (spiro-MeOTAD)) structure, where FAPbI3 was used as a light absorber. FAPbI3 is also thermodynamically more stable and more resistant to degradation in air. In addition, it harvests a wider portion of sunlight than MAPbI3 (Figure S5), owing to its lower band gap. The J/V characteristics (Figure 8a) show that the Nb:TiO2-based device has a better power conversion efficiency than the TiO2-based device. The short circuit current density (JSC) of Nb-doped TiO2-based devices is increased by 6.73%, while the VOC is decreased by 5.17%, which, overall results in an increase of the fill factor (FF) by 0.17% and of the photocurrent conversion efficiency (PCE) by 1.8%. The little reduction of VOC is probably caused by a drop of the energy difference between the conduction bands of FAPbI3 and Nb:TiO2 compared to FAPbI3 and TiO2, resulting in a built-up potential reduction, which is, in turn, reflected in the measured VOC. Figure 8b shows that the maximum EQE of both device types reaches 80% and that Nb:TiO2-based devices have a higher EQE in the UV spectral range (<400 nm), which is attributed to less parasitic absorption in this wavelength range due to the slightly wider band gap of Nb:TiO2 over undoped TiO2, as confirmed by optical measurements shown in Figures S2 and S3. The origin of the different behaviors of EQE between TiO2 and Nb:TiO2-based devices in the 600–700 nm range was already observed but has never been clarified.78 However, it might be tentatively assigned to factors such as optical interference due to a small thickness difference of the perovskite films79 or the difference in grain size in both absorbing and ETL layers.58 On the other hand, observing the J/V characteristic and the EQE spectrum of the device (vide infra), Nb doping results in an increased JSC under illumination due to a higher conductivity as well as higher electron mobility of the ETL.
Figure 8.

(a) J–V characteristics and (b) EQE spectra of the photovoltaic devices based on FAPbI3 as the light absorber and TiO2 and Nb:TiO2 as ETL.
Although relatively low, a PCE of about 11% shows that, in principle, the doped and undoped TiO2-NCs prepared according to our methodology can be applied for the preparation of ETL layers for photovoltaic devices. However, future optimization of NCs and the device structure is needed to achieve better efficiency. Such optimization should mainly target the spiro-MeOTAD layer by reducing its thickness, as well as increasing the perovskite layer thickness to harvest the largest amount of light possible, as shown previously.29,80−84 Moreover, this methodology to fabricate doped and undoped TiO2 ETL can be extended to other metal oxides and to other types of applications such as LEDs, optical sensors, transistors, as well as for transparent coating of surfaces, in particular for UV screening and filtering.
3. Conclusions
In this manuscript, we show that microwave-grown sub-4 nm TiO2 and Nb:TiO2-NCs are suitable and conveniently prepared materials to prepare thin films of TiO2 and Nb:TiO2-NCs that serve as electron transport layers for organohalide perovskite solar cells. The synthesized NCs were characterized morphologically by TEM and XRD and were utilized to cast a thin film of (Nb:)TiO2 functioning as ETL in lead halide perovskite solar cells based on FAPbI3. The transparent film morphology was characterized by SEM, whereas its optical properties were characterized by absorption and diffuse reflectance spectroscopies. The electronic transport properties of the film such as conductivity and mobility were investigated by space-charge-limited current (SCLC) and electrochemical impedance spectroscopy (EIS) techniques. As expected, niobium doping led to reduced parasitic absorption in the near-UV region and led to an improvement of conductivity, electron mobility and, as a consequence, improvement of the cell performances in terms of photocurrent (J) and external quantum efficiency (EQE) that were investigated by EQE and J/V measurements with a simulated solar light source.
4. Experimental Section
4.1. Materials
All materials were used as received without further purification. Anhydrous benzyl alcohol (99.8%), anhydrous dimethylsulfoxide (DMSO), γ-butyrolactone (GBL), ethanol, diethyl ether, 4-tert-butylpyridine (TBP), anhydrous acetonitrile, anhydrous chlorobenzene, methoxyethanol, lithium bis(trifluoromethane-sulfonyl)imide (Li-TFMSI), and TiCl4 99.999% were purchased from Sigma Aldrich. NbCl5 99.999% metal basis and lead iodide (PbI2) 99.999% metal basis were purchased from Alfa Aesar. Methylammonium iodide (CH3NH3I; MAI), formamidinium iodide (HC(NH3)2I;FAI), and Tris(2-(1H-pyrazol-1-yl)-4-tert-butylpyridine)cobalt(III) bis(trifluoromethylsulphomyl)imide (FK 102 Co(III) TFSI Salt) were purchased from Dyesol (GreatCell Solar). 2,2′,7,7′-Tetrakis(N,N-di-p-methoxyphenylamine)-9,9′-spirobifluorene (spiro-MeOTAD) 98% was purchased from Borun Chemicals. Tetrabutylammonium tetrafluoroborate (TBA+BF4–) 99% was purchased from Alfa Aesar. HC(NH3)2PbI3 and CH3NH3PbI3 were prepared by stirring at 60°C for 12 h HC(NH3)2I and CH3NH3I, respectively, with PbI2 with a 1:1 molar ratio in 1 mL of GBL/DMSO (3:2 v/v ratio).
4.2. Synthesis and Characterization of TiO2 and Nb-Doped TiO2 Nanocrystals
In a typical experiment, anhydrous TiCl4 (0.6 mL) was added dropwise under stirring to anhydrous ethanol (4 mL). The solution was transferred into a 20 mL microwave vial containing 15 mL of anhydrous benzyl alcohol. The vial was then sealed by a headspace cap in a glovebox and inserted into the microwave cavity. The solution was irradiated for 3 h by keeping the temperature at 80 °C. After cooling, the solution turned into a slightly milky suspension, indicating the formation of TiO2 NCs. The NCs were precipitated by adding diethyl ether (40 mL), and the precipitate was washed three times by redispersing in anhydrous ethanol and reprecipitating with diethyl ether. Washed NCs were finally dispersed in anhydrous ethanol, resulting in a colloidal suspension with a TiO2 concentration of approximately 10 mg/mL. Niobium-doped TiO2-NCs were prepared following the same procedure except that NbCl5 (50 mg in 0.5 mL anhydrous ethanol) was added to the previously described TiCl4 solution in anhydrous ethanol. The resulting nominal Nb doping of the TiO2-NCs is 5% w/w. This doping level was chosen according to previous reports as a typical, although moderate, dopant concentration, leading to significant enhancement of the electronic properties of the materials.81−84 For the deposition of TiO2 and Nb:TiO2-NC films, initial formulations with 1.18 wt % TiO2 suspended in anhydrous ethanol were used. The doped and undoped dispersions were stored at −20 °C and found to be shelf-stable for months.
4.3. Characterization of Nanocrystals
Powder and thin-film XRD patterns were collected on a Bruker D8 Advance A25 diffractometer in the Bragg–Brentano geometry equipped with a Cu tube (λ(Cu Kα) = 0.15418 nm) operating at 40 kV and 40 mA using a linear position sensitive detector (opening 2.9°). The diffractometer was configured with a 0.1° diverging slit, a 2.9° antiscattering slit, a 2.5° Soller slit, and a nickel filter to attenuate the contributions from Cu Kα fluorescence. Data sets were acquired in a continuous scanning mode over the 2θ range of 10–80°. A step size of 0.012° was applied with a counting time of 1s per step for the films and 6s per step for the powder. Because of the tendency of the dry NCs to agglomerate in macroscopic chunks, the material was ground to a fine powder using an agate mortar.
Transmission electron microscopy (TEM) analysis of the samples was also performed by employing an FEI Company’s TEM Titan G2 80–300 CT equipped with field-emission gun and an X-ray EDS detector from EDAX, Inc. TEM specimens were prepared by placing small amounts of samples on the holey carbon-coated copper (Cu) grids of 300 mesh size. Moreover, the imaging was carried out by operating the microscope at a beam energy of 300 keV, and thus several low- as well as high-magnification electron micrographs from various locations were acquired during the analysis. In addition, SAED and EDS were also recorded to investigate the crystal structure and the elemental composition of the samples, respectively. The entire TEM data acquisition and the proceeding image analysis was carried out in the Digital Micrograph of version GMS 1.85 from Gatan, Inc.
UV photoelectron spectroscopy (UPS) measurements were carried out using an Omicron SPHERA hemispherical analyzer under He–I excitation (21.22 eV) of an attenuated discharge lamp (Omicron/Focus HIS 13, 1/12 attenuation). The base pressure of the analysis chamber was 8 × 10⁻¹⁰ mbar. As a substrate, ITO-covered glass was used. The samples were prepared in a glovebox according to the device procedures and transferred to the UPS analysis chamber via ambient conditions, estimating the total air exposure time being less than 2 min. The film’s work functions (W) were determined from the spectra high binding energy cutoffs via the relation: W = 21.22 eV – Ecutoff, where Ecutoff is the respective cutoff energy. The film ionization energies (IE) are obtained by adding the photoemission onset of the valence edge EVB, respectively, to the Fermi level EF: IE = W + EVB. A multichanneltron detector and an analyzer were calibrated to the Fermi edge of a sputter-cleaned Au foil, yielding an energy resolution of 100 meV at room temperature. X-ray photoelectron spectroscopy (XPS) measurements were performed with the same equipment by exciting the sample with an Al/Mg soft X-ray source.
UV–vis–NIR optical absorption measurements were carried out using a Varian Cary 6000i UV–vis–NIR spectrometer. For this measurement, as-grown NCs were dispersed in absolute ethanol and loaded in a quartz cuvette.
4.4. Characterization of the ETL Film
Scanning electron microscopy (SEM) images were taken at a 5 kV accelerating voltage and a beam aperture of 30 μm, using a Zeiss Auriga microscope equipped with an in-lens detector. The structure of the films was investigated using an X-ray diffraction (XRD) Bruker D8 Discovery with a Cu Kα radiation source (λ = 1.5418 Å), and UV–vis–IR absorption measurements were taken using a Cary 6000i from Varian equipped with a diffuse reflectance accessory (integrating sphere). The samples were positioned at the center of the sphere and tilted 20° with respect to the incident light beam. This configuration allows most of the specular and diffused reflected and transmitted light to be integrated into the sphere and measured by the detector with minimal losses.
Electrochemical impedance spectroscopy (EIS), cyclic voltammetry (CV), and chronoamperometry measurements were carried out using a potentiostat/galvanostat Metrohm Autolab PGSTAT302N equipped with an FRA32M module, using a Ag/AgCl reference electrode and 0.1 M tetrabutylammium tetrafluoroborate in anhydrous acetonitrile as an electrolyte. The electrolytic cell was enclosed in a Faraday cage to prevent electromagnetic disturbances. Prior to the EIS measurements, the stability of the device was tested through cyclic voltammetry measurement by scanning twice from −1 to 1 V. The devices were fabricated by spin-coating an (Nb:)TiO2-NC dispersion in ethanol at 2000 rpm for 30 s on ITO glass (six layers by consecutive coatings and drying on a hot plate at 120 °C for 30 min) and sealing the contour with epoxy resin to avoid the possible contact of the electrolyte with the ITO layer underneath. The average thicknesses of TiO2 and Nb:TiO2 films measured by EIS are 214.1 ± 3.3 and 231.6 ± 8.3 nm, respectively.
J/V characterizations of the ETL films were carried out using a Keithley 2614B dual-channel source/measure unit. The devices were fabricated by depositing in sequence: 40 nm thick patterned Al contacts via thermal evaporation on a 1 in. by 1 in. glass substrate, a compact layer of (Nb:)TiO2-NCs by spin-coating six layers of an (Nb:)TiO2-NC dispersion in ethanol at 2000 rpm that was successively dried at 120 °C on a hot plate, 1 nm LiF electron injection layer by thermal evaporation, and 100 nm thick patterned Al contacts crossed with the bottom Al contacts defining a 0.04 cm2 area.
In these devices, the average thickness of TiO2 and Nb:TiO2 films are 214.1 ± 3.3 and 231.6 ± 8.3 nm, respectively. All of the thickness measurement of the films was performed on a Borofloat using a Bruker Dektak XT profilometer with a 200 μm/s measurement speed and with a 10 mg applicable force. The film was masked off with Kapton tape before spin-coating of the (Nb:)TiO2 film and removed after providing a measurable step of the deposited material.
4.5. Fabrication and Testing of Solar Cells
Patterned indium tin oxide substrates (ITO, 15 Ω/cm2) were cleaned in an ultrasonic bath (Branson 5510) using diluted Hellmanex II detergent for 20 min. Samples were rinsed with deionized water for 5 min before being sonicated in sequence with acetone and isopropanol for 10 min. Next, the samples were dried with nitrogen before being exposed to UV–ozone plasma for 10 min. TiO2 and Nb:TiO2 compact layers were prepared by spin-coating the colloidal dispersion of nanocrystals in anhydrous ethanol at 4000 rpm for 30 s, followed by drying at 150 °C for 30 min. The thickness of the compact layer was tuned by adjusting the concentration of TiO2 nanocrystals (3.54–0.24 wt % TiO2 to ethanol).
A HC(NH2)2I (FAI) + PbI2 solution was deposited onto (Nb:)TiO2/ITO substrates by a consecutive two-step spin-coating process at 1000 and 4500 rpm for 10 and 40 s, respectively, followed by drying at 100 °C for 30 min. The hole transporting material (HTM) solution was spin-coated on the previously deposited FAPbl3 layer at 2200 rpm for 30 s. The HTM solution was prepared by dissolving 80 mg of spiro-MeOTAD in 1 mL of chlorobenzene alongside 28.8 μL of TBP, 17.6 μL of a Li-TFMSI stock solution (520 mg of Li-TFMSI in 1 mL of acetonitrile), and 29 μL of an FK 102 Co(III) TFSI Salt stock solution (300 mg of FK 102 Co(III) TFSI salt in 1 mL of acetonitrile). Finally, at an operating pressure below 1 × 10⁻⁷ Torr, the devices were completed by thermally evaporating 100 nm thick gold electrodes at a 2 Å/s rate through a deposition mask to yield a device active area of 0.075 cm2.
J/V measurements of solar cells were performed in a glovebox using a Keithley 2400 source meter and an ABET Technology Sun 3000 class AAA solar simulator calibrated to 1 sun, AM1.5 G, and an NREL-calibrated reference silicon cell (ABET Technology). The external quantum efficiency (EQE) measurements were performed at zero bias by illuminating the device with monochromatic light emitted by a xenon arc lamp in combination with a dual-grating monochromator. The number of incident photons on the sample (light power) was measured for each wavelength using a NIST calibrated silicon photodiode.
Acknowledgments
The authors would like to thank the VISTEC Frontier Research Center (FRC) for the characterization facilities utilized in this study, Prof. Satoshi Horike for putting his potentiostat/galvanostat at our disposal to carry out CV, CA, and EIS measurements, and Jérémy Barbé for the support on SEM image acquisition.V.D.E. acknowledges the National Research Council of Thailand (N41A640170) for research support. S.D.G acknowledges financial support through postdoctoral fellowship from the Vidyasirimedhi Institute of Science and Technology (VISTEC). G.E.Jabbour acknowledges the support of Canadian government through the Canada Research Chair (Tier 1) (award # 950-231466) and NSERC Discovery Grant (award # RGPIN- 2020-06970).
Supporting Information Available
The Supporting Information is available free of charge at https://pubs.acs.org/doi/10.1021/acsomega.1c05970.
EDS spectra and SAED patterns of TiO2 and Nb:TiO2-NCs (Figures S1 and S2); absorption spectra and UV–vis light transmittance of TiO2-NC and Nb:TiO2-NC films (Figures S3 and S4); Tauc plots of methylammonium and formamidinium lead iodide deposited on glass substrates (Figure S5); literature values of measurement of the conductivity and mobility of TiO2 and Nb:TiO2 films (Tables S1 and S2); Nyquist plots of TiO2 and Nb:TiO2-based devices (Figure S6); and J/V plots (Figures S7 and S8) (PDF)
Author Contributions
This manuscript was written through the contributions of all authors. All authors have given approval to the final version of the manuscript.
The authors declare no competing financial interest.
Supplementary Material
References
- Sodpiban O.; Del Gobbo S.; Barman S.; Aomchad V.; Kidkhunthod P.; Ould-Chikh S.; Poater A.; D’Elia V.; Basset J. M. Synthesis of Well-Defined Yttrium-Based Lewis Acids by Capturing a Reaction Intermediate and Catalytic Application for Cycloaddition of CO2 to Epoxides under Atmospheric Pressure. Catal. Sci. Technol. 2019, 9, 6152–6165. 10.1039/C9CY01642B. [DOI] [Google Scholar]
- Sodpiban O.; Phungpanya C.; Del Gobbo S.; Arayachukiat S.; Piromchart T.; D’Elia V. Rational Engineering of Single-Component Heterogeneous Catalysts Based on Abundant Metal Centers for the Mild Conversion of Pure and Impure CO2 to Cyclic Carbonates. Chem. Eng. J. 2021, 422, 129930 10.1016/j.cej.2021.129930. [DOI] [Google Scholar]
- Abulikemu M.; Neophytou M.; Barbé J. M.; Tietze M. L.; El Labban A.; Anjum D. H.; Amassian A.; McCulloch I.; Del Gobbo S. Microwave-Synthesized Tin Oxide Nanocrystals for Low-Temperature Solution-Processed Planar Junction Organo-Halide Perovskite Solar Cells. J. Mater. Chem. A 2017, 5, 7759–7763. 10.1039/C7TA00975E. [DOI] [Google Scholar]
- Barbé J.; Tietze M. L.; Neophytou M.; Murali B.; Alarousu E.; Labban A.; El; Abulikemu M.; Yue W.; Mohammed O. F.; McCulloch I.; et al. Amorphous Tin Oxide as a Low-Temperature-Processed Electron-Transport Layer for Organic and Hybrid Perovskite Solar Cells. ACS Appl. Mater. Interfaces 2017, 9, 11828–11836. 10.1021/acsami.6b13675. [DOI] [PubMed] [Google Scholar]
- Han L.; Abdi F. F.; Van De Krol R.; Liu R.; Huang Z.; Lewerenz H. J.; Dam B.; Zeman M.; Smets A. H. M. Efficient Water-Splitting Device Based on a Bismuth Vanadate Photoanode and Thin-Film Silicon Solar Cells. ChemSusChem 2014, 7, 2832–2838. 10.1002/cssc.201402456. [DOI] [PubMed] [Google Scholar]
- Abdi F. F.; Han L.; Smets A. H. M.; Zeman M.; Dam B.; Van De Krol R. Efficient Solar Water Splitting by Enhanced Charge Separation in a Bismuth Vanadate-Silicon Tandem Photoelectrode. Nat. Commun. 2013, 4, 2195 10.1038/ncomms3195. [DOI] [PubMed] [Google Scholar]
- Kudo A.; Miseki Y. Heterogeneous Photocatalyst Materials for Water Splitting. Chem. Soc. Rev. 2009, 38, 253–278. 10.1039/B800489G. [DOI] [PubMed] [Google Scholar]
- Shi L.; Zhuo S.; Abulikemu M.; Mettela G.; Palaniselvam T.; Rasul S.; Tang B.; Yan B.; Saleh N. B.; Wang P. Annealing Temperature Effects on Photoelectrochemical Performance of Bismuth Vanadate Thin Film Photoelectrodes. RSC Adv. 2018, 8, 29179–29188. 10.1039/C8RA04887H. [DOI] [PMC free article] [PubMed] [Google Scholar]
- O’Regan B.; Grätzel M. A Low-Cost, High-Efficiency Solar Cell Based on Dye-Sensitized Colloidal TiO2 Films. Nature 1991, 353, 737–740. 10.1038/353737a0. [DOI] [Google Scholar]
- Wojciechowski K.; Saliba M.; Leijtens T.; Abate A.; Snaith H. J. Sub-150 °C Processed Meso-Superstructured Perovskite Solar Cells with Enhanced Efficiency. Energy Environ. Sci. 2014, 7, 1142–1147. 10.1039/C3EE43707H. [DOI] [Google Scholar]
- Liu M.; Johnston M. B.; Snaith H. J. Efficient Planar Heterojunction Perovskite Solar Cells by Vapour Deposition. Nature 2013, 501, 395–398. 10.1038/nature12509. [DOI] [PubMed] [Google Scholar]
- Monticone S.; Tufeu R.; Kanaev A. V.; Scolan E.; Sanchez C. Quantum Size Effect in TiO2 Nanoparticles: Does It Exist?. Appl. Surf. Sci. 2000, 162–163, 565–570. 10.1016/S0169-4332(00)00251-8. [DOI] [Google Scholar]
- Baldini E.; Chiodo L.; Dominguez A.; Palummo M.; Moser S.; Yazdi-Rizi M.; Auböck G.; Mallett B. P. P.; Berger H.; Magrez A.; et al. Strongly Bound Excitons in Anatase TiO2 Single Crystals and Nanoparticles. Nat. Commun. 2017, 8, 13 10.1038/s41467-017-00016-6. [DOI] [PMC free article] [PubMed] [Google Scholar]
- Macino M.; Barnes A. J.; Althahban S. M.; Qu R.; Gibson E. K.; Morgan D. J.; Freakley S. J.; Dimitratos N.; Kiely C. J.; Gao X.; et al. Tuning of Catalytic Sites in Pt/TiO2 Catalysts for the Chemoselective Hydrogenation of 3-Nitrostyrene. Nat. Catal. 2019, 2, 873–881. 10.1038/s41929-019-0334-3. [DOI] [Google Scholar]
- Nagaoka K.; Takanabe K.; Aika K. I. Influence of the Phase Composition of Titania on Catalytic Behavior of Co/TiO2 for the Dry Reforming of Methane. Chem. Commun. 2002, 2, 1006–1007. 10.1039/b201717m. [DOI] [PubMed] [Google Scholar]
- Abdullah H.; Khan M. M. R.; Ong H. R.; Yaakob Z. Modified TiO2 Photocatalyst for CO2 Photocatalytic Reduction: An Overview. J. CO2 Util. 2017, 22, 15–32. 10.1016/j.jcou.2017.08.004. [DOI] [Google Scholar]
- Li Y.; Peng Y. K.; Hu L.; Zheng J.; Prabhakaran D.; Wu S.; Puchtler T. J.; Li M.; Wong K. Y.; Taylor R. A.; et al. Photocatalytic Water Splitting by N-TiO2 on MgO (111) with Exceptional Quantum Efficiencies at Elevated Temperatures. Nat. Commun. 2019, 10, 4421 10.1038/s41467-019-12385-1. [DOI] [PMC free article] [PubMed] [Google Scholar]
- Li R.; Weng Y.; Zhou X.; Wang X.; Mi Y.; Chong R.; Han H.; Li C. Achieving Overall Water Splitting Using Titanium Dioxide-Based Photocatalysts of Different Phases. Energy Environ. Sci. 2015, 8, 2377–2382. 10.1039/C5EE01398D. [DOI] [Google Scholar]
- Zhou H.; Chen Q.; Li G.; Luo S.; Song T. -b.; Duan H.-S.; Hong Z.; You J.; Liu Y.; Yang Y. Interface Engineering of Highly Efficient Perovskite Solar Cells. Science 2014, 345, 542–546. 10.1126/science.1254050. [DOI] [PubMed] [Google Scholar]
- Islam N.; Yang M.; Zhu K.; Fan Z. Mesoporous Scaffolds Based on TiO2 Nanorods and Nanoparticles for Efficient Hybrid Perovskite Solar Cells. J. Mater. Chem. A 2015, 3, 24315–24321. 10.1039/C5TA06727H. [DOI] [Google Scholar]
- Raj C. C.; Prasanth R. Review—Advent of TiO2 Nanotubes as Supercapacitor Electrode. J. Electrochem. Soc. 2018, 165, E345–E358. 10.1149/2.0561809jes. [DOI] [Google Scholar]
- Elmouwahidi A.; Bailón-García E.; Castelo-Quibén J.; Pérez-Cadenas A. F.; Maldonado-Hódar F. J.; Carrasco-Marín F. Carbon-TiO2 Composites as High-Performance Supercapacitor Electrodes: Synergistic Effect between Carbon and Metal Oxide Phases. J. Mater. Chem. A 2018, 6, 633–644. 10.1039/C7TA08023A. [DOI] [Google Scholar]
- Yue J.; Suchomski C.; Voepel P.; Ellinghaus R.; Rohnke M.; Leichtweiss T.; Elm M. T.; Smarsly B. M. Mesoporous Niobium-Doped Titanium Dioxide Films from the Assembly of Crystalline Nanoparticles: Study on the Relationship between the Band Structure, Conductivity and Charge Storage Mechanism. J. Mater. Chem. A 2017, 5, 1978–1988. 10.1039/C6TA06840E. [DOI] [Google Scholar]
- Brezesinski T.; Wang J.; Polleux J.; Dunn B.; Tolbert S. H. Templated Nanocrystal-Based Porous TiO2 Films for next-Generation Electrochemical Capacitors. J. Am. Chem. Soc. 2009, 131, 1802–1809. 10.1021/ja8057309. [DOI] [PubMed] [Google Scholar]
- Maziarz W.; Kusior A.; Trenczek-Zajac A. Nanostructured TiO2-Based Gas Sensors with Enhancedsensitivity to Reducing Gases. Beilstein J. Nanotechnol. 2016, 7, 1718–1726. 10.3762/bjnano.7.164. [DOI] [PMC free article] [PubMed] [Google Scholar]
- Wang C.; Yin L.; Zhang L.; Qi Y.; Lun N.; Liu N. Large Scale Synthesis and Gas-Sensing Properties of Anatase TiO2 Three-Dimensional Hierarchical Nanostructures. Langmuir 2010, 26, 12841–12848. 10.1021/la100910u. [DOI] [PubMed] [Google Scholar]
- Roose B.; Gödel K. C.; Pathak S.; Sadhanala A.; Baena J. P. C.; Wilts B. D.; Snaith H. J.; Wiesner U.; Grätzel M.; Steiner U.; et al. Enhanced Efficiency and Stability of Perovskite Solar Cells Through Nd-Doping of Mesostructured TiO2. Adv. Energy Mater. 2015, 6, 1501868 10.1002/aenm.201501868. [DOI] [Google Scholar]
- Jeon J. B.; Kim B. J.; Bang G. J.; Kim M. C.; Lee D. G.; Lee J. M.; Lee M.; Han H. S.; Boschloo G.; Lee S.; et al. Photo-Annealed Amorphous Titanium Oxide for Perovskite Solar Cells. Nanoscale 2019, 11, 19488–19496. 10.1039/C9NR05776E. [DOI] [PubMed] [Google Scholar]
- Johansson M. B.; Xie L.; Kim B. J.; Thyr J.; Kandra T.; Johansson E. M. J.; Göthelid M.; Edvinsson T.; Boschloo G. Highly Crystalline MAPbI3 Perovskite Grain Formation by Irreversible Poor-Solvent Diffusion Aggregation, for Efficient Solar Cell Fabrication. Nano Energy 2020, 78, 105346 10.1016/j.nanoen.2020.105346. [DOI] [Google Scholar]
- Yang M.; Guo R.; Kadel K.; Liu Y.; O’Shea K.; Bone R.; Wang X.; He J.; Li W. Improved Charge Transport of Nb-Doped TiO2 Nanorods in Methylammonium Lead Iodide Bromide Perovskite Solar Cells. J. Mater. Chem. A 2014, 2, 19616–19622. 10.1039/C4TA02635G. [DOI] [Google Scholar]
- Kim D. H.; Han G. S.; Seong W. M.; Lee J.-W.; Kim B. J.; Park N.-G.; Hong K. S.; Lee S.; Jung H. S. Niobium Doping Effects on TiO2 Mesoscopic Electron Transport Layer-Based Perovskite Solar Cells. ChemSusChem 2015, 8, 2392–2398. 10.1002/cssc.201403478. [DOI] [PubMed] [Google Scholar]
- Etgar L.; Gao P.; Xue Z.; Peng Q.; Chandiran A. K.; Liu B.; Nazeeruddin M. K.; Grätzel M. Mesoscopic CH3NH3PbI3/TiO2 Heterojunction Solar Cells. J. Am. Chem. Soc. 2012, 134, 17396–17399. 10.1021/ja307789s. [DOI] [PubMed] [Google Scholar]
- Kim H.-S.; Lee C.-R.; Im J.-H.; Lee K.-B.; Moehl T.; Marchioro A.; Moon S.-J.; Humphry-Baker R.; Yum J.-H.; Moser J. E.; et al. Lead Iodide Perovskite Sensitized All-Solid-State Submicron Thin Film Mesoscopic Solar Cell with Efficiency Exceeding 9%. Sci. Rep. 2012, 2, 591 10.1038/srep00591. [DOI] [PMC free article] [PubMed] [Google Scholar]
- Kojima A.; Teshima K.; Shirai Y.; Miyasaka T. Organometal Halide Perovskites as Visible-Light Sensitizers for Photovoltaic Cells. J. Am. Chem. Soc. 2009, 131, 6050–6051. 10.1021/ja809598r. [DOI] [PubMed] [Google Scholar]
- Mehnane H. F.; Wang C.; Kondamareddy K. K.; Yu W.; Sun W.; Liu H.; Bai S.; Liu W.; Guo S.; Zhao X. Z. Hydrothermal Synthesis of TiO2 Nanoparticles Doped with Trace Amounts of Strontium, and Their Application as Working Electrodes for Dye Sensitized Solar Cells: Tunable Electrical Properties & Enhanced Photo-Conversion Performance. RSC Adv. 2017, 7, 2358–2364. 10.1039/C6RA26012H. [DOI] [Google Scholar]
- Hellstern H. L.; Bremholm M.; Mamakhel A.; Becker J.; Iversen B. B. Hydrothermal Synthesis of TiO2@SnO2 Hybrid Nanoparticles in a Continuous-Flow Dual-Stage Reactor. ChemSusChem 2016, 9, 532–539. 10.1002/cssc.201501199. [DOI] [PubMed] [Google Scholar]
- Rehan M.; Lai X.; Kale G. M. Hydrothermal Synthesis of Titanium Dioxide Nanoparticles Studied Employing in Situ Energy Dispersive X-Ray Diffraction. CrystEngComm 2011, 13, 3725–3732. 10.1039/c0ce00781a. [DOI] [Google Scholar]
- Gupta T.; Samriti; Cho J.; Prakash J. Hydrothermal Synthesis of TiO2 Nanorods: Formation Chemistry, Growth Mechanism, and Tailoring of Surface Properties for Photocatalytic Activities. Mater. Today Chem. 2021, 20, 100428 10.1016/j.mtchem.2021.100428. [DOI] [Google Scholar]
- Souvereyns B.; Elen K.; De Dobbelaere C.; Kelchtermans A.; Peys N.; D’Haen J.; Mertens M.; Mullens S.; Van den Rul H.; Meynen V.; et al. Hydrothermal Synthesis of a Concentrated and Stable Dispersion of TiO2 Nanoparticles. Chem. Eng. J. 2013, 223, 135–144. 10.1016/j.cej.2013.02.047. [DOI] [Google Scholar]
- Niederberger M. Nonaqueous Sol-Gel Routes to Metal Oxide Nanoparticles. Acc. Chem. Res. 2007, 40, 793–800. 10.1021/ar600035e. [DOI] [PubMed] [Google Scholar]
- Niederberger M.; Garnweitner G. Organic Reaction Pathways in the Nonaqueous Synthesis of Metal Oxide Nanoparticles. Chem. - Eur. J. 2006, 12, 7282–7302. 10.1002/chem.200600313. [DOI] [PubMed] [Google Scholar]
- Bourget L.; Corriu R. J. P.; Leclercq D.; Mutin P. H.; Vioux a. Non-Hydrolytic Sol–Gel Routes to Silica. J. Non-Cryst. Solids 1998, 242, 81–91. 10.1016/S0022-3093(98)00789-3. [DOI] [Google Scholar]
- Niederberger M.; Bartl M. H.; Stucky G. D. Benzyl Alcohol and Transition Metal Chlorides as a Versatile Reaction System for the Nonaqueous and Low-Temperature Synthesis of Crystalline Nano-Objects with Controlled Dimensionality. J. Am. Chem. Soc. 2002, 124, 13642–13643. 10.1021/ja027115i. [DOI] [PubMed] [Google Scholar]
- Del Gobbo S.; Poolwong J.; D’Elia V. In-Suspension Growth of ZnO Nanorods with Tunable Length and Diameter Using Polymorphic Seeds. Cryst. Growth Des. 2019, 19, 6792–6800. 10.1021/acs.cgd.9b01226. [DOI] [Google Scholar]
- Del Gobbo S.; Poolwong J.; D’Elia V.; Ogawa M. Simultaneous Controlled Seeded-Growth and Doping of ZnO Nanorods with Aluminum and Cerium: Feasibility Assessment and Effect on Photocatalytic Activity. Cryst. Growth Des. 2020, 20, 5508–5525. 10.1021/acs.cgd.0c00694. [DOI] [Google Scholar]
- Poolwong J.; Del Gobbo S.; D’Elia V. Transesterification of Dimethyl Carbonate with Glycerol by Perovskite-Based Mixed Metal Oxide Nanoparticles for the Atom-Efficient Production of Glycerol Carbonate. J. Ind. Eng. Chem. 2021, 104, 43–60. 10.1016/j.jiec.2021.08.008. [DOI] [Google Scholar]
- Ludi B.; Olliges-Stadler I.; Rossell M. D.; Niederberger M. Extension of the Benzyl Alcohol Route to Metal Sulfides: “Nonhydrolytic” Thio Sol-Gel Synthesis of ZnS and SnS2. Chem. Commun. 2011, 47, 5280–5282. 10.1039/c1cc10856e. [DOI] [PubMed] [Google Scholar]
- Del Gobbo S.; Mottram A. D.; Ould-Chikh S.; Chaopaknam J.; Pattanasattayavong P.; D’Elia V. Physico-Chemical Investigation of ZnS Thin-Film Deposited from Ligand-Free Nanocrystals Synthesized by Non-Hydrolytic Thio-Sol–Gel. Nanotechnology 2018, 29, 385603 10.1088/1361-6528/aacf83. [DOI] [PubMed] [Google Scholar]
- Pinna N.; Niederberger M. Surfactant-Free Nonaqueous Synthesis of Metal Oxide Nanostructures. Angew. Chem., Int. Ed. 2008, 47, 5292–5304. 10.1002/anie.200704541. [DOI] [PubMed] [Google Scholar]
- Ahmad M. Z.; Chang J.; Ahmad M. S.; Waclawik E. R.; Wlodarski W. Non-Aqueous Synthesis of Hexagonal ZnO Nanopyramids: Gas Sensing Properties. Sens. Actuators, B 2013, 177, 286–294. 10.1016/j.snb.2012.11.013. [DOI] [Google Scholar]
- Debecker D. P.; Mutin P. H. Non-Hydrolytic Sol–Gel Routes to Heterogeneous Catalysts. Chem. Soc. Rev. 2012, 41, 3624–3650. 10.1039/c2cs15330k. [DOI] [PubMed] [Google Scholar]
- Niederberger M.; Bartl M. H.; Stucky G. D. Benzyl Alcohol and Titanium Tetrachloride - A Versatile Reaction System for the Nonaqueous and Low-Temperature Preparation of Crystalline and Luminescent Titania Nanoparticles. Chem. Mater. 2002, 14, 4364–4370. 10.1021/cm021203k. [DOI] [Google Scholar]
- Singh R.; Ryu I.; Yadav H.; Park J.; Jo J. W.; Yim S.; Lee J. J. Non-Hydrolytic Sol-Gel Route to Synthesize TiO2 Nanoparticles under Ambient Condition for Highly Efficient and Stable Perovskite Solar Cells. Sol. Energy 2019, 185, 307–314. 10.1016/j.solener.2019.04.066. [DOI] [Google Scholar]
- Bilecka I.; Djerdj I.; Niederberger M. One-Minute Synthesis of Crystalline Binary and Ternary Metal Oxide Nanoparticles. Chem. Commun. 2008, 886–888. 10.1039/B717334B. [DOI] [PubMed] [Google Scholar]
- Luo L.; Rossell M. D.; Xie D.; Erni R.; Niederberger M. Microwave-Assisted Nonaqueous Sol-Gel Synthesis: From Al:ZnO Nanoparticles to Transparent Conducting Films. ACS Sustainable Chem. Eng. 2013, 1, 152–160. 10.1021/sc300073d. [DOI] [Google Scholar]
- Nikolay T.; Larina L.; Shevaleevskiy O.; Ahn B. T. Electronic Structure Study of Lightly Nb-Doped TiO2 Electrode for Dye-Sensitized Solar Cells. Energy Environ. Sci. 2011, 4, 1480. 10.1039/c0ee00678e. [DOI] [Google Scholar]
- Frantz C.; Lauria A.; Manzano C. V.; Guerra-Nuñez C.; Niederberger M.; Storrer C.; Michler J.; Philippe L. Nonaqueous Sol-Gel Synthesis of Anatase Nanoparticles and Their Electrophoretic Deposition in Porous Alumina. Langmuir 2017, 33, 12404–12418. 10.1021/acs.langmuir.7b02103. [DOI] [PubMed] [Google Scholar]
- Sanehira Y.; Shibayama N.; Numata Y.; Ikegami M.; Miyasaka T. Low-Temperature Synthesized Nb-Doped TiO2 Electron Transport Layer Enabling High-Efficiency Perovskite Solar Cells by Band Alignment Tuning. ACS Appl. Mater. Interfaces 2020, 12, 15175–15182. 10.1021/acsami.9b23485. [DOI] [PubMed] [Google Scholar]
- Gharaei S. K.; Abbasnejad M.; Maezono R. Bandgap Reduction of Photocatalytic TiO2 Nanotube by Cu Doping. Sci. Rep. 2018, 8, 14192 10.1038/s41598-018-32130-w. [DOI] [PMC free article] [PubMed] [Google Scholar]
- Gai Y.; Li J.; Li S. S.; Xia J. B.; Wei S. H. Design of Narrow-Gap TiO2: A Passivated Codoping Approach for Enhanced Photoelectrochemical Activity. Phys. Rev. Lett. 2009, 102, 036402 10.1103/PhysRevLett.102.036402. [DOI] [PubMed] [Google Scholar]
- Morgan B. J.; Scanlon D. O.; Watson G. W. Small Polarons in Nb- and Ta-Doped Rutile and Anatase TiO2. J. Mater. Chem. 2009, 19, 5175. 10.1039/b905028k. [DOI] [Google Scholar]
- Hitosugi T.; Kamisaka H.; Yamashita K.; Nogawa H.; Furubayashi Y.; Nakao S.; Yamada N.; Chikamatsu A.; Kumigashira H.; Oshima M.; et al. Electronic Band Structure of Transparent Conductor: Nb-Doped Anatase TiO2. Appl. Phys. Express 2008, 1, 111203 10.1143/APEX.1.111203. [DOI] [Google Scholar]
- De Trizio L.; Buonsanti R.; Schimpf A. M.; Llordes A.; Gamelin D. R.; Simonutti R.; Milliron D. J. Nb-Doped Colloidal TiO2 Nanocrystals with Tunable Infrared Absorption. Chem. Mater. 2013, 25, 3383–3390. 10.1021/cm402396c. [DOI] [Google Scholar]
- Aharon S.; Dymshits A.; Rotem A.; Etgar L. Temperature Dependence of Hole Conductor Free Formamidinium Lead Iodide Perovskite Based Solar Cells. J. Mater. Chem. A 2015, 3, 9171–9178. 10.1039/C4TA05149A. [DOI] [Google Scholar]
- Saha M.; Ghosh S.; Paul S.; Dalal B.; De S. K. Nb-Dopant-Induced Tuning of Optical and Electrical Property of Anatase TiO2 Nanocrystals. ChemistrySelect 2018, 3, 6654–6664. 10.1002/slct.201800434. [DOI] [Google Scholar]
- Dong C.; Wang X.; Liu X.; Yuan X.; Dong W.; Cui H.; Duan Y.; Huang F. In Situ Grown Nb4N5 Nanocrystal on Nitrogen-Doped Graphene as a Novel Anode for Lithium Ion Battery. RSC Adv. 2016, 6, 81290–81295. 10.1039/C6RA13647H. [DOI] [Google Scholar]
- Zhu L.; Lu Q.; Lv L.; Wang Y.; Hu Y.; Deng Z.; Lou Z.; Hou Y.; Teng F. Ligand-Free Rutile and Anatase TiO2 Nanocrystals as Electron Extraction Layers for High Performance Inverted Polymer Solar Cells. RSC Adv. 2017, 7, 20084–20092. 10.1039/C7RA00134G. [DOI] [Google Scholar]
- Olthof S. Research Update: The Electronic Structure of Hybrid Perovskite Layers and Their Energetic Alignment in Devices. APL Mater. 2016, 4, 091502 10.1063/1.4960112. [DOI] [Google Scholar]
- Koh T. M.; Fu K.; Fang Y.; Chen S.; Sum T. C.; Mathews N.; Mhaisalkar S. G.; Boix P. P.; Baikie T. Formamidinium-Containing Metal-Halide: An Alternative Material for near-IR Absorption Perovskite Solar Cells. J. Phys. Chem. C 2014, 118, 16458–16462. 10.1021/jp411112k. [DOI] [Google Scholar]
- Chen L.; Zhou Y.; Tu W.; Li Z.; Bao C.; Dai H.; Yu T.; Liu J.; Zou Z. Enhanced Photovoltaic Performance of a Dye-Sensitized Solar Cell Using Graphene-TiO2 Photoanode Prepared by a Novel in Situ Simultaneous Reduction-Hydrolysis Technique. Nanoscale 2013, 5, 3481–3485. 10.1039/c3nr34059g. [DOI] [PubMed] [Google Scholar]
- Çaldıran Z.; Şinoforotlu M.; Metin Ö.; Aydotan Ş.; Meral K. Space Charge Limited Current Mechanism (SCLC) in the Graphene Oxide-Fe3O4 Nanocomposites/n-Si Heterojunctions. J. Alloys Compd. 2015, 631, 261–265. 10.1016/j.jallcom.2015.01.117. [DOI] [Google Scholar]
- Saito J.; Oku T.; Suzuki A.; Akiyama T. Fabrication and Characterization of Perovskite-Type Solar Cells with Nb-Doped TiO2 Layers. AIP Conf. Proc. 2016, 1709, 020027 10.1063/1.4941226. [DOI] [Google Scholar]
- Wang X.; Wang F. H.; Shang J. X.; Zhou Y. S. Ab Initio Studies of Nb Doping Effect on the Formation of Oxygen Vacancy in Rutile TiO2. J. Phys. Chem. Solids 2012, 73, 84–93. 10.1016/j.jpcs.2011.09.029. [DOI] [Google Scholar]
- Lv Y.; Tong H.; Cai W.; Zhang Z.; Chen H.; Zhou X. Boosting the Efficiency of Commercial Available Carbon-Based Perovskite Solar Cells Using Zinc-Doped TiO2 Nanorod Arrays as Electron Transport Layer. J. Alloys Compd. 2021, 851, 156785 10.1016/j.jallcom.2020.156785. [DOI] [Google Scholar]
- Kaewprajak A.; Kumnorkaew P.; Sagawa T. Silver–Indium–Sulfide Quantum Dots in Titanium Dioxide as Electron Transport Layer for Highly Efficient and Stable Perovskite Solar Cells. J. Mater. Sci.: Mater. Electron. 2019, 30, 4041–4055. 10.1007/s10854-019-00691-9. [DOI] [Google Scholar]
- Song S.; Kang G.; Pyeon L.; Lim C.; Lee G. Y.; Park T.; Choi J. Systematically Optimized Bilayered Electron Transport Layer for Highly Efficient Planar Perovskite Solar Cells (η = 21.1%). ACS Energy Lett. 2017, 2, 2667–2673. 10.1021/acsenergylett.7b00888. [DOI] [Google Scholar]
- Nunez P.; Richter M. H.; Piercy B. D.; Roske C. W.; Cabán-Acevedo M.; Losego M. D.; Konezny S. J.; Fermin D. J.; Hu S.; Brunschwig B. S.; et al. Characterization of Electronic Transport through Amorphous TiO2 Produced by Atomic Layer Deposition. J. Phys. Chem. C 2019, 123, 20116–20129. 10.1021/acs.jpcc.9b04434. [DOI] [Google Scholar]
- Zhao K.; Munir R.; Yan B.; Yang Y.; Kim T.; Amassian A. Solution-Processed Inorganic Copper(I) Thiocyanate (CuSCN) Hole Transporting Layers for Efficient p-i-n Perovskite Solar Cells. J. Mater. Chem. A 2015, 3, 20554–20559. 10.1039/C5TA04028K. [DOI] [Google Scholar]
- Labban A.; Chen H.; Kirkus M.; Barbe J.; Del Gobbo S.; Neophytou M.; McCulloch I.; Eid J. Improved Efficiency in Inverted Perovskite Solar Cells Employing a Novel Diarylamino-Substituted Molecule as PEDOT:PSS Replacement. Adv. Energy Mater. 2016, 6, 1502101 10.1002/aenm.201502101. [DOI] [Google Scholar]
- Wang Y.; Zhou X.; Liang C.; Li P.; Hu X.; Cai Q.; Zhang Y.; Li F.; Li M.; Song Y.; et al. Enhanced Efficiency of Perovskite Solar Cells by Using Core–Ultrathin Shell Structure Ag@SiO2 Nanowires as Plasmonic Antennas. Adv. Electron. Mater. 2017, 3, 1700169 10.1002/aelm.201700169. [DOI] [Google Scholar]
- Liang C.; Li P.; Zhang Y.; Gu H.; Cai Q.; Liu X.; Wang J.; Wen H.; Shao G. Mild Solution-Processed Metal-Doped TiO2 Compact Layers for Hysteresis-Less and Performance-Enhanced Perovskite Solar Cells. J. Power Sources 2017, 372, 235–244. 10.1016/j.jpowsour.2017.10.079. [DOI] [Google Scholar]
- Cai Q.; Zhang Y.; Liang C.; Li P.; Gu H.; Liu X.; Wang J.; Shentu Z.; Fan J.; Shao G. Enhancing Efficiency of Planar Structure Perovskite Solar Cells Using Sn-Doped TiO2 as Electron Transport Layer at Low Temperature. Electrochim. Acta 2018, 261, 227–235. 10.1016/j.electacta.2017.12.108. [DOI] [Google Scholar]
- Liu X.; Wu Z.; Zhang Y.; Tsamis C. Low Temperature Zn-Doped TiO2 as Electron Transport Layer for 19% Efficient Planar Perovskite Solar Cells. Appl. Surf. Sci. 2019, 471, 28–35. 10.1016/j.apsusc.2018.11.237. [DOI] [Google Scholar]
- Duan Y.; Zhao G.; Liu X.; Ma J.; Chen S.; Song Y.; Pi X.; Yu X.; Yang D.; Zhang Y.; et al. Low-Temperature Processed Tantalum/Niobium Co-Doped TiO2 Electron Transport Layer for High-Performance Planar Perovskite Solar Cells. Nanotechnology 2021, 32, 245201 10.1088/1361-6528/abeb37. [DOI] [PubMed] [Google Scholar]
Associated Data
This section collects any data citations, data availability statements, or supplementary materials included in this article.