

Abstract
Recent advances in optical imaging techniques rely on the use of nanosized contrast agents for in vitro and in vivo applications. We report on an imaging method based on the inertial cavitation of ultrasound-irradiated water solutions that lead to sonoluminescence (SL), here, newly proposed in combination with semiconductor nanoparticles, in particular, aminopropyl-functionalized zinc oxide nanocrystals. The obtained measurements confirm the ability of such nanocrystals to increase the sonoluminescence emission, together with the ability to modify the SL spectrum when compared to the pure water behavior. In particular, it is shown that the UV component of SL is absorbed by the semiconductor behavior that is also confirmed in different biologically relevant media. Finally, optical images of nanocrystal-assisted SL are acquired for the first time, in particular, in biological buffers, revealing that at low ultrasound intensities, SL is measurable only when the nanocrystals are present in solution. All of these results witness the role of amine-functionalized zinc oxide nanocrystals for sonoluminescence emission, which makes them very good candidates as efficient nanocontrast agents for SL imaging for biological and biomedical applications.
1. Introduction
In recent years, the development of diagnostic tools has seen considerable progress in the anticancer field and, in this regard, the design of sophisticated contrast agents is at the frontiers of modern research.1−3 These agents allow us to obtain high sensitivity and specificity toward organs or tissues of interest and are capable of providing a visual aid to assess the presence of a disease.
At present, a large number of nanosized materials have been studied for their potential use in optical diagnostic purposes.4,5 The most interesting and recent applications of optical imaging rely on molecular imaging applied to in vitro and in vivo systems. These techniques aim at high-resolution applications at the single-cell level and for real-time molecular processes to study cancer biology, holding promise in clinical translation for prognosis and treatment.6,7 Many types of semiconductor nanomaterials have been prepared, and the best known is quantum dots (e.g., CdS, CdSe, CuS, and other composites or core–shell nanomaterials8,9). However, they present some disadvantages, such as poor biodistribution or accumulation in target organs with persistent effects (e.g., poisoning, local and/or systemic toxicity, and a lack of final biodegradation in nontoxic products).10
At the current state of knowledge, various approaches have been attempted to replace QDs with less toxic nanostructures as well as to modify their surface chemistry using organic materials such as polymers, lipids, or functional molecules with selective targeting.11−13
To this purpose, biodegradable and biocompatible semiconductor nanomaterials, also equipped with targeting agents, have shown their abilities in therapeutic and imaging applications.14−18 One of the most recent examples is a semiconducting metal oxide in the form of zinc oxide nanocrystals (ZnO NCs) chemically functionalized with organic functional molecules and lipid bilayers from both artificial and natural origin.19−21
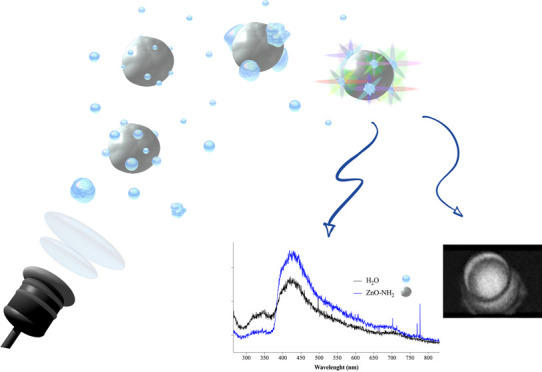
In this paper, we exploit sonoluminescence (SL) augmented by ZnO NCs to produce light for imaging purposes. SL is acknowledged as the emission of light resulting from the implosion of cavitating bubbles that form in a liquid when irradiated by US.22 This implosion generates locally very high temperatures (estimated to be around 5000 °C23) and high pressures (estimated over 500 MPa24) inside the gas bubbles and in the immediate vicinity of the liquid medium.25 These effects can give rise to sonochemical reactions capable of inducing the formation of different reactive oxygen species (ROS). The collapse of the gas bubbles also causes mechanical stress, with the formation of microjets, shock waves, and, in particular, the emission of very short flashes of light.
In the literature, sonoluminescent signals, proven not to be quenched by body temperature,26 should also correlate with the amount of biological damages achieved during the ultrasound exposure of cells. The work of Dezhkunov et al. identified four different stages of cavitation development based on the presence or absence of SL and sound absorption.27 Furthermore, SL could be related with other biological parameters. Cochran et al. indeed established a correlation between the cellular uptake of calcein and viability with SL.28 The presence of nanoparticles (irrespective of their nature) in the liquid medium reduces the dose of US necessary to obtain acoustic inertial cavitation.29 Indeed, nanoparticles tend to carry gas pockets thanks to their structure, roughness, and surface porosity, as we also recently proved.29
SL has a broad emission spectrum that ranges from the ultraviolet (UV) to visible wavelengths and can vary with emission peaks depending on the presence of dissolved gas or salts.30 However, the intensity of SL is per se very low and barely visible, requiring a specific setup for its detection.
It is possible to modify or even amplify the SL emission spectrum by means of particular types of nanoparticles, having well-defined optical properties. In particular, it is supposed that such nanoparticles can act as imaging contrast agents, first by increasing the effects of inertial cavitation and therefore improving the SL signal intensity. Second, in view of their nanometric size, such nanoparticles can allow a better spatial resolution of SL, improving the diagnostic detection. Third, the presence of nanoparticles characterized by specific optical absorption and emission properties can produce well-defined spectral emission in SL, allowing the increase of optical emission peaks or reduction of others in the SL spectral range.
Unlike what was previously reported in the literature, here, we propose a new imaging contrast effect that arises from the combination of ultrasonic irradiation of an aqueous medium with semiconductor ZnO nanocrystals functionalized with aminopropyl groups. This imaging method is not based on echographic contrast but on the sonoluminescence emission supported by ZnO nanocrystals, providing bright luminescence emission and reducing the cavitation threshold at which this phenomenon takes place, decreasing the US dose to be able to produce contrasted images. Furthermore, being ZnO, a semiconductor material, photons of SL can be optically absorbed by the nanoparticles and may be re-emitted at different energies. This optical modification of the SL spectrum can thus generate particular spectral signatures determined by the optical properties of the ZnO semiconductor nanocrystals.
In the present study, we thus propose an innovative nanoparticle-assisted SL phenomenon that we show to be exploitable to provide control over the spectral emission features and, more in general, enhanced SL even using mild ultrasounds, thus avoiding diffuse thermal effects. Sonoluminescence is investigated in water and in biological solutions while spectral information is recorded and analyzed.
To get further insights into the phenomenon and moving toward biomedical applications, here, optical images are presented for the first time both in pure water and in biologically relevant buffers and media. The results of this analysis confirm that in the presence of ZnO NCs, the US power needed for SL evidence is reduced considerably and, most interestingly, we demonstrate the powerful role of these NCs as nanocontrast agents to enhance and further tune the spectral emission of SL.
2. Materials and Methods
2.1. ZnO-NH2 NC Synthesis and Functionalization
ZnO nanoparticles were synthesized through a microwave-assisted synthesis, as reported in ref (31). The reaction path was based on the hydrolysis of the zinc precursor (zinc acetate dihydrate) due to the presence of sodium hydroxide, as the base, in methanol. The as-synthesized ZnO NCs were then functionalized with aminopropyl groups with a postgrafting approach using 3-(aminopropyl)-trimethoxysilane at 10 mol % with respect to the total molar amount of ZnO, as reported in our previous works.20,31
The obtained nanostructures were amine-functionalized zinc oxide nanocrystals (ZnO-NH2 NCs), showing stable colloidal suspensions in both ethanol and bidistilled (b.d.) water.
2.2. ZnO-NH2 NC Characterization
The morphological characterization of ZnO-NH2 NCs was performed by transmission electron microscopy (TEM, FEI Tecnai operating at 200 kV) by spotting a diluted ethanolic solution of the sample (100 μg/mL) on a copper grid with 300 carbon mesh for TEM. The particle size and ζ-potential value of ZnO-NH2 NCs in water suspension were determined by the dynamic light scattering (DLS) technique (Zetasizer Nano ZS90, Malvern).
The crystalline structure of ZnO-NH2 NCs was analyzed by X-ray diffraction (XRD) with a Panalytical X’Pert diffractometer in a Bragg–Brentano configuration (Cu Kα radiation, λ = 1.54 Å, 40 kV and 30 mA).
2.3. SiO2-NH2 NP Synthesis and Characterization
Silica (SiO2) nanoparticles of approximately 20 nm diameter, used as optically inert control, were obtained exploiting the Stobër method.32,33 In particular, 0.558 mL of tetraethyl orthosilicate (TEOS, ≥99% from Sigma-Aldrich) was added to 25 mL of absolute ethanol (99%, Merck). After 15 min of vigorous stirring, 1.018 mL of ammonium hydroxide solution (NH4OH, ACS reagent, 28–30% purchased from Sigma-Aldrich) was rapidly dropped in the solution. The system was left in moderate agitation for 24 h, and the particles were collected afterward by centrifugation. Several washing in ethanol was performed to obtain the final particle suspension.
Silica nanoparticles (SiO2-NPs) were also functionalized with APTMS following the same procedure exploited for ZnO NCs (Section 2.1) to obtain the final SiO2-NH2 nanoparticles. Also, the characterization of these NPs was performed by field-emission scanning electron microscopy (FESEM) and DLS.
2.4. SL with a Photomultiplier Tube
A photomultiplier tube was positioned in front of a well (obtained from a 24-well polystyrene plate from Thermo Scientific) containing 1 mL of the sample consisting of Milli Q bidistilled water or the water suspension of amine-functionalized ZnO NCs at different concentrations of 50, 100, and 200 μg/mL. To perform sonication, the sample well was placed in contact with a commercial ultrasonic transducer with a planar geometry (LipoZero G39, Globus) through a thin layer of ecographic coupling gel (Stosswellen Gel Bestelle, ELvation Medical GmbH). The ultrasonic transducer was operated at a frequency of 1 MHz, duty cycle (DC) of 100%, and different output powers (0.3, 0.6, 0.9, and 1.2 W/cm2 corresponding to 10, 20, 30, and 40% of the maximum output power, respectively).
The sonoluminescence-derived light emission was detected after few seconds of irradiation using a Hamamatsu R7400 photomultiplier tube (PMT) driven by a high voltage power supply (800 V).
To exclude any possible temperature increase, each sample was stored in a fridge at 4 °C until use.
2.5. SL Spectroscopic Signal with a UV–Vis Spectrometer
The light emission produced from the well containing b.d. water, ZnO-NH2 NC (200 μg/mL) water solution or SiO2-NH2 NP (200 μg/mL) water suspensions, was acquired using a multicore optical UV–vis fiber connected to a monochromator (Acton SP 2300), with the setup depicted in Figure 1a. The well was coupled to the US probe with ecographic gel. The monochromator was equipped with a grating blazed at 300 nm (150 g/mm), giving a final wavelength resolution of 1.2 nm; the spectral signal was collected by a CCD camera (Princeton LN) operating at −90 °C. To optimize the signal/noise ratio, 120 s acquisition was collected for each spectrum. The ultrasound irradiation power was varied from 20 to 80% of the maximum power of the ultrasonic transducer, i.e., from 0.6 to 2.4 W/cm2, duty cycle (DC) equal to 100%, and 1 MHz of frequency. SL spectra were measured from the beginning of sonication.
Figure 1.

Scheme of the used setup for (a) sonoluminescence spectroscopy and (b) imaging.
The same apparatus and spectrometer settings were used to measure the light generation from the well when the water solution was saturated with gaseous argon. The cold (4 °C) b.d. water solution was saturated, fluxing Ar for 2 min, and then 2 mL was placed in the well. The solution was irradiated with US for 120 s at 0.9, 1.2, 1.5, 1.8 W/cm2 and 100% DC at 1 MHz. An identical procedure was used when the water solutions contained ZnO-NH2 NCs at a concentration of 200 μg/mL.
The light spectra of SL emitted photons were collected for various media, i.e., physiologic solution (0.9 wt % NaCl), phosphate-buffered saline (PBS, Sigma), live-cell imaging solution (LCI, Molecular Probes, Invitrogen), complete cell culture medium (RPMI-1640, ATCC with 10 vol % fetal bovine serum, ATCC, and 1 vol % penicillin–streptomycin) for culturing cells in vitro, in the presence and absence of ZnO-NH2 NCs at a concentration of 200 μg/mL. Measurements were conducted at 1.2, 1.5, and 1.8 W/cm2, with 2 mL of liquid in the well and 120 s acquisition; each sample solution was maintained at 4 °C right before US irradiation.
Each spectrum was analyzed with MATLAB software.
2.6. SL Imaging
An imaging setup was also implemented to get more reliable data about the total (i.e., quantitative) emission produced by SL in these media. As depicted in Figure 1b, in this case, all of the lights produced into the well were recorded directly on the CCD camera operating in a full chip mode to substantially perform an image of the emitted SL. The image of the well was collected onto the cooled CCD by means of an objective (Yashika lens, ML 28 mm 1:2.8), placed at the proper focal distance, and a mirror was positioned at 45°.
Exposure time was set to 120 s, a volume of 2 mL of sample solutions was placed in the well and irradiated with US at different powers (from 0.9 to 1.5 W/cm2) and 100% DC at 1 MHz. The tested samples were b.d. water, phosphate-buffered saline (PBS, Sigma), live-cell imaging solution (LCI, Molecular Probes, Invitrogen), and complete cell culture medium (RPMI-1640 with 10% fetal bovine serum, ATCC), as reported above. Each liquid was tested in the presence and absence of ZnO-NH2 NCs.
Each set of data was analyzed with MATLAB software to set the same reference scale to all of the images. For all of the images, the amount of illuminated pixels was calculated with MATLAB, considering a specific intensity range for each medium considered.
3. Results and Discussion
ZnO NCs were synthesized by means of a microwave-assisted hydrothermal route, as previously described.31 The ZnO NC surface was then decorated with aminopropyl functional groups and characterized by conventional techniques like X-ray diffraction, TEM, DLS in ethanol, as well as ζ-potential measurements in water. Graphite furnace atomic absorption spectroscopy (GF-AAS) was also used to assess the amine-functionalization amount. All of these characterization results were already reported in previous publications,29,31,34,35 and more details can be found in the Supporting Information (SI), Figure S1 and Table S1.
Briefly, ZnO-NH2 NCs show a size monodistribution ranging from 15 to 25 nm and a single crystalline nature according to the wurtzite habit and almost a spherical morphology. The hydrodynamic diameter of the amino-functionalized ZnO NCs is 100 nm with a strong positive ζ-potential value of +22 mV in water.
Monodispersed spherical SiO2 NPs were obtained through the Stöber method32 with a diameter of approximately 20 nm evaluated by FESEM and hydrodynamic diameter in ethanol of 70 nm, while ζ-potential in water was −22.4 mV. A more detailed description can be found in the SI, Figure S2.
3.1. Sonoluminescence Experiments with a Photomultiplier Tube
A first series of experiments were performed under dark conditions for the detection of light emission given by the irradiation of water-based solutions with the ultrasonic transducer. They were performed using a photomultiplier tube positioned in front of the well containing either simple water or the colloidal solution of amine-functionalized ZnO NCs.
We defined the threshold of cavitation as the US intensity at which we start to measure spikes in the recorded spectrum due to light emission. The threshold for detecting the light emission in pure water was around 20% of the maximum power of the ultrasonic transducer (corresponding to 0.6 W/cm2). As expected, the presence of ZnO-NH2 NCs is able to lower the cavitation threshold, as previously reported.29 This effect allows us to detect the light emission at a lower power intensity (around 0.45 W/cm2) with respect to pure water (Figure 2a). By increasing the ZnO-NH2 NC concentration, the detected photon counts increase. Some differences can also be observed in different media (either water, physiologic solution 0.9 wt % NaCl, phosphate-buffered saline, PBS, live-cell imaging fluid, LCI, or cell culture medium, RPMI), always depending on the NC concentrations (Figure 2b). As reported in detail in the Supplementary Information (Figures S3–S6), the different US power thresholds vary depending on the used medium and NC concentrations. For example, it has to be noted from Figure 2c that the lowering threshold effect expected by ZnO NCs was almost absent when using PBS and cell culture medium RPMI as solutions. Further comments on the SL emission above 20% of the maximum power, i.e., above 0.6 W/cm2, are unreliable since the data collected with the photomultiplier tube refer to very short timescales. Substantially, no differences can be found on the light emission obtained in water or with the ZnO-NH2 nanocrystals. Moreover, the ZnO-NH2 NC concentration seems to display a threshold at 0.45 W/cm2—as observed in Figure 2a, the maximum number of light events is obtained when the ZnO-NH2 NC concentration is equal to 100 μg/mL. This effect can be ascribed to the formation of a bubble population with bigger dimensions than in the previous cases at lower ZnO-NH2 NC concentrations. It could be promoted by the high number of nucleation sites and consequent coalescence phenomena, which, in turn, lead to a reduction of the sonoluminescent bubbles. This intriguing phenomenon was observed in almost all tested media (see Figures S3–S6 in the SI), except in RMPI. We propose that this different behavior in RPMI on the light emission, where no threshold of ZnO-NH2 NC concentration is found, can be attributed to the limited number of nucleation sites, which are shadowed by proteins and other biomolecules present in this medium or adsorbed at the nanoparticle surface as a protein corona.36
Figure 2.

(a) SL photons collected by the photomultiplier tube in water at different concentrations of ZnO-NH2 NCs. (b) Area under the SL spectra collected with the photomultiplier tube in different media at the US power threshold and different concentrations of ZnO-NH2 NCs. (c) US power threshold (data in red) measured for different media and for different ZnO-NH2 NC concentrations.
Focusing the attention on the SL signal obtained for each media at their respective US threshold, 200 μg/mL was the concentration at which the highest overall signal was obtained for three out of five tested solutions, as can be observed in Figure 2b. In view of these results, further experiments were conducted to investigate the UV–vis emission spectra of the detected sonoluminescence, using a fixed concentration of 200 μg/mL.
3.2. SL Spectra Using a UV–Vis Spectrometer
To get more insights on the SL emission in the presence of ZnO-NH2 nanocrystals, an ad hoc setup for acquiring the UV–visible spectra of the SL was implemented, as schematized in Figure 1a.
To record the SL spectra, the ultrasonic power needed was increased from 20 to 80% of the maximum power, i.e., from 0.6 to 2.4 W/cm2. In Figure 3a, the SL spectra in pure water as a function of different US powers are shown, reporting a broad peak covering the whole UV and visible range with a maximum centered around 450 nm. A clear spectrum is visible from the US power intensity of 1.2 W/cm2 (corresponding to 40% of the maximum US power).
Figure 3.

SL spectra in (a) pure water and (b) water-containing ZnO-NH2 NCs at 200 μg/mL concentration for different US powers. SL spectra under argon-saturated conditions at (c) 0.9 W/cm2 and (d) 1.2 W/cm2, underlining the differences in the presence or absence of ZnO-NH2 NCs. (e) Area under the argon-saturated SL spectrum curve from 250 to 350 nm at different US powers with and without ZnO-NH2 NCs. (f) Area under the argon-saturated SL spectrum curve from 400 to 700 nm at different US powers with and without ZnO-NH2 NCs. (g) SL spectra of water containing 200 μg/mL of ZnO-NH2 NCs at different US powers related to the optical properties of NCs.
In the presence of ZnO-NH2 NCs, it is evident that already in the range 0.9–1.2 W/cm2 of US power, the spectra are more intense with respect to the water case. Interestingly, the UV light component of SL is clearly absorbed by the ZnO-NH2 semiconductor (Figure 3b), showing a clear cut of the UV light range emission (from 250 to 350 nm) measured at all ultrasonic powers. It was thus decided to further examine this effect, investigating if the SL intensity increment due to the presence of ZnO-NH2 NCs could be accomplished not only by a complete absorption in the UV range but also by a possible re-emission in the visible light region.
To verify this hypothesis, similar experiments were conducted under an argon-saturated atmosphere to get more intense light emissions (as shown in Figure S7 of the SI). The obtained spectra in Figure 3c,d (and additional spectra in Figure S8 in the SI) strongly confirm the strong UV light absorption by ZnO-NH2 NCs; however, a process of re-emission is barely visible and, if present, is covered up with the remaining emission spectrum.
As a further analysis in this regard, both fluorescence excitation and emission spectra collected by a conventional spectrofluorimeter of the ZnO-NH2 NCs in water were superimposed to the SL emission spectra obtained in the presence of ZnO-NH2 in water at various US powers (from 1.2 to 1.8 W/cm2 as US power). As shown in Figure 3g, it is clear that the ZnO-NH2 excitation range from 200 to 400 nm fairly coincides with the strong SL emission reduction. In contrast, the ZnO-NH2 fluorescence emission in the range from 500 to 650 nm superimposes with the characteristic SL emission from the water system. By measuring the UV absorption spectrum of ZnO-NH2 NCs in water, the band gap value is computed to be 3.32 eV, which is in fair agreement with the literature.21 This result clearly shows that ZnO-NH2 is a wide band gap semiconductor and is able to absorb light in the UV range.
To further analyze the phenomenon, the areas underneath the SL emission spectra were calculated and evaluated in the different emission regions (i.e., UV, from 250 to 350 nm, and visible one, from 400 to 700 nm). Figure 3e shows the area calculated under the curve of the SL spectra from 250 to 350 nm, which overlaps with the portion of the spectrum characterized by ZnO absorption. By increasing the US power, a direct increment of the SL signal in pure water is obtained, which likely corresponds to an increase of the absorption phenomena by ZnO-NH2 NCs, which, in turn, could explain the reduction of the area under the curve in the presence of NCs (and in this portion of the spectrum) for 1.2 and 1.5 W/cm2 irradiation power. For 0.9 W/cm2 instead, we observe a threshold. Here, the generation of SL photons in pure water is very low; therefore, the addition of 200 μg/mL of ZnO-NH2 NCs increases the SL emission but the absorption of the generated photons cannot be appreciated. The threshold observed at 0.9 W/cm2 is particularly evident looking at the portion of the spectrum corresponding to the emission of ZnO, i.e., from 500 to 650 nm. In Figure 3f, the areas under the SL spectrum are also calculated for different US powers from 400 to 700 nm. At 0.9 W/cm2, the amount of SL photons produced is weak when compared to the one in the presence of the NCs under the same operating conditions. This effect means that in pure water, it is difficult to reach the threshold for SL, but when ZnO-NH2 NCs are in solution, the SL signal increases. The same behavior can be appreciated at 1.2 W/cm2. At 1.5 W/cm2, the SL signal generated from pure water is higher, and the SL threshold is largely reached and comparable with the one obtained in the presence of ZnO-NH2 NCs; therefore, the difference between the SL produced in the two cases is no longer visible.
The specific role of ZnO-NH2 NCs as the semiconductor nanoparticles is more evident when considering different materials. ZnO-NH2 NCs were thus substituted with silica nanoparticles (SiO2-NH2) dispersed in water, using the same US irradiation conditions and spectral acquisition parameters. It should also be noted that SiO2 nanoparticles were functionalized with aminopropyl groups.
The recorded spectra are reported in Figure 4 at both 0.9 and 1.8 W/cm2 as US power, as representative examples. It is clear that the SiO2-NH2 nanoparticles also act as cavitation enhancers since they generally increase the SL detection at low US powers (Figure 4a). However, no particular differences in the SL spectrum features can be observed between pure water and the SiO2-NH2 colloidal dispersion (see Figure 4b), as opposed to the dispersion with ZnO-NH2 NCs, where the cutoff of the SL emission in the UV range is evident. More extended data to support the absence of spectral features in the presence of SiO2-NH2 NPs can be found in the SI, Figure S10.
Figure 4.

Sonoluminescence emission spectra acquired at (a) 0.9 W/cm2 and (b) 1.8 W/cm2 for 2 min comparing 2 mL solutions of pure water (black curves), water-containing ZnO-NH2 NCs at 200 μg/mL concentration (red curves), and water-containing silica (SiO2-NH2) nanoparticles at 200 μg/mL concentration (blue curves).
To explore the potential applications of SL for biological imaging, in Figure 5, we report several spectra obtained in different biologically relevant media irradiated at 1.5 W/cm2 of US power both with (Figure 5b) and without (Figure 5a) ZnO-NH2 NCs. Irrespective of the medium used, the cutoff in the UV range produced by the presence of semiconducting NCs is evident. It is thus possible to confirm the capability to have not only an SL emission from various water-based media but also that the presence of ZnO-NH2 NCs can impart a clear signature to the SL spectrum. Spectra acquired at different US powers are shown in the SI, Figure S9. In these cases, as well, an increment of the light emission at around 30–40% of the maximum US power appears evident, i.e., at 0.9 and 1.2 W/cm2, when ZnO-NH2NCs are used, and a clear cutoff of the light emission in the UV range is confirmed. Again, this is a verification of the potentialities in using the ZnO-NH2 NCs as contrast agents for sonoluminescence.
Figure 5.

SL spectra obtained from various biologically relevant media like phosphate-buffered saline (PBS) and live-cell imaging (LCI) used under fluorescence microscopy for imaging of living cells and cell culture medium (RPMI) in comparison with SL from pure water (a) in the absence of nanoparticles dispersed in the solution and (b) with ZnO-NH2 NCs at 200 μg/mL concentration. US power = 1.5 W/cm2.
As already observed in the previous experiments with the photomultiplier tube, the emission intensity decreases and its spectrum modifies when using complex media rich in proteins and other biomolecules, such as cell culture media, while comparable high intensities and spectra profiles are obtained with buffers such as PBS and LCI. This is another proof supporting the idea that ZnO-NH2 nanocrystals can be used as contrast agents to produce enhanced sonoluminescence signals in biologically relevant fluids, and further experiments in the presence of living cells can be carried out in the future to prove this concept.
3.3. Sonoluminescence Imaging
The data obtained with the CCD camera connected to the spectrofluorimeter give information on the spectral distribution of SL photons generated during a few seconds of ultrasound irradiation. Despite the fact that the single sonoluminescence phenomenon occurs in a very short period of time, i.e., less than 1 ns, recording the amount of SL photons produced during a larger amount of time could be useful to evaluate the overall generation of light and its spatial distribution inside the sample, giving quantitative information on SL in the tested samples.
To perform these measurements, a different experimental configuration has been set, as schematized in Figure 1b. In this way, it is possible to overcome the limitations of the photomultiplier tube highlighted in Section 2.1, which are related to the limited collection angle of the fiber. To acquire an image of the sample well, the SL emitted light was collected using the cooled CCD camera as an imaging recorder. A mirror tilted at 45° above the sample and a standard camera objective allowed us to create an image of the well on the CCD sensor. By design, camera objectives filter out ultraviolet light, therefore the images acquired refer only to the visible portion of the spectrum. By comparing the acquired images at different US power intensities, it is evident how the SL light emitted in the presence of ZnO-NH2 NCs is higher than that in their absence. Indeed, Figure 6 clearly shows the threshold of SL at 0.9 W/cm2 of US power, where sonoluminescence is actually visible only for the nanocrystal water dispersion. This finding is also supported by the total number of illuminated pixels calculated for the images obtained at 0.9 W/cm2 US power, as reported in the SI, Figure S11, which is four times higher in the presence of ZnO-NH2 NCs than the total number of pixels in pure water.
Figure 6.

SL imaging in pure water at (a) 0.9 W/cm2, (c) 1.2 W/cm2, and (e) 1.5 W/cm2, and in water-containing ZnO-NH2 NCs (concentration: 200 μg/mL) at (b) 0.9 W/cm2, (d) 1.2 W/cm2, and (f) 1.5 W/cm2.
We also acquired the images in different biological media, such as cell culture media RPMI, live-cell imaging, and PBS buffers (Figure 7). We observed SL emission differences even in these cases with or without the ZnO-NH2 NCs. The major difference has been found using the live-cell imaging buffer, where the number of illuminated pixels is twice higher in the presence of ZnO-NH2 NCs with respect to the pure media, as reported in the SI, Figure S12.
Figure 7.

SL imaging in biologically relevant fluids: (a) Live-cell imaging buffer without US irradiation (0 W/cm2) at (b) 0.9 W/cm2 and (c) 0.9 W/cm2 in the presence of ZnO-NH2 NCs at 200 μg/mL concentration; (d) PBS at no US irradiation (0 W/cm2); (e) at 0.9 W/cm2 and (f) 0.9 W/cm2 in the presence of ZnO-NH2 NCs at 200 μg/mL concentration; (g) cell culture medium RPMI at no US irradiation (0% power) at (h) 0.9 W/cm2 and (i) 0.9 W/cm2 in the presence of ZnO-NH2 NCs at 200 μg/mL concentration.
This is attributed to the limit of the experimental condition, i.e., only 30% of the maximum US power (0.9 W/cm2) was tested, and the presence of various salts in the medium. For example, using PBS, the SL light emission is already high without ZnO-NH2 NCs, revealing that, for each medium, different operating conditions have to be set to exploit the SL generation enhancement and exploit ZnO-NH2 nanocrystals as nanocontrast agents.
4. Conclusions
Biological applications of SL have been debated over the last 20 years,37 and more recently, studies on ultrasonic activation of light-sensitive nanoparticles for therapy have been published.38 However, the first data were not too accurate and, till now, a careful analysis of the light emission spectra and absorption effect from nanoparticles or organic molecules in biological media is still lacking. In this paper, we demonstrated the ability of ZnO-NH2 NCs to enhance the SL emission under low-intensity ultrasound irradiation revealing their potential use as a nanocontrast agent for therapeutic applications.
The measurements reported here evidenced the increase of SL emission, as the ZnO-NH2 NC concentration in aqueous solutions increases, and the decrease of the US power necessary to detect the SL signal when NCs are present. Furthermore, this phenomenon has been observed, for the first time to our knowledge, in biological cell culture media like LCI. An influence of the ZnO-NH2 NC concentration on the light emission detected by PMT has been observed and it could be explained by the well-known effects occurring in liquids exposed to higher intensity ultrasounds (i.e., formation of bigger cluster of bubbles—the consequent acoustic absorption/shielding of the collapsing events—lowering or threshold appearance on the total light emission as the case for the acoustic emissions, noise spectra, and so on). The concentration of 200 μg/mL was the one at which the highest overall signal was measured for three out of five tested solutions for a fixed value of US power (0.9 W/cm2).
SL spectra displayed a specific shape in the presence of our ZnO-NH2 NCs: the UV light component of SL is evidently absorbed by the semiconductor, resulting in a cutoff of the UV range emission. However, at very low acoustic intensities, a slight increase of visible contribution seems to be present and, to confirm it, experiments with the Ar saturate solution have been carried out. This phenomenon was observed in water as well as in different media for biological applications, such as LCI and PBS.
Finally, the elaboration of the SL optical images recorded in the visible region (see the SI) allowed us to get more insights into this effect. As expected, looking also at the spectra in Figure 3a,b, at the intensity range of 0.9–1.5 W/cm2, the SL emission was more intense, or even “visible only”, when ZnO-NH2 NCs were present in the solution.
These results clearly indicate an SL generation enhancement by ZnO-NH2 NCs, proposing them as nanocontrast agents not only in water solution but also in buffered media like PBS and LCI. The ability of NCs to increase the SL emission at low acoustic intensities and their potential uptake20,35,39 by living cells open the use of these nanocontrast agents for further experiments at the microscopic level, as they could reveal some new detailed mechanisms of cavitation and sonoluminescence effects into cells and biological media.
Acknowledgments
The fruitful discussion with Prof. Emiliano Descrovi is gratefully acknowledged.
Glossary
Abbreviations
- SL
sonoluminescence
- ZnO NCs
zinc oxide nanocrystals
- US
ultrasound
- UV
ultraviolet
- ROS
reactive oxygen species
- PBS
phosphate-buffered saline
- LCI
live-cell imaging fluid
- RPMI
cell culture medium
- TEM
transmission electron microscopy
- DLS
dynamic light scattering
- XRD
X-ray diffraction
- FESEM
field-emission scanning electron microscopy
- DC
duty cycle
- PMT
photomultiplier tube
Supporting Information Available
The Supporting Information is available free of charge at https://pubs.acs.org/doi/10.1021/acsomega.1c05837.
Complete characterization of ZnO-NH2 NCs by TEM, XRD, and DLS analysis, and of SiO2-NH2 NPs by FESEM and DLS analysis; SL data obtained from the photomultiplier tube at different US powers in different media (water, physiologic solution, LCI, PBS); SL spectra in water with and without argon saturation with and without ZnO-NH2 NCs; SL spectra in water with and without SiO2-NH2 NCs; and SL spectra in different media (water, physiologic solution, LCI, PBS) (PDF)
Author Contributions
The manuscript was written through contributions of all authors. All authors have given approval to the final version of the manuscript.
This work had received funding from the European Research Council (ERC) under the European Union’s Horizon 2020 research and innovation program (grant agreement no. 678151—Project Acronym “TROJANANOHORSE”—ERC starting Grant).
The authors declare no competing financial interest.
Supplementary Material
References
- Salehipour M.; Rezaei S.; Mosafer J.; Pakdin-Parizi Z.; Motaharian A.; Mogharabi-Manzari M. Recent Advances in Polymer-Coated Iron Oxide Nanoparticles as Magnetic Resonance Imaging Contrast Agents. J. Nanopart. Res. 2021, 23, 48 10.1007/s11051-021-05156-x. [DOI] [Google Scholar]
- Gu L.; Cao X.; Mukhtar A.; Wu K. Fe/Mn Multilayer Nanowires as Dual Mode T1–T2 Magnetic Resonance Imaging Contrast Agents. J. Biomed. Mater. Res., Part B 2021, 109, 477–485. 10.1002/jbm.b.34715. [DOI] [PubMed] [Google Scholar]
- Sharma B.; Grandjean J.; Phillips M.; Kumar A.; Mandino F.; Yeow L. Y.; Low K. J. Y.; Nandwana V.; Dravid V. P.; Bengang X.; Lim S.; Pervushin K. Lipocalin-Type Prostaglandin d Synthase Conjugates as Magnetic Resonance Imaging Contrast Agents for Detecting Amyloid B-Rich Regions in the Brain of Live Alzheimer’s Disease Mice. Adv. Nanobiomed. Res. 2021, 1, 2100019 10.1002/anbr.202100019. [DOI] [Google Scholar]
- Menon J. U.; Jadeja P.; Tambe P.; Vu K.; Yuan B.; Nguyen K. T. Nanomaterials for Photo-Based Diagnostic and Therapeutic Applications. Theranostics 2013, 3, 152–166. 10.7150/thno.5327. [DOI] [PMC free article] [PubMed] [Google Scholar]
- Hassanpour S.; Baradaran B.; de la Guardia M.; Baghbanzadeh A.; Mosafer J.; Hejazi M.; Mokhtarzadeh A.; Hasanzadeh M. Diagnosis of Hepatitis via Nanomaterial-Based Electrochemical, Optical or Piezoelectrical Biosensors: A Review on Recent Advancements. Microchim. Acta 2018, 185, 568 10.1007/s00604-018-3088-8. [DOI] [PubMed] [Google Scholar]
- Neves A. A.; Brindle K. M. Assessing Responses to Cancer Therapy Using Molecular Imaging. Biochim. Biophys. Acta, Rev. Cancer 2006, 1766, 242–261. 10.1016/j.bbcan.2006.10.002. [DOI] [PubMed] [Google Scholar]
- Torigian D. A.; Huang S. S.; Houseni M.; Alavi A. Functional Imaging of Cancer with Emphasis on Molecular Techniques. Ca-Cancer J. Clin. 2007, 57, 206–224. 10.3322/canjclin.57.4.206. [DOI] [PubMed] [Google Scholar]
- Kang K. M.; Kim H.-W.; Shim I.-W.; Kwak H.-Y. In Syntheses of Specialty Nanomaterials at the Multibubble Sonoluminescence Condition, Volume 15: Processing and Engineering Applications of Novel Materials, ASMEDC: Boston, Massachusetts, USA, 2008; pp 101–103.
- Park J.; Hwang C. H.; Lee W. Y.; Kim Y.; Kim H.; Shim I.-W. Preparation of Size-Tunable SnS Nanoparticles by a Sonochemical Method under Multibubble Sonoluminescence Conditions. Mater. Lett. 2014, 117, 188–191. 10.1016/j.matlet.2013.11.115. [DOI] [Google Scholar]
- Ballou B. Quantum Dot Surfaces for Use In Vivo and In Vitro. Curr. Top. Dev. Biol. 2005, 70, 103–120. 10.1016/S0070-2153(05)70005-3. [DOI] [PubMed] [Google Scholar]
- Michalet X.; Pinaud F. F.; et al. Quantum Dots for Live Cells, in Vivo Imaging, and Diagnostics. Science 2005, 307, 538–544. 10.1126/science.1104274. [DOI] [PMC free article] [PubMed] [Google Scholar]
- Bilan R.; Fleury F.; Nabiev I.; Sukhanova A. Quantum Dot Surface Chemistry and Functionalization for Cell Targeting and Imaging. Bioconjugate Chem. 2015, 26, 609–624. 10.1021/acs.bioconjchem.5b00069. [DOI] [PubMed] [Google Scholar]
- Al-Jamal W. T.; Al-Jamal K. T.; Tian B.; Cakebread A.; Halket J. M.; Kostarelos K. Tumor Targeting of Functionalized Quantum Dot–Liposome Hybrids by Intravenous Administration. Mol. Pharmaceutics 2009, 6, 520–530. 10.1021/mp800187d. [DOI] [PubMed] [Google Scholar]
- Shi H.; Sun Y.; Yan R.; Liu S.; Zhu L.; Liu S.; Feng Y.; Wang P.; He J.; Zhou Z.; Ye D. Magnetic Semiconductor Gd-Doping CuS Nanoparticles as Activatable Nanoprobes for Bimodal Imaging and Targeted Photothermal Therapy of Gastric Tumors. Nano Lett. 2019, 19, 937–947. 10.1021/acs.nanolett.8b04179. [DOI] [PubMed] [Google Scholar]
- Wei W.; Zhang X.; Zhang S.; Wei G.; Su Z. Biomedical and Bioactive Engineered Nanomaterials for Targeted Tumor Photothermal Therapy: A Review. Mater. Sci. Eng., C 2019, 104, 109891 10.1016/j.msec.2019.109891. [DOI] [PubMed] [Google Scholar]
- Kairdolf B. A.; Qian X.; Nie S. Bioconjugated Nanoparticles for Biosensing, in Vivo Imaging, and Medical Diagnostics. Anal. Chem. 2017, 89, 1015–1031. 10.1021/acs.analchem.6b04873. [DOI] [PubMed] [Google Scholar]
- Stahl T.; Bofinger R.; Lam I.; Fallon K. J.; Johnson P.; Ogunlade O.; Vassileva V.; Pedley R. B.; Beard P. C.; Hailes H. C.; Bronstein H.; Tabor A. B. Tunable Semiconducting Polymer Nanoparticles with INDT-Based Conjugated Polymers for Photoacoustic Molecular Imaging. Bioconjugate Chem. 2017, 28, 1734–1740. 10.1021/acs.bioconjchem.7b00185. [DOI] [PMC free article] [PubMed] [Google Scholar]
- Racca L.; Cauda V. Remotely Activated Nanoparticles for Anticancer Therapy. Nano-Micro Lett. 2021, 13, 11 10.1007/s40820-020-00537-8. [DOI] [PMC free article] [PubMed] [Google Scholar]
- Dumontel B.; Susa F.; Limongi T.; Canta M.; Racca L.; Chiodoni A.; Garino N.; Chiabotto G.; Centomo M. L.; Pignochino Y.; Cauda V. ZnO Nanocrystals Shuttled by Extracellular Vesicles as Effective Trojan Nano-Horses against Cancer Cells. Nanomedicine 2019, 14, 2815–2833. 10.2217/nnm-2019-0231. [DOI] [PMC free article] [PubMed] [Google Scholar]
- Dumontel B.; Canta M.; Engelke H.; Chiodoni A.; Racca L.; Ancona A.; Limongi T.; Canavese G.; Cauda V. Enhanced Biostability and Cellular Uptake of Zinc Oxide Nanocrystals Shielded with a Phospholipid Bilayer. J. Mater. Chem. B 2017, 5, 8799–8813. 10.1039/C7TB02229H. [DOI] [PMC free article] [PubMed] [Google Scholar]
- Carofiglio M.; Barui S.; Cauda V.; Laurenti M. Doped Zinc Oxide Nanoparticles: Synthesis, Characterization and Potential Use in Nanomedicine. Appl. Sci. 2020, 10, 5194 10.3390/app10155194. [DOI] [PMC free article] [PubMed] [Google Scholar]
- Crum L. A. Resource Paper: Sonoluminescence. J. Acoust. Soc. Am. 2015, 138, 2181–2205. 10.1121/1.4929687. [DOI] [PubMed] [Google Scholar]
- Suslick K. S.; Flannigan D. J. Inside a Collapsing Bubble: Sonoluminescence and the Conditions During Cavitation. Annu. Rev. Phys. Chem. 2008, 59, 659–683. 10.1146/annurev.physchem.59.032607.093739. [DOI] [PubMed] [Google Scholar]
- Pflieger R.; Fayard E.; Noel C.; Nikitenko S. I.; Belmonte T. Molecular Emissions in Sonoluminescence Spectra of Water Sonicated under Ar-Based Gas Mixtures. Ultrason. Sonochem. 2019, 58, 104637 10.1016/j.ultsonch.2019.104637. [DOI] [PubMed] [Google Scholar]
- Suslick K. S. Sonochemistry. Science 1990, 247, 1439–1445. 10.1126/science.247.4949.1439. [DOI] [PubMed] [Google Scholar]
- Eastwood L. M.; Watmough D. J. Sonoluminescence, in Water and in Human Blood Plasma, Generated Using Ultrasonic Therapy Equipment. Ultrasound Med. Biol. 1977, 2, 319–323. 10.1016/0301-5629(77)90033-3. [DOI] [PubMed] [Google Scholar]
- Dezhkunov N. V.; Francescutto A.; Serpe L.; Canaparo R.; Cravotto G. Sonoluminescence and Acoustic Emission Spectra at Different Stages of Cavitation Zone Development. Ultrason. Sonochem. 2018, 40, 104–109. 10.1016/j.ultsonch.2017.04.004. [DOI] [PubMed] [Google Scholar]
- Cochran S. A.; Prausnitz M. R. Sonoluminescence as an Indicator of Cell Membrane Disruption by Acoustic Cavitation. Ultrasound Med. Biol. 2001, 27, 841–850. 10.1016/S0301-5629(01)00382-9. [DOI] [PubMed] [Google Scholar]
- Ancona A.; Troia A.; Garino N.; Dumontel B.; Cauda V.; Canavese G. Leveraging Re-Chargeable Nanobubbles on Amine-Functionalized ZnO Nanocrystals for Sustained Ultrasound Cavitation towards Echographic Imaging. Ultrason. Sonochem. 2020, 67, 105132 10.1016/j.ultsonch.2020.105132. [DOI] [PubMed] [Google Scholar]
- Pflieger R.; Nikitenko S. I.; Ashokkumar M. Effect of NaCl Salt on Sonochemistry and Sonoluminescence in Aqueous Solutions. Ultrason. Sonochem. 2019, 59, 104753 10.1016/j.ultsonch.2019.104753. [DOI] [PubMed] [Google Scholar]
- Garino N.; Limongi T.; Dumontel B.; Canta M.; Racca L.; Laurenti M.; Castellino M.; Casu A.; Falqui A.; Cauda V. A Microwave-Assisted Synthesis of Zinc Oxide Nanocrystals Finely Tuned for Biological Applications. Nanomaterials 2019, 9, 212 10.3390/nano9020212. [DOI] [PMC free article] [PubMed] [Google Scholar]
- Stöber W.; Fink A.; Bohn E. Controlled Growth of Monodisperse Silica Spheres in the Micron Size Range. J. Colloid Interface Sci. 1968, 26, 62–69. 10.1016/0021-9797(68)90272-5. [DOI] [Google Scholar]
- Bogush G. H.; Tracy M. A.; Zukoski C. F. Preparation of Monodisperse Silica Particles: Control of Size and Mass Fraction. J. Non-Cryst. Solids 1988, 104, 95–106. 10.1016/0022-3093(88)90187-1. [DOI] [Google Scholar]
- Vighetto V.; Ancona A.; Racca L.; Limongi T.; Troia A.; Canavese G.; Cauda V. The Synergistic Effect of Nanocrystals Combined With Ultrasound in the Generation of Reactive Oxygen Species for Biomedical Applications. Front. Bioeng. Biotechnol. 2019, 7, 374 10.3389/fbioe.2019.00374. [DOI] [PMC free article] [PubMed] [Google Scholar]
- Racca L.; Limongi T.; Vighetto V.; Dumontel B.; Ancona A.; Canta M.; Canavese G.; Garino N.; Cauda V. Zinc Oxide Nanocrystals and High-Energy Shock Waves: A New Synergy for the Treatment of Cancer Cells. Front. Bioeng. Biotechnol. 2020, 8, 577 10.3389/fbioe.2020.00577. [DOI] [PMC free article] [PubMed] [Google Scholar]
- Kopac T. Protein Corona, Understanding the Nanoparticle–Protein Interactions and Future Perspectives: A Critical Review. Int. J. Biol. Macromol. 2021, 169, 290–301. 10.1016/j.ijbiomac.2020.12.108. [DOI] [PubMed] [Google Scholar]
- He Y.; Xing D.; Tan S.; Tang Y.; Ueda K. In Vivo Sonoluminescence Imaging with the Assistance of FCLA. Phys. Med. Biol. 2002, 47, 1535–1541. 10.1088/0031-9155/47/9/308. [DOI] [PubMed] [Google Scholar]
- Lafond M.; Yoshizawa S.; Umemura S.-i. Sonodynamic Therapy: Advances and Challenges in Clinical Translation: Clinical Translation of Sonodynamic Therapy. J. Ultrasound Med. 2019, 38, 567–580. 10.1002/jum.14733. [DOI] [PubMed] [Google Scholar]
- Carofiglio M.; Laurenti M.; Vighetto V.; Racca L.; Barui S.; Garino N.; Gerbaldo R.; Laviano F.; Cauda V. Iron-Doped ZnO Nanoparticles as Multifunctional Nanoplatforms for Theranostics. Nanomaterials 2021, 11, 2628 10.3390/nano11102628. [DOI] [PMC free article] [PubMed] [Google Scholar]
Associated Data
This section collects any data citations, data availability statements, or supplementary materials included in this article.