

Abstract
Background:
Aortic elastic properties have been related to coronary artery disease (CAD) morbidity and mortality. We aimed to assess the relation of aortic elasticity indices to the severity and complexity of CAD assessed using the SYNTAX Score (SS), evaluating which of these indices have better predictivity for CAD severity.
Materials and Methods:
We prospectively enrolled 150 individuals who underwent elective coronary angiography for suspected CAD, out of them 29 (19.3%) had normal or nonsignificant angiographic findings (Group I), whereas 121 (80.7%) had significant CAD (Group II) for whom the SS was calculated. Echo-derived aortic elasticity indices were performed for all patients.
Results:
Logistic regression analyses showed that each of aortic distensibility, stiffness index, elastic modulus, aortic strain, and aortic peak early diastolic velocity were predictors for significant CAD and further for more complex CAD as indicated by intermediate-high SS. Receiver operator characteristic curves-derived cutoff points were performed for each of the aortic elasticity indices. Along with diabetes, decreased aortic strain ≤10.2% was the only independent predictor of intermediate-high SS (odds ratio = 4.31, 95% confidence interval = 1.38–13.50, P = 0.01).
Conclusion:
Simple M-mode derived aortic elasticity indices, particularly aortic strain ≤10.2%, might predict patients with more severe and complex CAD.
Keywords: Aortic stiffness, distensibility, echocardiography, syntax score
INTRODUCTION
Coronary artery disease (CAD) has been found to be associated with increased aortic stiffness (AS) and decreased distensibility (aortic distensibility [AD]), reflecting the elastic properties of the aorta.[1] Both have been shown as risk factors, as well as predictors for CAD morbidity and mortality.[2,3]
Systemic, regional, and local arterial stiffness can be measured by various invasive[4,5] and noninvasive methods.[6] Echocardiography-derived indices have been proven to be reliable and versatile measures of aortic elasticity including simple M-mode measurements,[7] aortic propagation velocity by color M-mode Doppler,[8] aortic upper-wall velocities by tissue Doppler imaging (TDI),[7] and two-dimensional speckle tracking measurements of global circumferential and radial strain of the ascending aorta.[9]
Some studies reported the association between AD and stiffness indices and severity of coronary atherosclerosis assessed by either the Gensini score[1] or the SYNTAX Score (SS),[10] however with no clear cutoff points for such indices. The SS is a lesion-based angiographic scoring system originally devised to grade the complexity of CAD. It is related to adverse cardiovascular events, predicting mortality and morbidity.[11]
Using simple M-mode aortic diameters and blood pressure measurements as well as TDI-derived velocities of the ascending aorta, a number of AS and distensibility indices were derived. The current study aimed to assess the relation of such indices to the presence of significant CAD and its complexity as determined by the SS, evaluating which of them have better predictivity for more severe and complex CAD using our receiver operator characteristic (ROC) curves-derived cutoff values.
MATERIALS AND METHODS
The study included 150 patients presenting to our department from October 2017 to March 2018, and undergoing elective coronary angiography for diagnosing CAD based on patient's symptoms, electrocardiogram changes, or ischemia detected by stress testing or prior admission due to ischemic chest pain. The study excluded patients with controlled/uncontrolled hypertension, previous percutaneous coronary intervention or coronary artery bypass grafting, known renal disease, decompensated liver disease, connective tissue diseases, aortic valve disease (>mild stenosis or regurgitation), and those with impaired left ventricular (LV) systolic function (Ejection fraction <50%).
All patients were subjected to full history taking to assess for known risk factors of CAD, as well as for the use of medications that might alter the disease state (beta-blockers [BB], angiotensin-converting enzyme inhibitors [ACEIs], angiotensin receptor blockers [ARBs], and lipid-lowering drugs). Physical examination was performed, measuring systolic (SBP) and diastolic (DBP) blood pressures, and calculating the pulse pressure (PP) = (SBP-DBP).
All patients were examined by transthoracic echocardiography using a Vivid S5 machine (GE Medical Systems) with subjects in left lateral decubitus position. Echo-measurements for aortic elasticity indices were blinded to the results of coronary angiography. Ascending aorta diameters were measured from the parasternal long axis view with M-mode tracing at a level of 3 cm above the aortic valve. The systolic diameter (AoS) was measured at the maximum anterior motion of the aorta. The diastolic diameter (AoD) was measured at the peak of the QRS complex on simultaneously recorded echocardiograms [Figure 1]. Elastic properties of the aorta were indexed by calculation of AD, stiffness index (SI), strain, and Elastic modulus E (p) as follows.[12,13,14]
Figure 1.
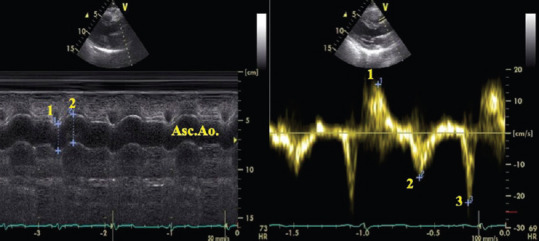
Transthoracic echocardiography of the ascending aorta in parasternal long-axis view M-mode (left) and pulse-wave tissue Doppler imaging (right) showing the measurement of aortic (1: diastolic, 2: systolic) diameters and systolic (1:SAo), early diastolic (2:EAo), and late diastolic (3:AAo) aortic wall velocities. The measurements were made at the same point at a level 3 cm above the aortic cusps
AD = 2× (AoS − AoD)/(AoD × PP) (cm2/dyn/103).
Aortic SI = ln (SBP/DBP)/([AoS − AoD]/AoD) (ln = natural logarithm), calculated with both the logarithmic and nonlogarithmic transformation.
Aortic strain (%) = (AoS − AoD)/AoD (%).
Elastic modulus E (p) = (SBP − DBP)/strain (Kpa).
Aortic upper-wall velocities (cm/s) were measured by pulsed-wave TDI at the same point as the M-mode measurements [Figure 1] including: Aortic-peak systolic (SAo), peak early diastolic (EAo), and peak late diastolic (AAo) velocities.[7]
Coronary angiography was done according to standardized protocols. Patients were classified as Group I: those without significant CAD (nonsignificant luminal stenosis <50% or normal lunimography) and Group II: those with significant CAD (having at least one lesion in a major epicardial vessel of ≥50% luminal stenosis). Severity of CAD was further assessed by SS I, which was calculated with a computer-based program as the sum of the points assigned for each coronary lesion producing ≥50% luminal obstruction in vessels with a diameter of ≥1.5 mm. Patients were divided according to the SS into three tertiles: Low-SS ≤22, intermediate-SS ≥23–≤32, and high-SS ≥33.[11]
The study was approved by our institutional ethical committee, and patients consented to participate in the study.
Statistical analysis
Data were analyzed using SPSS 20 statistical software (SPSS Inc., Chicago, IL, USA). Continuous data were expressed as mean ± standard deviation, whereas nominal data was expressed as frequency (percentage). Chi-square test was used to compare nominal data, whereas unpaired Student t-test was used to compare continuous variables. Pearson's correlation was used to determine the correlation between echo-derived aortic indices. ROC curves for detecting significant CAD were used to derive cutoff points for different aortic elasticity indices. Univariate and multivariate logistic regression analyses were used to determine predictors of significant CAD as well as predictors of more severe and complex CAD based on categorizing patients into those with low SS (≤22) versus those with intermediate-high SS (>22). Variables with P < 0.05 on univariate analysis were included in a multivariate model. To avoid multicollinearity of interrelated aortic elasticity indices, each was analyzed separately in multivariate regression analysis models adjusted for other relevant variables, with the highest odd's ratio of the covariates being displayed. P value was significant if < 0.05.
RESULTS
The current study included 150 individuals undergoing elective coronary angiography, out of whom 29 (19.3%) had normal coronaries or nonsignificant CAD (Group I), whereas 121 (80.7%) had significant CAD (Group II). Mean age and proportion of males were significantly higher in Group II compared to Group I [Table 1].
Table 1.
Clinical and echocardiographic data of the study population
| All individuals (n=150) | Group I Nonsignificant CAD (n=29) | Group II Significant CAD (n=121) | P | |
|---|---|---|---|---|
| Age (years) | 54.23±9.77 | 50.21±8.72 | 55.19±9.80 | 0.01 |
| Male gender, n (%) | 111 (74.0) | 12 (41.4) | 99 (81.8) | 0.001 |
| Smoking, n (%) | 62 (41.3) | 7 (24.1) | 55 (45.5) | 0.03 |
| Diabetes mellitus, n (%) | 56 (37.3) | 5 (17.2) | 51 (42.1) | 0.01 |
| BMI (kg/m2) | 29.64±3.36 | 28.36±2.85 | 29.95±3.41 | 0.02 |
| ACEIs/ARBs, n (%) | ||||
| No ACEIs/ARBs | 41 (27.3) | 9 (31.0) | 32 (26.4) | 0.66 |
| <3 months duration | 57 (38.0) | 12 (41.4) | 45 (37.2) | |
| >3 months duration | 52 (34.7) | 8 (27.6) | 44 (36.4) | |
| Beta blockers, n (%) | ||||
| No BB | 14 (9.3) | 5 (17.2) | 9 (7.4) | 0.24 |
| <3 months duration | 74 (49.4) | 14 (48.3) | 60 (49.6) | |
| >3 months duration | 62 (41.3) | 10 (34.5) | 52 (43.0) | |
| Lipid lowering agents, n (%) | ||||
| None | 13 (8.7) | 5 (17.2) | 8 (6.6) | 0.18 |
| <3 months duration | 75 (50.0) | 13 (44.8) | 62 (51.2) | |
| >3 months duration | 62 (41.3) | 11 (37.9) | 51 (42.1) | |
| Cholesterol (mg/dl) | 171.64±42.93 | 167.07±41.08 | 172.74±43.45 | 0.52 |
| Triglyceride (mg/dl) | 142.50±55.73 | 128.76±35.72 | 145.79±59.18 | 0.14 |
| LDL (mg/dl) | 106.07±36.76 | 107.31±34.30 | 105.78±37.45 | 0.84 |
| HDL (mg/dl) | 44.27±8.44 | 45.14±6.49 | 44.06±8.85 | 0.53 |
| HR (beat/minute) | 75.81±9.05 | 77.59±8.51 | 75.38±9.16 | 0.24 |
| SBP (mmHg) | 122.0±7.8 | 122.4±7.4 | 121.9±7.9 | 0.75 |
| DBP (mmHg) | 75.4±5.3 | 76.9±4.7 | 75.04±5.4 | 0.09 |
| PP (mmHg) | 46.6±7.8 | 45.5±6.8 | 46.8±8.1 | 0.41 |
| Ejection fraction (%) | 61.86±7.16 | 62.24±7.68 | 61.77±7.06 | 0.75 |
| E/A ratio | 0.98±0.27 | 1.05±0.25 | 0.96±0.27 | 0.09 |
| E/e` (average) ratio | 7.62±2.40 | 7.14±2.33 | 7.74±2.41 | 0.23 |
| Ao syst diameter (mm) | 32.77±2.61 | 30.79±2.79 | 33.24±2.34 | 0.001 |
| Ao diast diameter (mm) | 29.95±2.46 | 27.90±2.61 | 30.45±2.16 | 0.001 |
| Diameter difference (mm) | 2.81±0.56 | 2.90±0.61 | 2.79±0.54 | 0.37 |
| Aodistensibility (cm2/dyn/103) | 4.16±1.11 | 4.66±1.14 | 4.04±1.07 | 0.007 |
| Stiffness index (logarithmic) | 5.34±1.48 | 4.66±1.24 | 5.50±1.50 | 0.006 |
| Stiffness index (nonlogarithmic) | 17.99±4.20 | 16.02±3.75 | 18.46±4.17 | 0.004 |
| Elastic modulus (dyn/cm2) | 516.06±144.24 | 455.37±119.40 | 530.6±146.30 | 0.01 |
| Elastic modulus (KPa) | 68.63±19.18 | 60.56±15.88 | 70.57±19.45 | 0.01 |
| Aortic strain (%) | 9.43±1.98 | 10.43±2.34 | 9.19±1.82 | 0.002 |
| SAo (cm/s) | 7.31±2.18 | 8.07±2.12 | 7.12±2.16 | 0.03 |
| EAo (cm/s) | 9.09±2.31 | 10.62±2.33 | 8.72±2.16 | 0.001 |
| AAo (cm/s) | 12.69±2.43 | 13.14±2.61 | 12.58±2.38 | 0.26 |
A=Transmitral A wave, AAo=Aorta peak late diastolic velocity, ACEIs/ARBs=Angiotensin converting enzyme inhibitors/angiotensin receptor blockers, Ao=Aorta, BMI=Body mass index, CAD=Coronary artery disease, DBP=Diastolic blood pressure, Diast=Diastolic, E=Transmitral E wave, EAo=Aorta peak early diastolic velocity, HDL=High density lipoprotein, HR=Heart rate, LDL=Low density lipoprotein, PP=Pulse pressure, SBP=Systolic blood pressure, SAo=Aorta peak systolic velocity, Sys=Systolic
Patients of Group II had significantly higher rates of smoking, diabetes, as well as higher body mass index (BMI) compared to Group I patients. Both short-(<3 months) and long-term (>3 months) use of medications (BB, ACEIs/ARBs, and lipid-lowering drugs) were comparable among both groups. Systolic and diastolic blood pressures and PP showed comparable mean values among both groups.
Echocardiographic findings among the study population
Both groups showed no significant difference for systolic and diastolic LV function parameters. Regarding aortic diameters, Group II had significantly higher mean aortic systolic and diastolic diameters compared to Group I. On calculating distensibility and stiffness indices based on M-mode derived aortic diameters, Group II had significantly lower AD and significantly lower strain compared to Group I. On the other hand, SI and elastic modulus were significantly higher in Group II. Regarding TDI-derived aortic velocities, Group II had significantly lower SAo and EAo velocities compared to Group I [Table 1].
Studying the correlation between different echo-derived indices of AD and AS, there was a strong significant negative correlation between AD and each of SI and elastic modulus (r = −0.87 and −0.93, respectively, P < 0.001 for both). AD was strongly positively correlated to aortic strain (r = 0.72, P < 0.001). Each of SI and elastic modulus were strongly negatively correlated to aortic strain (r = −0.89 and −0.73, respectively, P < 0.001 for both). None of the TDI-derived aortic velocities were correlated to any of the M-mode-derived indices. However, SAo and EAo velocities showed a significant moderate positive correlation (r = 0.57, P < 0.001).
Angiographic findings in patients with significant CAD (Group II)
To further explore the relation of aortic elasticity indices with severity of CAD, we studied those with significant CAD (Group II, n = 121 patients). Sixty patients had single-vessel disease, 29 patients had two-vessel disease and 32 patients had three-vessel disease. The mean SS was 21.47 ± 7.67 with 67 patients (55.4%) having low score (≤22), 41 patients (33.9%) having intermediate score (>22–≤32) and 13 patients (10.7%) having high score (>32). Aorto-ostial lesions were detected in 29 patients (24.0%). Patients having long lesions (≥20 mm) were 72 (59.5%) and those with multiple lesions (≥2 lesions) were 85 (70.2%).
Further analysis was done categorizing Group II patients into those with low SS (≤22) (67 patients) versus those with intermediate-high SS (>22) (54 patients). Significantly higher mean SI and elastic modulus as well as significantly lower mean AD, aortic strain, and EAo velocity were found among the intermediate-high SS category [Table 2].
Table 2.
Aortic elasticity indices in relation to syntax score
| Low score (≤22) (n=67) | Intermediate-high score (>22) (n=54) | P | |
|---|---|---|---|
| Aortic distensibility (cm2/dyn/103) | 4.30±1.04 | 3.76±1.06 | 0.01 |
| Stiffness index (log) | 5.17±1.30 | 5.90±1.64 | 0.007 |
| Stiffness index (non-log) | 17.49±3.69 | 19.66±4.45 | 0.004 |
| Elastic modulus (KPa) | 66.07±16.66 | 76.15±21.31 | 0.004 |
| Aortic strain (%) | 9.62±1.86 | 8.66±1.63 | 0.004 |
| SAo (cm/s) | 7.13±2.50 | 7.13±1.71 | 0.9 |
| EAo (cm/s) | 9.07±2.30 | 8.30±1.94 | 0.04 |
| AAo (cm/s) | 12.67±2.31 | 12.46±2.48 | 0.6 |
AAo=Aorta peak late diastolic velocity, EAo=Aorta peak early diastolic velocity, log=Logarithmic transformation, SAo=Aorta peak systolic velocity
Table 3 shows ROC analysis-derived cutoff points of aortic elasticity indices for the presence of significant CAD. Based on these cutoffs, significantly higher SS was found among those with low AD, strain, and EAo velocities as well as those with high SI and high elastic modulus [Table 4]. Proportion of aorto-ostial lesions was significantly higher among patients with low SAo velocity.
Table 3.
Receiver operator characteristic analysis of aortic elasticity indicies for presence of significant coronary artery disease and their derived cutoff points
| AUC | P | 95% CI | Sensitivity | Specificity | Cutoff point | |
|---|---|---|---|---|---|---|
| Aortic distensibility (cm2/dyn/103) | 0.66 | 0.006 | 0.55-0.77 | 83 | 45 | 4.96 |
| Stiffness index (logarithmic) | 0.67 | 0.003 | 0.57-0.78 | 65 | 63 | 4.73 |
| Stiffness index (non-logarithmic) | 0.68 | 0.002 | 0.56-0.79 | 67 | 66 | 16.3 |
| Elastic modulus (KPa) | 0.66 | 0.006 | 0.55-0.77 | 83 | 45 | 53.5 |
| Aortic strain (%) | 0.68 | 0.002 | 0.56-0.79 | 78 | 59 | 10.2 |
| SAo (cm/s) | 0.63 | 0.02 | 0.52-0.75 | 75 | 52 | 8.5 |
| EAo (cm/s) | 0.74 | 0.001 | 0.63-0.84 | 82 | 66 | 10.5 |
AUC=Area under the curve, CI=Confidence interval, EAo=Aorta peak early diastolic velocity, SAo=Aorta peak systolic velocity
Table 4.
Angiographic findings for patients with significant coronary artery disease (n=121) based on receiver operator characteristic-derived cutoff points of aortic elasticity indices
| Aortic distensibility (cm2/dyn/103)* | |||
|---|---|---|---|
|
| |||
| Low (≤4.9) (n=100), n (%) | High (>4.9) (n=21), n (%) | P | |
| Aorto-ostial lesion | 27 (27.0) | 2 (9.5) | 0.08 |
| Long lesions | 60 (60.0) | 12 (57.1) | 0.80 |
| Intermediate-high syntax | 48 (48.0) | 6 (28.6) | 0.10 |
| Syntax score | 22.14±7.87 | 18.28±5.82 | 0.03 |
|
| |||
| Aortic stiffness index (logarithmic)* | |||
|
| |||
| Low (≤4.7) (n=42), n (%) | High (>4.7) (n=79), n (%) | P | |
| Aorto-ostial lesion | 11 (26.2) | 18 (22.8) | 0.67 |
| Long lesions | 25 (59.5) | 47 (59.5) | 0.99 |
| Intermediate-high syntax | 15 (35.7) | 39 (49.4) | 0.15 |
| Syntax score | 19.46±7.64 | 22.54±7.52 | 0.03 |
|
| |||
| Aortic stiffness index (nonlogarithmic)* | |||
|
| |||
| Low (≤16.3) (n=40), n (%) | High (>16.3) (n=81), n (%) | P | |
| Aorto-ostial lesion | 9 (22.5) | 20 (24.7) | 0.79 |
| Long lesions | 21 (52.5) | 51 (63.0) | 0.27 |
| Intermediate-high syntax | 13 (32.5) | 41 (50.6) | 0.05 |
| Syntax score | 19.16±6.66 | 22.61±7.92 | 0.01 |
|
| |||
| Elastic modulus (KPa)* | |||
|
| |||
| Low (≤53.5) (n=20), n (%) | High (>53.5) (n=101), n (%) | P | |
| Aorto-ostial lesion | 2 (10.0) | 27 (26.7) | 0.10 |
| Long lesions | 12 (60.0) | 60 (59.4) | 0.96 |
| Intermediate-high syntax | 6 (30.0) | 48 (47.5) | 0.15 |
| Syntax score | 18.40±5.95 | 22.08±7.85 | 0.04 |
|
| |||
| Aortic strain (%)* | |||
|
| |||
| Low (≤10.2) (n=95), n (%) | High (>10.2) (n=26), n (%) | P | |
| Aorto-ostial lesion | 24 (25.3) | 5 (19.2) | 0.52 |
| Long lesions | 58 (61.1) | 14 (53.8) | 0.50 |
| Intermediate-high syntax | 49 (51.6) | 5 (19.2) | 0.003 |
| Syntax score | 22.58±7.83 | 17.42±5.47 | 0.002 |
|
| |||
| TDI aortic peak systolic velocity (cm/s)* | |||
|
| |||
| Low (≤8.5) (n=91), n (%) | High (>8.5) (n=30), n (%) | P | |
| Aorto-ostial lesion | 27 (29.7) | 2 (6.7) | 0.01 |
| Long lesions | 55 (60.4) | 17 (56.7) | 0.71 |
| Intermediate-high syntax | 43 (47.3) | 11 (36.7) | 0.31 |
| Syntax score | 22.10±7.55 | 19.56±7.83 | 0.11 |
|
| |||
| TDI aortic peak early diastolic velocity (cm/s)* | |||
|
| |||
| Low (≤10.5) (n=100), n (%) | High (>10.5) (n=21), n (%) | P | |
| Aorto-ostial lesion | 27 (27.0) | 2 (9.5) | 0.08 |
| Long lesions | 61 (61.0) | 11 (52.4) | 0.46 |
| Intermediate-high syntax | 49 (49.0) | 5 (23.8) | 0.03 |
| Syntax score | 22.81±7.19 | 15.09±6.75 | 0.0001 |
Variable are categorized into low and high based on the ROC-derived cutoff point of each. TDI=Tissue doppler imaging, ROC=Receiver operator characteristic
Predictors of significant coronary artery disease and its severity as assessed by syntax score
Testing for predictors of significant CAD, different potentially relevant clinical variables were included in a univariate logistic regression analysis in addition to different echocardiography-derived aortic elasticity indices. Each of AD, SI, elastic modulus, and aortic strain were independent predictors for the presence of significant CAD along with male gender, diabetes, increased BMI, and decreased EAo velocity [Table 5].
Table 5.
Logistic regression model for possible predictors of significant coronary artery disease
| Variables | Univariate analysis | Multivariate analysis | ||||
|---|---|---|---|---|---|---|
|
|
|
|||||
| OR | 95% CI | P | OR | 95% CI | P | |
| Age (years) | 1.05 | 1.01-1.10 | 0.01 | 1.03 | 0.97-1.09 | 0.26 |
| Gender (male) | 6.37 | 2.66-15.2 | 0.001 | 9.46 | 2.57-34.78 | 0.001 |
| Smoking | 2.62 | 1.04-6.59 | 0.04 | 1.40 | 0.36-5.38 | 0.67 |
| Diabetes mellitus | 3.49 | 1.25-9.78 | 0.02 | 4.64 | 1.17-18.46 | 0.02 |
| BMI (kg/m2) | 1.19 | 1.02-1.39 | 0.02 | 1.28 | 1.04-1.58 | 0.02 |
| Ao distensibility (cm2/dyn/103)* | 0.62 | 0.43-0.88 | 0.009 | 0.51 | 0.31-0.85 | 0.01 |
| Stiffness index (log)* | 1.64 | 1.14-2.37 | 0.008 | 1.83 | 1.15-2.91 | 0.01 |
| Stiffness index (non-log)* | 1.19 | 1.05-1.36 | 0.006 | 1.20 | 1.02-1.40 | 0.02 |
| Elastic modulus (KPa)* | 1.03 | 1.01-1.06 | 0.01 | 1.04 | 1.01-1.08 | 0.02 |
| Ao strain (%)* | 0.73 | 0.59-0.90 | 0.004 | 0.74 | 0.56-0.98 | 0.03 |
| SAo (cm/s) | 0.82 | 0.68-0.99 | 0.04 | 1.06 | 0.79-1.42 | 0.76 |
| EAo (cm/s) | 0.66 | 0.54-0.82 | 0.001 | 0.68 | 0.50-0.93 | 0.01 |
To avoid multicollinearity, these continuous variables were analyzed separately in multivariate regression analysis models adjusted for age, gender, smoking, diabetes, BMI, as well as aortic peak systolic and early diastolic velocities, with the highest odd`s ratio of the covariates being displayed. CI=Confidence interval, EAo=Aorta peak early diastolic velocity, log=Logarithmic transformation, OR=Odds ratio, SAo=Aorta peak systolic velocity, BMI=Body mass index
Furthermore, univariate and multivariate logistic regression analyses showed a significant high predictivity of each of; AD, SI, elastic modulus, aortic strain and EAo velocity for more severe and complex CAD (intermediate-high SS). In another model using ROC-derived cutoff points of elasticity indices, decreased aortic strain ≤10.2% was the only independent predictor of intermediate-high SS (odds ratio = 4.31, 95% confidence interval = 1.38–13.50, P = 0.01) [Table 6].
Table 6.
Logistic regression model for possible predictors of increased severity and complexity of coronary artery disease (intermediate-high syntax score)
| Variables | Univariate analysis | Multivariate analysis | ||||
|---|---|---|---|---|---|---|
|
|
|
|||||
| OR | 95% CI | P | OR | 95% CI | P | |
|
| ||||||
| Logistic regression model using Ao distensibility and stiffness indices as continous variables | ||||||
| Age (years) | 0.98 | 0.94-1.01 | 0.30 | - | - | - |
| Gender (male) | 1.52 | 0.58-3.94 | 0.39 | - | - | - |
| Smoking | 1.21 | 0.59-2.50 | 0.59 | - | - | - |
| Diabetes mellitus | 5.00 | 2.29-10.90 | 0.001 | 4.71 | 2.09-10.60 | 0.001 |
| BMI | 0.93 | 0.83-1.04 | 0.23 | - | - | - |
| Ao distensibility (cm2/dyn/103)* | 0.62 | 0.49-0.90 | 0.01 | 0.62 | 0.42-0.93 | 0.02 |
| Stiffness index (Log)* | 1.41 | 1.08-1.83 | 0.01 | 1.38 | 1.03-1.84 | 0.02 |
| Stiffness index (nonLog)* | 1.14 | 1.03-1.25 | 0.006 | 1.12 | 1.01-1.24 | 0.02 |
| Elastic modulus (KPa)* | 1.03 | 1.01-1.05 | 0.006 | 1.02 | 1.00-1.05 | 0.01 |
| Aortic strain (%)* | 0.72 | 0.58-0.91 | 0.005 | 0.76 | 0.60-0.96 | 0.02 |
| SAo (cm/s) | 1.00 | 0.84-1.18 | 0.97 | - | - | - |
| EAo (cm/s) | 0.83 | 0.70-0.99 | 0.04 | 0.86 | 0.71-1.04 | 0.12 |
|
| ||||||
| Logistic regression model using receiver operator characteristic-derived cutoff points of Ao distensibility and stiffness indices** | ||||||
|
| ||||||
| Diabetes mellitus | 5.00 | 2.29-10.90 | 0.001 | 4.97 | 2.18-11.30 | 0.001 |
| Distensibility↓↓ (≤4.9)* | 2.30 | 0.82-6.43 | 0.11 | - | - | - |
| Stiffness index↑↑ (Log>4.7)* | 1.75 | 0.81-3.79 | 0.15 | - | - | - |
| Stiffness index↑↑ (nonLog>16.3)* | 2.12 | 0.96-4.70 | 0.06 | - | - | - |
| Elastic modulus↑↑ (>53.5)* | 2.11 | 0.75-5.93 | 0.15 | - | - | - |
| Aortic strain↓↓ (≤10.2)* | 4.47 | 1.55-12.85 | 0.005 | 4.31 | 1.38-13.50 | 0.01 |
| SAo↓↓ (≤8.5) | 1.54 | 0.66-3.61 | 0.31 | - | - | - |
| EAo↓↓ (≤10.5) | 3.07 | 1.04-9.03 | 0.04 | 2.22 | 0.67-7.30 | 0.18 |
To avoid multicollinearity, these variables were analyzed separately in multivariate regression analysis models adjusted for diabetes, and aortic peak early diastolic velocity, with the highest odd’s ratio of diabetes and aortic peak early diastolic velocity being displayed,
Aortic distensibility and stiffness indicies were displayed as categorical variables based on the prespecified ROC-derived cutoff values. Ao=Aorta, CI=Confidence interval, EAo=Aorta peak early diastolic velocity, Log=Logarithmic transformation, OR=Odds ratio, ROC=Receiver operator characteristic, SAo=Aorta peak systolic velocity, BMI=Body mass index, ROC=Receiver operator characteristic, ↓↓ means decreased value of the parameter, ↑↑ means increased value of the parameter.
DISCUSSION
Results of our study showed that simple M-mode and TDI-derived parameters of aortic elasticity were associated with the presence of significant CAD. Among the different indices, decreased aortic strain (≤10.2%) was shown to be a significant independent predictor of higher SS.
Regarding traditional risk factors for CAD, age, male gender, smoking, presence of diabetes, and increased BMI were significantly higher in patients with significant CAD (Group II). Hypertensive patients were originally excluded from our study, as hypertension might be a direct confounding factor, representing either a cause or a sequel for increased AS and decreased AD. Previous studies showed that hypertension was strongly related to changes in AD and stiffness[15] and might influence their predicivity for significant CAD.[16] Furthermore, the use of medications that might alter disease progression was comparable among our study groups.
Significantly higher aortic systolic and diastolic diameters, however, with lower diameter difference were present among patients with significant CAD. This denotes a tendency toward larger aortic diameters with less diameter changes during the cardiac cycle which implicates the aortic strain, reflecting more AS and less distensibility among those with significant CAD.
Group II patients had significantly lower both AD and aortic strain. These finding were concordant with Sen et al., however, showing slightly lower mean values of distensibility and strain than ours, probably because they did not exclude hypertension, that might have influenced aortic parameters.[17] Our study showed that, SI as well as elastic modulus were significantly higher among Group II patients, which was in line with previous studies that assessed AS using the gold standard carotid-femoral pulsed wave velocity (PWV).[18]
Applying simple pulsed TDI techniques, our study showed significantly lower SAo and EAo velocities among Group II patients. Gungor et al. demonstrated that EAo velocity was significantly lower in the CAD group, with no difference in SAo and AAo velocities. Furthermore, they showed that EAo velocity was an independent predictor of premature CAD.[7]
In our study, we were particularly interested to explore the relation between different aortic elasticity indices and CAD severity as assessed by SS. We thought to use the SS I, which is a well-established and previously validated tool for CAD severity estimation and with important implications on morbidity and mortality.[11] Patients with intermediate-high SS showed significantly lower AD, strain, EAo velocity, and significantly higher SI and elastic modulus than those with low SS. These results were concordant with Karakurt et al.[10] Ghaderi et al., as well, showed that aortic strain and AD had significant inverse correlation with presence and severity of CAD assessed with SS.[19]
On the other hand, Chae et al. reported that brachial-ankle PWV, as a different modality of assessment of AS, was associated with the presence but not the extent of CAD.[20] These contradictory results to ours might be explained by the fact that brachial-ankle PWV is a reflection of regional arterial stiffness rather than central AS, which was assessed in our study, and which implicates the overall vascular changes that would directly influence CAD.
We thought that using ROC-derived cutoff points would yield more accurate and unbiased outputs. Median-derived cutoff points were previously utilized.[16] Based on our generated ROC-derived cutoff points, those with low distensibility, strain, and EAo velocity as well as those with high SI and elastic modulus had significantly higher SS denoting increased severity and complexity of the disease. Interestingly, those with low SAo velocity had significantly higher incidence of aorto-ostial lesions, yet without significant difference in the overall SS. This would raise the assumption that, regardless of CAD severity, anatomical proximity of coronary lesions to the aorta was associated with impaired elasticity.
On multivariate analysis, adjusted to other covariates, decreased aortic strain ≤10.2% was the only significant independent predictor of CAD severity along with diabetes. Superiority of aortic strain over other M-mode-derived indices might be due to the fact that aortic strain is a direct measure of aortic elastic properties, whereas AD, SI, and elastic modulus entail hemodynamic blood pressure measurements which might have influenced the results despite excluding hypertensive patients. Similarly, M-mode aortic strain showed better predictivity for CAD severity compared to TDI-derived aortic velocities which is influenced by the insonnation angle. Vitarelli et al. showed that even TDI-derived aortic strain was superior to TDI-derived velocities in reflecting aortic compliance, possibly due to better reflection of aortic deformation throughout the cardiac cycle.[15]
Our study highlights the value of both M-mode and TDI-derived aortic elasticity indices to predict the presence of significant CAD, and the extended value of M-mode-derived indices to predict increased severity and complexity of CAD. To our knowledge, this was the first study to assess the feasibility of using ROC curves-derived cutoff points of aortic elasticity indices for predicting severity and complexity of CAD.
Limitations
The cross-sectional design and the relatively small sample size were limitations of our study. Since diabetes might influence aortic elasticity, it should have been excluded from our study. Further studies that exclude diabetic as well as hypertensive patients are warranted to avoid any possible confounding effect on aortic elasticity.
CONCLUSION
Simple M-mode and TDI echo-derived parameters of AS and distensibility were related and possibly predictive of the presence of significant CAD. Among the different indices, decreased aortic strain (≤10.2%) was shown to be the only independent predictor of more complex CAD.
Recommendations
Simple M-mode echo-derived aortic strain might represent a potential screening tool for detecting patients with more severe and complex CAD, which might have therapeutic and prognostic implications. Further validation and evaluation of AD and stiffness cutoff points would be recommended in future larger-scale studies, to be potentially added to risk scores evaluating the severity of CAD.
Ethical approval and consent to participate
The study was approved by Assiut University Faculty of Medicine ethical committee (reference number is not available). Enrolled patients provided written consent to participate in the study.
Financial support and sponsorship
Nil.
Conflicts of interest
There are no conflicts of interest.
REFERENCES
- 1.Yildiz A, Gur M, Yilmaz R, Demirbag R. The association of elasticity indexes of ascending aorta and the presence and the severity of coronary artery disease. Coron Artery Dis. 2008;19:311–7. doi: 10.1097/MCA.0b013e3283004290. [DOI] [PubMed] [Google Scholar]
- 2.Laurent S, Boutouyrie P, Asmar R, Gautier I, Laloux B, Guize L, et al. Aortic stiffness is an independent predictor of all-cause and cardiovascular mortality in hypertensive patients. Hypertension. 2001;37:1236–41. doi: 10.1161/01.hyp.37.5.1236. [DOI] [PubMed] [Google Scholar]
- 3.Stefanadis C, Dernellis J, Tsiamis E, Stratos C, Diamantopoulos L, Michaelides A, et al. Aortic stiffness as a risk factor for recurrent acute coronary events in patients with ischaemic heart disease. Eur Heart J. 2000;21:390–6. doi: 10.1053/euhj.1999.1756. [DOI] [PubMed] [Google Scholar]
- 4.Kilic H, Yelgec S, Salih O, Akdemir R, Karakurt O, Cagirci G, et al. An invasive but simple and accurate method for ascending aorta-femoral artery pulse wave velocity measurement. Blood Press. 2013;22:45–50. doi: 10.3109/08037051.2012.694255. [DOI] [PubMed] [Google Scholar]
- 5.Pereira T, Correia C, Cardoso J. Novel methods for pulse wave velocity measurement. J Med Biol Eng. 2015;35:555–65. doi: 10.1007/s40846-015-0086-8. [DOI] [PMC free article] [PubMed] [Google Scholar]
- 6.Cho JY, Kim KH. Evaluation of arterial stiffness by echocardiography: Methodological aspects. Chonnam Med J. 2016;52:101–6. doi: 10.4068/cmj.2016.52.2.101. [DOI] [PMC free article] [PubMed] [Google Scholar]
- 7.Gungor B, Yilmaz H, Ekmekci A, Ozcan KS, Tijani M, Osmonov D, et al. Aortic stiffness is increased in patients with premature coronary artery disease: a tissue Doppler imaging study. J Cardiol. 2014 Mar;63(3):223–9. doi: 10.1016/j.jjcc.2013.08.008. [DOI] [PubMed] [Google Scholar]
- 8.Styczynski G, Rdzanek A, Pietrasik A, Kochman J, Huczek Z, Sobieraj P, et al. Echocardiographic assessment of aortic pulse-wave velocity: Validation against invasive pressure measurements. J Am Soc Echocardiogr. 2016;29:1109–16. doi: 10.1016/j.echo.2016.07.013. [DOI] [PubMed] [Google Scholar]
- 9.Bu Z, Ma J, Fan Y, Qiao Z, Kang Y, Zheng Y, et al. Ascending aortic strain analysis using 2-dimensional speckle tracking echocardiography improves the diagnostics for coronary artery stenosis in patients with suspected stable angina pectoris. J Am Heart Assoc. 2018;7:e008802. doi: 10.1161/JAHA.118.008802. [DOI] [PMC free article] [PubMed] [Google Scholar]
- 10.Karakurt A, Yildiz C, Yildiz A, Basbug HS. Assessment of relation between aortic elastic properties and the complexity of coronary artery disease. Acta Cardiol. 2016;71:267–73. doi: 10.2143/AC.71.3.3152086. [DOI] [PubMed] [Google Scholar]
- 11.Sianos G, Morel MA, Kappetein AP, Morice MC, Colombo A, Dawkins K, et al. The SYNTAX Score: An angiographic tool grading the complexity of coronary artery disease. EuroIntervention. 2005;1:219–27. [PubMed] [Google Scholar]
- 12.Dernellis J, Panaretou M. Aortic stiffness is an independent predictor of progression to hypertension in nonhypertensive subjects. Hypertension. 2005;45:426–31. doi: 10.1161/01.HYP.0000157818.58878.93. [DOI] [PubMed] [Google Scholar]
- 13.Nemes A, Geleijnse ML, Forster T, Soliman OI, Ten Cate FJ, Csanady M. Echocardiographic evaluation and clinical implications of aortic stiffness and coronary flow reserve and their relation. Clin Cardiol. 2008;31:304–9. doi: 10.1002/clc.20252. [DOI] [PMC free article] [PubMed] [Google Scholar]
- 14.Stefanadis C, Stratos C, Boudoulas H, Kourouklis C, Toutouzas P. Distensibility of the ascending aorta: Comparison of invasive and non-invasive techniques in healthy men and in men with coronary artery disease. Eur Heart J. 1990;11:990–6. doi: 10.1093/oxfordjournals.eurheartj.a059639. [DOI] [PubMed] [Google Scholar]
- 15.Vitarelli A, Giordano M, Germano G, Pergolini M, Cicconetti P, Tomei F, et al. Assessment of ascending aorta wall stiffness in hypertensive patients by tissue Doppler imaging and strain Doppler echocardiography. Heart. 2010;96:1469–74. doi: 10.1136/hrt.2010.198358. [DOI] [PubMed] [Google Scholar]
- 16.Elbasan Z, Sahin DY, Gur M, Gozubuyuk G, Akilli RE, Koyunsever NY, et al. Aortic distensibility and extent and complexity of coronary artery disease in patients with stable hypertensive and nonhypertensive coronary artery disease. Med Princ Pract. 2013;22:260–4. doi: 10.1159/000345842. [DOI] [PMC free article] [PubMed] [Google Scholar]
- 17.Sen T, Tufekcioglu O, Ozdemir M, Tuncez A, Uygur B, Golbasi Z, et al. New echocardiographic parameter of aortic stiffness and atherosclerosis in patients with coronary artery disease: Aortic propagation velocity. J Cardiol. 2013;62:236–40. doi: 10.1016/j.jjcc.2013.04.006. [DOI] [PubMed] [Google Scholar]
- 18.Ikonomidis I, Makavos G, Lekakis J. Arterial stiffness and coronary artery disease. Curr Opin Cardiol. 2015;30:422–31. doi: 10.1097/HCO.0000000000000179. [DOI] [PubMed] [Google Scholar]
- 19.Ghaderi F, Samim H, Keihanian F, Danesh Sani SA. The predictive role of aortic propagation velocity for coronary artery disease. BMC Cardiovasc Disord. 2018;18:121. doi: 10.1186/s12872-018-0854-9. [DOI] [PMC free article] [PubMed] [Google Scholar]
- 20.Chae MJ, Jung IH, Jang DH, Lee SY, Hyun JY, Jung JH, et al. The brachial ankle pulse wave velocity is associated with the presence of significant coronary artery disease but not the extent. Korean Circ J. 2013;43:239–45. doi: 10.4070/kcj.2013.43.4.239. [DOI] [PMC free article] [PubMed] [Google Scholar]