

Abstract
Studies in healthy children have demonstrated racial-ethnic differences in bone markers and bone outcomes including fractures. At present, limited studies have evaluated the impact of race and ethnicity on bone markers and fractures within the pediatric chronic kidney disease population. In a cohort study of 762 children between the ages of 1.5 years and 18 years, with CKD stages 1–4 from the CKD in children (CKiD) cohort, the relationship between racial-ethnic group and bone markers (parathyroid hormone [PTH], 25-hydroxyvitamin D [25-OHD], 1,25-dihydroxyvitamin D [1,25(OH)2D] and c-terminal fibroblast growth factor [FGF23]) was determined using linear mixed models. Additionally, logistic regression was used to evaluate racial-ethnic differences in prevalent fracture upon study entry. African American race was associated with 23% (confidence interval [CI] 2.5% to 47.7%, p=0.03) higher PTH levels, 33.1% (CI: −39.7% to −25.7%, p<0.0001) lower 25-OHD levels, and no difference in c-terminal FGF23 or 1,25(OH)2D levels when compared to Caucasians. Hispanic ethnicity was associated with 15.9% (CI: −28.3% to −1.5%, p=0.03) lower c-terminal FGF23 levels and 13.8% (CI: −22.2% to −4.5%, p=0.005) lower 25-OHD levels when compared to Caucasians. African-American and Hispanic children had a 74% (odds ratio [OR]: 0.26, CI: 0.14, 0.49, p=0.001) and 66% (OR: 0.34, CI: 0.17, 0.65, P<0.0001) lower odds of any fracture than Caucasian children at study entry, respectively. Race and ethnicity are associated with differences in bone markers and despite lower 25-OHD levels, both African American and Hispanic children with CKD reported a lower prevalent fracture history than Caucasian children. The current findings in the CKD population are similar to racial-ethnic differences described in healthy children. Additional studies are needed to better understand how these differences might impact the management of pediatric CKD-MBD.
Keywords: Fracture Risk Assessment, Parathyroid-related disorders, PTH/Vit D/FGF23
INTRODUCTION
Chronic Kidney Disease-Mineral Bone Disorder (CKD-MBD) impacts the quality of life, morbidity and mortality of pediatric patients. Despite our current therapies, 30% of pediatric patients with CKD will have manifestations of their bone disease as adults with up to 18% experiencing debilitating bone disease.(1) Although major strides have been made in our understanding of the pathophysiology of CKD-MBD, advances in treatment have been limited. At present, CKD-MBD treatment relies heavily upon the use of active Vitamin D sterols to achieve target parathyroid hormone (PTH) levels. Although the range of acceptable PTH levels has been broadened in recent guidelines to account for the wide variation in PTH resistance, individualizing therapy to avoid over-and under-treatment remains necessary.(2) Supporting a need for individualization of therapy are known differences by race and ethnicity in bone structure, fracture risk and mineral markers. For instance, studies within populations of healthy children have described greater bone mineral density in African American children, likely due to a significantly greater accrual of bone mass in the pubertal period as compared to Caucasian children.(3,4) This greater bone mineral accrual contributes to stronger bone in African-American children despite paradoxically lower Vitamin D levels and higher PTH levels.(5) Furthermore, healthy Caucasian children demonstrate a 2-fold higher risk of developing a fracture when compared to minority children suggesting that differences in bone accrual by racial group contribute to differential outcomes in fracture.(6) Studies of these racial differences in pediatric CKD-MBD are limited, but a few studies have begun to reveal the presence of racial-ethnic differences. A study by Kumar et al. confirmed the higher risk of Vitamin D deficiency amongst African-American children with CKD, and we have previously demonstrated higher PTH levels in African American children and young adults on dialysis when compared to Caucasian children.(7,8) A study of risk factors for fracture in a pediatric CKD population by Denburg et al. did not find that race was an independent predictor of incident fracture within the pediatric CKD population.(9) In contrast, adult studies have repeatedly demonstrated a significantly lower risk of fracture in African American CKD and dialysis patients when compared to Caucasian patients.(10,11) At present, there is a lack of studies in pediatric CKD that have assessed the impact of race and ethnicity on bone markers and fracture risk, examining self-reported race as an independent predictor. Additionally, there is a lack of knowledge about the role of Hispanic ethnicity on bone markers and fracture risk. Thus, our objective was to determine the association of race and Hispanic ethnicity with bone mineral markers and prevalent fracture in a pediatric CKD cohort.
METHODS
Patient Population:
We evaluated 762 participants from the Chronic Kidney Disease in Children (CKiD) study enrolled between 2005 and 2017. CKiD is a National Institute of Health (NIH)-funded, observational study of racially and ethnically diverse children enrolled between the ages of 6 months to 16 years with an estimated glomerular filtration rate (eGFR) between 30 and 90 ml/min/1.73m2 as determined by the Schwartz formula.(12). Children were enrolled across 57 centers within the United States and 2 centers within Canada and followed annually until initiation of renal replacement therapy. We included patients who were self-reported or reported by their parents to be Non-Hispanic African American (Black), Non-Hispanic Caucasian (White) and Hispanic. We excluded participants with missing race (301 person-visits from 203 participants), non Black, White or Hispanic race (209 person-visits from 68 participants), and missing outcome data at follow-up visits (76 person-visits from 68 participants).
Study Variables
The primary exposure of interest was self-reported racial and ethnic group. We categorized the etiology of CKD into glomerular and non-glomerular causes, the latter including hereditary, cystic and genitourinary causes. Markers of bone metabolism were measured at the study entry visit, at the three-year study visit and at the five- and/or seven-year study visit. Participants were asked at the baseline visit whether they had experienced a previous fracture and were also asked about incident fracture between study visits. Given that an analysis of incident fracture has previously been performed, prevalent fracture at study entry was the primary focus of this study.(9)
Statistical Analysis
Baseline characteristics were reported as medians and interquartile ranges, and differences in baseline characteristics and laboratory values between racial-ethnic groups were compared using the Kruskal-Wallis test. Categorical variables were reported as frequencies and percentages and compared across racial-ethic groups using chi-square analysis. For all analyses, a p value of less than 0.05 denoted significance.
Linear mixed effects models were used to determine the association between racial-ethnic group and repeated measures of PTH, c-terminal fibroblast growth factor 23 (FGF23), 25-hydroxyvitamin D (25-OHD) and 1,25-dihydroxyvitamin D (1,25(OH)2D) throughout the course of follow-up. These outcomes were log10-transformed in order to achieve a symmetric distribution; regression coefficients for these models are reported as the percent difference from the reference group of Caucasian patients according to the following formula: [(10B)-1] × 100. Each outcome was sequentially adjusted with Model 1 comprised of race-ethnicity and CKD stage and Model 2 additionally adjusted for age, gender, CKD duration and CKD etiology. Model 3 was additionally adjusted for repeated measures of age-standardized phosphate z score, albumin-corrected calcium, urine protein: creatinine ratio, 25-OHD, 1,25(OH)2D, nutritional Vitamin D use, and active Vitamin D sterol use, as appropriate. An additional Model 4 was created for PTH and consisted of sequential adjustment for repeated measures of 25-OHD levels to isolate the impact of this variable. Covariates were assessed for collinearity using Spearman correlation and two variables-1,25(OH)2D and 25-OHD- were significantly correlated (r=0.27, p<0.0001) with each other. Because of this, 25-OHD was used in the PTH model given that it was significantly correlated with the PTH (r=−0.13, p<0.0001), whereas 1,25(OH)2D was used in the c-terminal FGF23 model given its correlation with c-terminal FGF23 (r=−0.25, p<0.0001).
Logistic Regression was used to determine how race and ethnic group associated with the risk of prevalent fracture at study entry. We first performed bivariate modeling between bone fracture and exposure variables associated with fracture risk based on prior literature (Supplemental Table 1).(9) Fracture models were created using covariates with a p value of less than 0.1 in bivariate analysis and covariates deemed to be important based on prior literature. Model 1 was adjusted for age and gender, given they are well-described determinants of fracture risk, and the covariate of interest, race-ethnicity. Model 2 was additionally adjusted for CKD diagnosis, stage, and duration as well as Tanner staging. Model 3 was further adjusted for baseline calcium, phosphate z score, 25-OHD, age-and-gender standardized height z score, active Vitamin D use and intact PTH. Given high participant loss in the final model owing to missing data, multiple imputation using the multivariate normal distribution was used to impute values for albumin-corrected calcium, intact PTH, 25-OHD and height z score. The degree of missing data varied for each variable with only 27.4%, 20.9%, 3.4%, and 25.2% of participants having complete data (values at every study visit) for albumin-corrected calcium, intact PTH, 25-OHD and height z-score, respectively. At least two measurements of albumin-corrected calcium, intact PTH, 25-OHD and height z score were available for 82.9%, 77.6%, 50.8% and 82.4%, respectively. Thirty imputed datasets were created, and this was based upon the highest fraction of missing information (FMI) for each non-auxiliary variable. The fully adjusted multiply imputed model is presented as Model 4. In a sensitivity analysis, we enhanced the consistency of our findings with a more parsimonious fully-adjusted model which was created using only covariates with a p value <0.1 in bivariate analysis. To assess the consistency of our findings, we used Poisson Regression to determine whether there was a relationship between race, ethnicity and incident fracture. Given the decrease in the number of outcomes associated with this analysis, this model was adjusted only for baseline measures of covariates with a p value <0.1 in bivariate analysis as above. All statistical analyses were conducted using SAS Studio (SAS Institute, Cary, NC, USA).
RESULTS
Baseline Patient Characteristics
Characteristics of the cohort at the baseline study visit are displayed in Table 1. Of the 762 subjects, 171 (22.4%) identified as African American, 470 (61.7%) as Caucasian and 121 (15.9%) as Hispanic. At the baseline visit, the median (IQR) age of the cohort was 11.6 (8.2, 15.1) years, and there was no difference in age between racial-ethnic groups. The majority of study participants were male (61.6%), and CKD stage 3 was the most prevalent CKD stage (57.2%). 70.2% of the cohort had non-glomerular causes as the etiology of their CKD. Median (IQR) CKD duration for the entire cohort was 8.5 (4, 12.7) years. African American children had the highest estimated GFR, highest frequency of glomerular diseases, and shortest CKD duration. More than a quarter (28.6%) of the cohort reported taking active Vitamin D supplementation at the baseline visit, and Hispanic subjects demonstrated the highest frequency of active Vitamin D sterol use. Only 11.3% of the entire cohort reported receiving nutritional Vitamin D supplementation at the baseline visit.
Table 1:
Baseline Characteristics
| Variable | African-American | Caucasian | Hispanic | p* |
|---|---|---|---|---|
| N | 171 | 470 | 121 | |
| Age, yrs median (IQR) | 12.5 (8.7, 15.4) | 11.5 (8.2, 14.9) | 11.5 (7, 15.1) | 0.5 |
| Gender, n (%) | 0.09 | |||
| Male | 114 (66.7) | 291 (61.9) | 64 (52.9) | |
| Female | 57 (33.3) | 179 (38.1) | 57 (47.1) | |
| CKD stage, n (%) | 0.001 | |||
| 1 | 12 (7) | 22 (4.7) | 1 (0.8) | |
| 2 | 65 (38) | 122 (26) | 30 (24.8) | |
| 3 | 75 (43.9) | 272 (57.9) | 71 (58.7) | |
| 4 | 6 (3.5) | 42 (8.9) | 13 (10.7) | |
| Missing | 13 (7.6) | 12 (2.6) | 6 (5) | |
| eGFR, ml/min/1.73m2 median (IQR) | 58.9 (47.6, 73.6) | 51.4 (38.2, 64.9) | 47.8 (35.7, 60.6) | <0.0001 |
| Diagnosis | <0.0001 | |||
| Glomerular | 74 (43.3) | 113 (24) | 40 (33.1) | |
| Non-glomerular | 97 (56.7) | 357 (76) | 81 (66.9) | |
| CKD duration, yrs, median (IQR) | 6.1 (2.7, 11.2) | 9 (4.7, 13.4) | 7.5 (4, 11.3) | 0.001 |
| Active Vitamin D, n (%) | 0.01 | |||
| No | 124 (72.5) | 336 (71.5) | 70 (57.9) | |
| Yes | 39 (22.8) | 126 (26.8) | 47 (38.8) | |
| Missing | 8 (4.7) | 8 (1.7) | 4 (3.3) | |
| Nutritional Vitamin D, n (%) | 0.6 | |||
| No | 148 (86.5) | 406 (86.4) | 104 (86) | |
| Yes | 15 (8.8) | 56 (11.9) | 13 (10.7) | |
| Missing | 8 (4.7) | 8 (1.7) | 4 (3.3) | |
| Tanner, n (%) | 0.05 | |||
| 1 | 78 (45.6) | 260 (55.3) | 60 (49.6) | |
| 2 | 11 (6.4) | 43 (9.1) | 10 (8.3) | |
| 3 | 15 (8.8) | 39 (8.3) | 9 (7.4) | |
| 4 | 28 (16.4) | 65 (13.8) | 21 (17.4) | |
| 5 | 27 (15.8) | 33 (7) | 15 (12.4) | |
| Missing | 12 (7) | 30 (6.4) | 6 (5) | |
| Total Calcium Intake, mg/day | 1040.9 (735.1, 1708.7) | 1100.3 (774.3, 1579.5) | 1060.7 (721.7, 1718.7) |
1 |
| Total Phosphate Intake, mg/day | 1323.8 (948.5, 2030.7) |
1308.5 (960.5, 1768.9) |
1282.1 (955.6, 2181.2) | 0.6 |
| Bone Fracture, n (%) | 0.0001 | |||
| Yes | 18 (10.5) | 110 (23.4) | 14 (11.6) | |
| No | 145 (84.8) | 348 (74) | 103 (85.1) | |
| Missing | 8 (4.7) | 12 (2.6) | 4 (3.3) |
IQR=Interquartile Range, CKD=chronic kidney disease, eGFR=estimated glomerular filtration rate, Active Vitamin D=1,25-dihydroxyvitamin D, Nutritional Vitamin D=25-dihydroxyvitamin D
N missing: Total Calcium Intake (111), Total Phosphate Intake (111), eGFR (35), CKD duration (9)
Kruskal-Wallis p value across all racial-ethnic groups.
Baseline Laboratory Values
Calcium levels differed between racial ethnic groups with Caucasian participants having the lowest albumin-corrected calcium values (Table 2). There was no significant difference in phosphate, phosphate z score, c-terminal FGF23 or intact PTH between groups at the baseline visit. Serum 25-OHD was lowest amongst African American and Hispanic participants, whereas 1,25(OH)2D did not differ significantly between groups. The urine protein to creatinine ratio was highest in Hispanic participants and lowest in Caucasian participants.
Table 2:
Comparison of baseline biochemical markers across racial-ethnic group.
| Total | African American | Caucasian | Hispanic | p* |
|---|---|---|---|---|
| Calcium, albumin corrected, (mg/dL), median (IQR) | 9.4 (9.1, 9.7) | 9.2 (9, 9.5) | 9.3 (9, 9.5) | 0.002 |
| Phosphate (mg/dL), median (IQR) | 4.4 (3.9, 5) | 4.4 (4, 4.9) | 4.5 (4, 4.9) | 0.9 |
| Phosphate z score, median (IQR) | 0.2 (−0.7, 1.4) | 0.03 (−0.9, 1) | 0.1 (−0.7, 1.1) | 0.2 |
| iPTH (pg/ml), median (IQR) | 50.2 (28.7, 74) | 44.9 (28, 73.8) | 47.5 (30, 69.1) | 0.6 |
| 25-OHD (ng/mL), median (IQR) | 20.2 (12.8, 27.6) | 31 (24, 38) | 25.2 (18.2, 33.3) | <0.0001 |
| 1,25(OH)2D (pg/mL), median (IQR) | 31.6 (23.2, 42.8) | 33.6 (25.9, 40.3) | 31.7 (26.1, 43.3) | 0.8 |
| Protein/Creatinine, urine, median (IQR) | 0.4 (0.1, 1.2) | 0.3 (0.1, 0.8) | 0.5 (0.2, 1.1) | 0.004 |
| C-terminal FGF23, median (IQR) | 109.1 (75.4,165) | 114.8 (78.9, 171.6) | 101.9 (73.1, 175.7) | 0.6 |
iPTH=intact parathyroid hormone, 25-OHD=25-hydroxyvitamin D, 1,25(OH)2D=1,25-dihydroxyvitamin D, FGF23=c-terminal fibroblast growth factor
N missing: 1,25(OH)2D (180), 25-OHD (178), iPTH (145), Calcium, albumin corrected (7), Phosphate (z score) (16), Protein/Creatinine, urine (30)
Kruskal-Wallis p value across all racial-ethnic groups.
Race, ethnicity and mineral markers
In fully adjusted linear mixed models of repeated measures of mineral markers, African American race was associated with 23% higher PTH levels, 33.1% lower 25-OHD levels, and no difference in c-terminal FGF23 or 1,25(OH)2D levels when compared to Caucasians (Table 3). When the PTH model was additionally adjusted for repeated measures of 25-OHD levels, there was no longer a significant difference in PTH levels in African Americans as compared to Caucasians (Table 3). In the fully adjusted models, Hispanic ethnicity was associated with 15.9% lower c-terminal FGF23 levels and 13.8% lower 25-OHD levels when compared to Caucasians. There was no significant difference in 1,25(OH)2D levels. Upon sequential adjustment for 25-OHD, Hispanic subjects demonstrated 22.1% lower PTH levels.
Table 3:
Linear Mixed Models of mineral metabolism markers by racial-ethnic group*
| (ref=Caucasian) | African American Estimate | Hispanic Estimate |
|---|---|---|
| Linear Mixed Model iPTH | ||
| Unadjusted Model 1 (n=751) |
+ 26% (+6.3% to +50%) p=0.01 |
−11.1% (−25% to +5.3%) p=0.2 |
| Case-mix adjusted Model 2 (n=742) |
+24.5% (+4.4% to +48%) p=0.01 |
−11.1% (−25.3% to +5.7%) p=0.2 |
| Fully adjusted Model 3 (n=735) |
+23% (+2.5% to 47.7%) p=0.03 |
−14.3% (−28.1% to +2.1%) p=0.1 |
| Sequentially adjusted for 25-OHD Model 4 (n=619) |
+5.4% (−15.9% to +32%) p=0.6 |
−22.1% (−37% to −3.6%) p=0.02 |
| Linear Mixed Model c-terminal FGF23 | ||
| Unadjusted Model 1 (n=751) |
+9.7% (−5.2% to 26.9%) p=0.2 |
−14.2% (−25.7% to −0.9%) p=0.04 |
| Case-mix adjusted Model 2 (n=742) |
+2.8% (−11.3% to +29.1%) p=0.7 |
−17% (−28.1% to −4.1%) p=0.01 |
| Fully adjusted Model 3 (n=619) |
−4.9% (−19.2% to +12%) p=0.5 |
−15.9% (−28.3% to −1.5%) p=0.03 |
| Linear Mixed Model 25-hydroxyvitamin D | ||
| Unadjusted Model 1 (n=751) |
−39.6% (−45.9% to −32.7%) p<0.0001 |
−16.7% (−25.4% to −6.9%) p=0.001 |
| Case-mix adjusted Model 2 (n=742) |
−34.5% (−41% to −27.2%) p<0.0001 |
−15.3% (−23.8% to −5.9%) p=0.002 |
| Fully adjusted Model 3 (n=723) |
−33.1% (−39.7% to −25.7%) p<0.0001 |
−13.8% (−22.2% to −4.5%) p=0.005 |
| Linear Mixed Model 1,25-dihydroxyvitamin D | ||
| Unadjusted Model 1 (n=751) |
−8.9% (−17.1% to +0.2%) p=0.05 |
+1.4% (−7.9% to +11.6%) p=0.8 |
| Case-mix adjusted Model 2 (n=742) |
−4.3% (−12.9% to +5.1%) p=0.4 |
+2.3% (−7% to +12.4%) p=0.6 |
| Fully adjusted Model 3 (n=723) |
−6.7% (−15.4% to +3.1%) p=0.2 |
+1.3% (−8.1% to 11.7%) p=0.8 |
All Models:
Model 1: race-ethnicity, ckd stage, race*ckd stage
Model 2: + age, gender, ckd duration, diagnosis (glomerular vs. non-glomerular)
PTH Model:
Model 3: + phosphate z-score, calcium, active Vitamin D
Model 4: + phosphate z-score, calcium, active Vitamin D, 25-OHD
C-terminal FGF23 model:
Model 3: + phosphate z-score, calcium, 1,25(OH)2D, active Vitamin D
25-hydroxyvitamin D:
Model 3: + phosphate z-score, calcium, urine protein:creatinine, nutritional vitamin D use
1,25-dihydroxyvitamin D:
Model 3: + phosphate z-score, calcium, urine protein:creatinine, active Vitamin D use
All models adjusted for repeated biochemical measures across the duration of follow-up.
iPTH=intact parathyroid hormone, 25-OHD=25-hydroxyvitamin D, 1,25(OH)2D=1,25-dihydroxyvitamin D, FGF23=c-terminal fibroblast growth factor, CKD=Chronic Kidney Disease
Race, ethnicity and fracture at study entry
At the baseline visit, 142 subjects (19.2%) in the cohort reported ever having experienced a fracture prior to cohort entry. A higher frequency of Caucasian children reported experiencing a fracture (24%) than both African American (11%) and Hispanic children (12%). In the fully adjusted and multiply imputed logistic regression, African-American and Hispanic race and ethnicity were associated with 74% and 66% lower odds of prevalent fracture when compared to Caucasian subjects (Table 4 and Figure 1). A fully-adjusted model using only covariates with p<0.1 in bivariate analysis (Supplemental Table) similarly demonstrated a 75% (p<0.0001) lower fracture risk in African Americans and a 66% (p=0.001) lower fracture risk in Hispanics when compared to Caucasians. In an analysis of incident fracture, 51 participants reported one or two incident fractures amongst 543 participants with available data on incident fracture. There were 55 total incident fractures over a median (IQR) follow up time of 3.6 (1.5, 5.4) years. Of these, 8 incident fractures occurred in 8 African-American participants, 37 incident fractures in 34 Caucasian participants and 10 incident fractures in 9 Hispanic participants. In Poisson regression analysis adjusted for race, age, diagnosis, CKD duration and baseline phosphate, calcium, tanner stage and height, African-American race and Hispanic ethnicity were not significantly associated with incident fracture (Incident Rate Ratio [IRR] 0.7 {0.3, 1.6}, p=0.4 and IRR 0.8 {0.3, 2}, p=0.7, respectively).
Table 4:
Odds of prevalent fracture upon entry to the study*
| (ref=Caucasian) | African American Odds Ratio (Confidence Interval) | Hispanic Odds Ratio (Confidence Interval) |
|---|---|---|
| Logistic Regression of Fracture | ||
| Unadjusted Model 1 (n=738) |
0.34 (0.2, 0.6) 9=0.0001 |
0.4 (0.22, 0.75) p=0.004 |
| Case-mix adjusted Model 2 (n=692) | 0.26 (0.14, 0.47) p<0.0001 |
0.34 (0.18, 0.67) p=0.002 |
| Fully adjusted Model 3 (n=404) |
0.18 (0.07, 0.48) p=0.001 |
0.55 (0.23, 1.31) p=0.2 |
| Fully adjusted, multiple imputation (n=715) | 0.26 (0.14, 0.5) p<0.0001 |
0.34 (0.18, 0.66) p=0.001 |
Model 1: race-ethnicity, gender, age
Model 2: ckd stage, diagnosis (glomerular vs. non-glomerular), ckd duration, Tanner
Model 3: calcium, phosphate-z score, 25-OHD, Height z score, Active Vitamin D use, iPTH
All models adjusted for covariates obtained at the baseline study visit.
Figure 1:
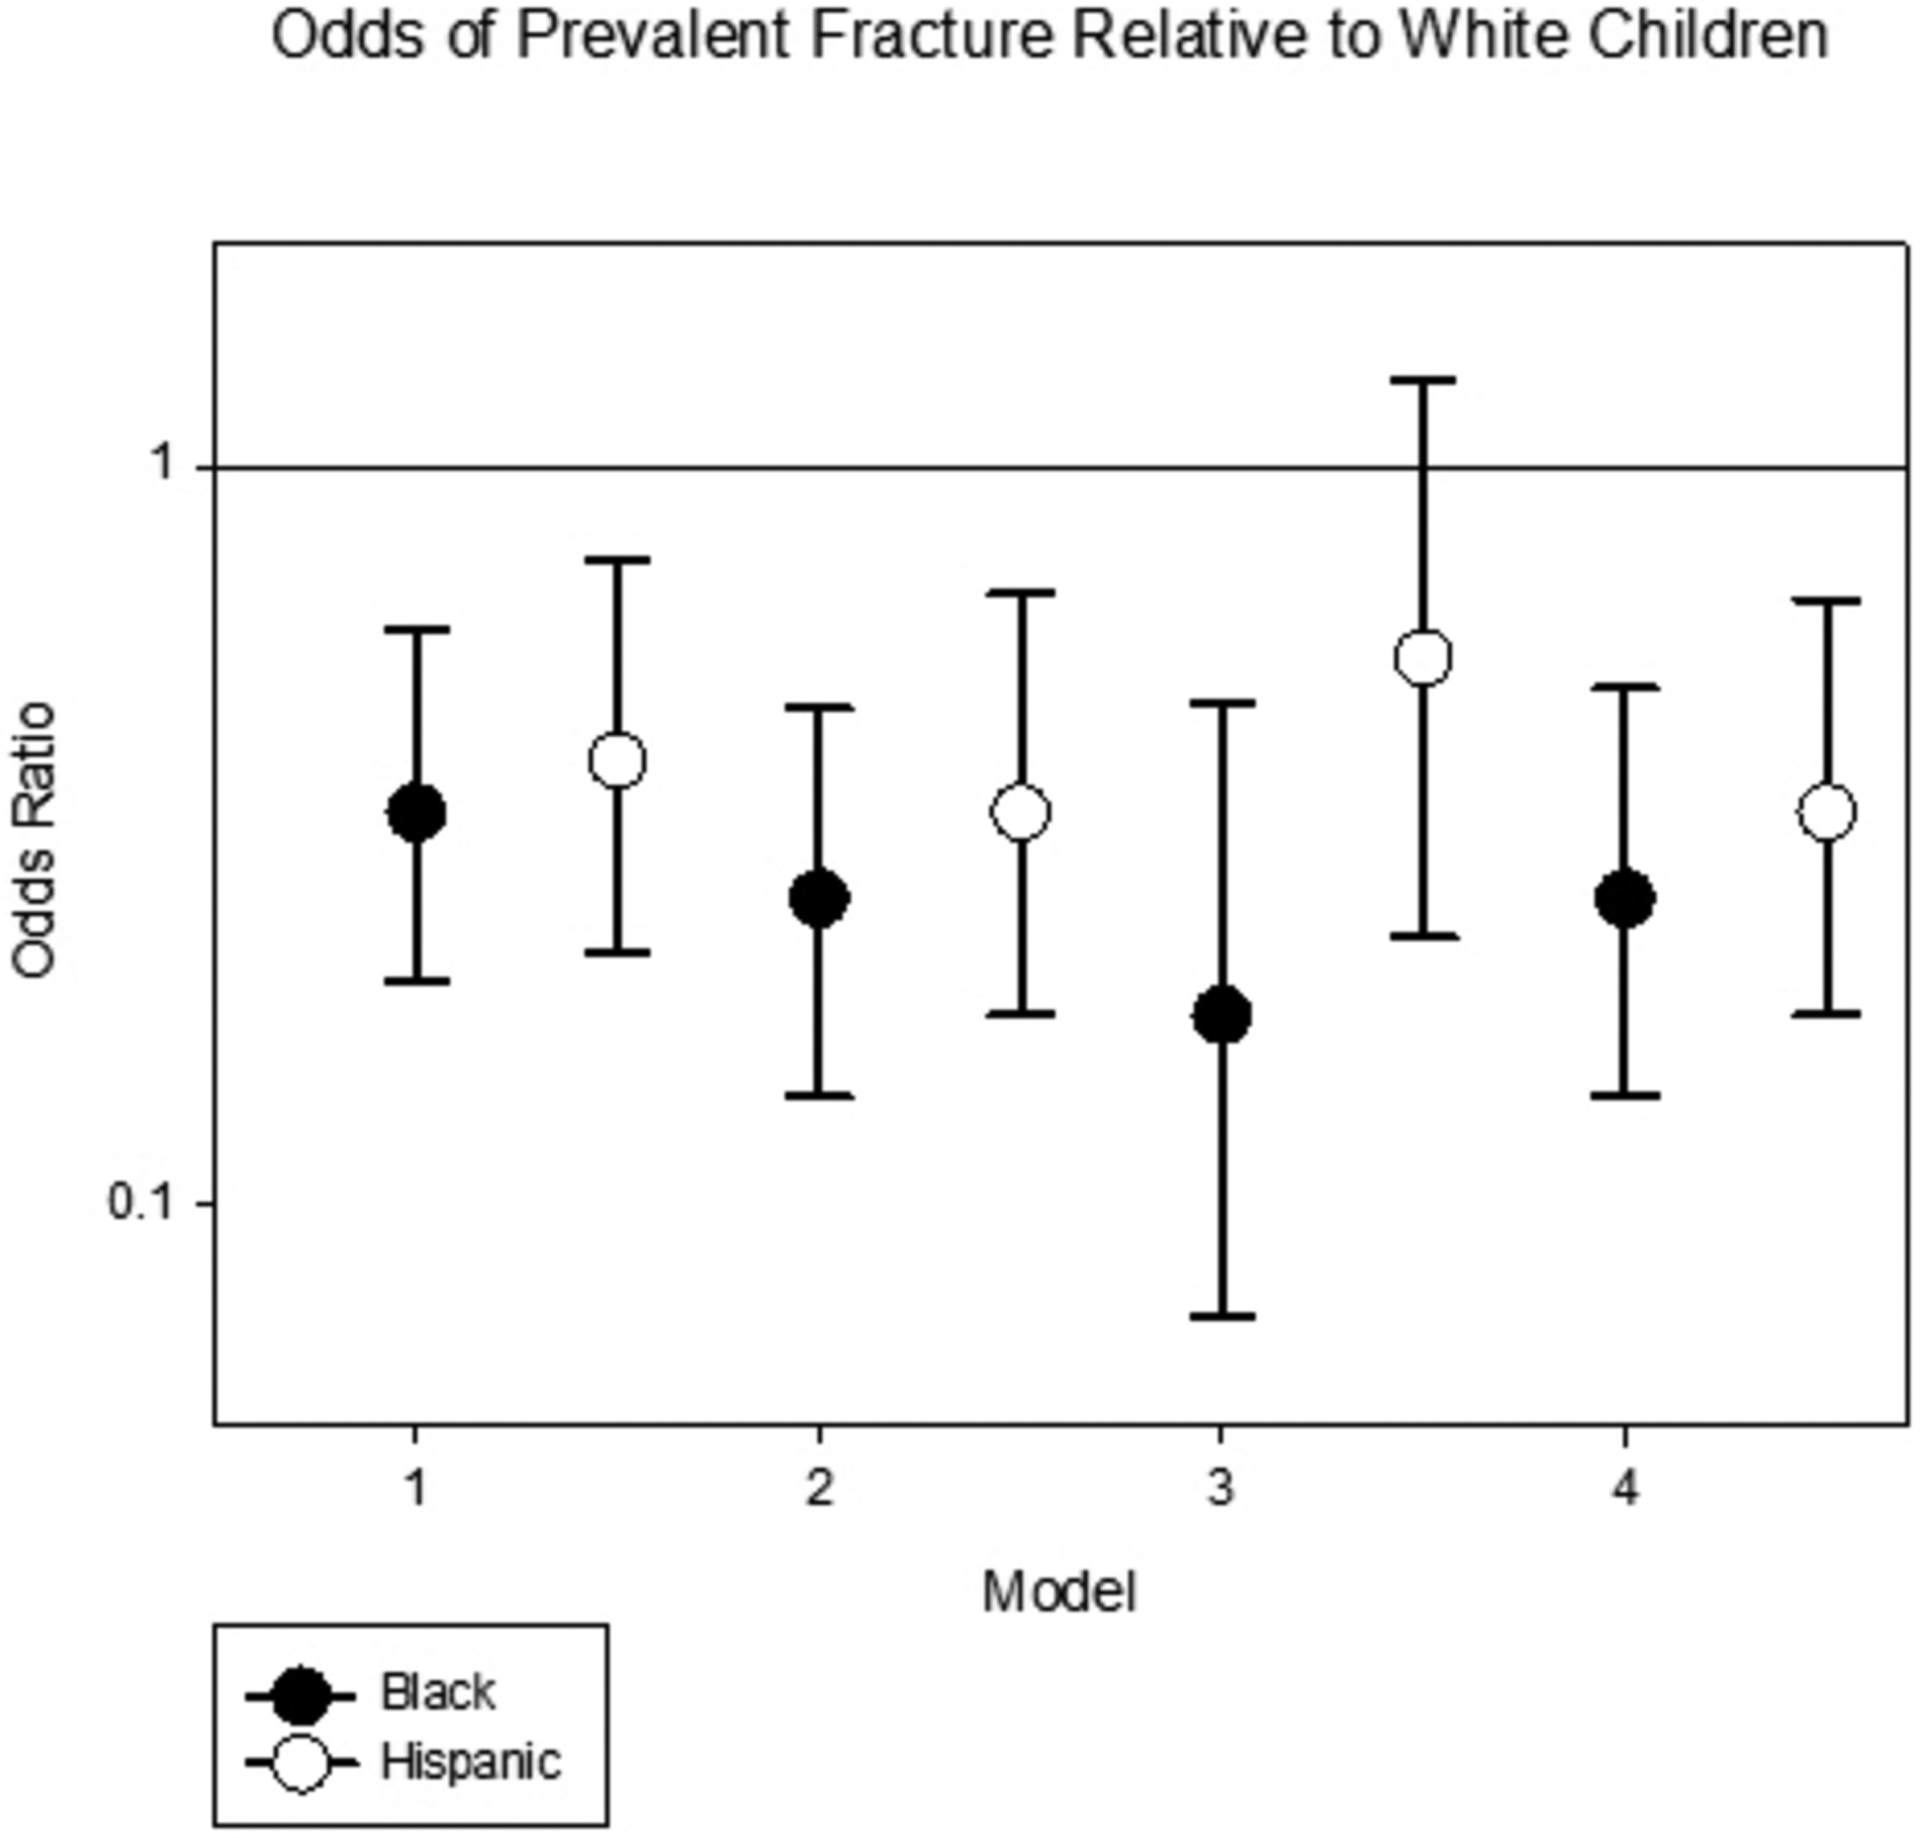
Odds of prevalent fracture relative to Caucasian children
DISCUSSION
In this study, we demonstrate higher PTH levels in African American children with CKD as compared to Caucasian children, although this difference was lost after controlling for 25-OHD. By contrast, PTH values for Hispanic children were lower than Caucasian children and remained lower following multiple adjustments including 25-OHD. We also demonstrate lower 25-OHD levels and a lower prevalence of fracture among both African-American and Hispanic children when compared to Caucasian children. Our findings are consistent with studies in adults with CKD, which similarly demonstrate elevated PTH, lower 25-OHD, and yet a decreased fracture risk amongst African-American patients.(10,13,14) The attenuation of the difference in PTH levels upon adjustment for 25-OHD in the African American children is contrary to studies by Gutierrez et al. and Waziri et al. who found elevated PTH levels in Black vs. non-Black patients even after adjusting for 25-OHD.(15,16) It is possible that the decrease in the number of participant samples that occurred with 25-OHD adjustment contributed to the loss of the significant effect of race on PTH levels. It is additionally possible that the adjustment for 25-OHD represents over-adjustment considering the close correlation of race and ethnicity with risk of Vitamin D deficiency within this cohort. For instance, the prevalence of Vitamin D deficiency (defined as 25-OHD less than 30) ranged from 75–90% by CKD stage in African Americans vs. 43–48% in Caucasians at the baseline visit. Adjustment for 25-OHD did reveal a lower PTH level among Hispanic subjects, a finding contrary to the findings within a pediatric dialysis population which demonstrated higher PTH levels in Hispanic compared to Caucasian children.(8) Still, this difference between CKD and dialysis patients may reflect differences in the severity of secondary hyperparathyroidism and an increased contribution of factors such as phosphate and calcium balance, treatment response, as well as other factors unique to the dialysis population.
Our study provides further evidence of racial-ethnic differences in bone outcomes through the inclusion of Hispanic patients who, like African-Americans, demonstrated a lower risk of prevalent fracture when compared to Caucasian patients. This is consistent with fracture risk studies of the healthy pediatric population that show greater fracture risk in Caucasian children compared to a composite group of minorities.(6) Our study reaffirms the skeletal paradox of Vitamin D and fracture risk. Despite consistently lower Vitamin D levels within both African-American and Hispanic subjects, fracture risk was substantially lower than Caucasian children. This suggests that Vitamin D sufficiency, as currently defined, is not highly reflective of the risk of fracture. The importance of bioavailable Vitamin D levels between racial-ethnic groups remains an area of consideration but current data suggesting either similar or lower bioavailable Vitamin D levels in African-Americans still fail to explain the greater bone density and lower fracture risk observed.(17)
We additionally demonstrated lower c-terminal FGF23 levels in Hispanic participants which supports a similar finding within this cohort by Portale et al.(18) Interestingly, Hispanic participants demonstrated lower FGF23 levels despite similar phosphate levels and higher usage of active Vitamin D sterols. This may be indicative of the contribution of non-mineral factors to FGF23 levels including those related to iron metabolism and inflammation.(19) Thus, consideration of non-mineral contributions to FGF23 in future studies may help to elucidate these racial-ethnic differences. This tendency toward lower FGF23 in Hispanic patients is also of great interest because of the known association of FGF23 with adverse cardiovascular outcomes and mortality. Given known differences in survival by race and ethnicity within pediatric populations on dialysis, it is critical to consider how this mortality-related marker may play a role in these differences.(20) Although we did not demonstrate lower FGF23 levels in African-Americans, previous studies of adult patients with CKD have shown this to be the case.(21)
A limitation of this study is the use of self-reported racial-ethnic category as the primary exposure. Racial-ethnic category is primarily a social designation and at best a gross description of ancestral genetic lineage that is often imprecise. An example of this is the current classification of Hispanic ethnicity, a category that mixes the African lineage of Puerto Rican-Americans with the Native American lineage of Mexican-Americans.(22) Furthermore, racial-ethnic categories are unable to distinguish the epigenetic contributions to biology from the socio-economic associations with racial-ethnic categories. Supportive of a biologic role in these differences is the fact that similar differences in fracture risk, serum PTH levels and even favorable cortical bone histology are present within South African ‘Black” populations when compared to South African “White” populations.(16,23) For these reasons, further studies will need to consider genetic ancestral lineage and its association with the biological differences such as varying prevalence of gene polymorphisms that may be grossly characterized by racial-ethnic category. A second limitation of this study lies in its reliance on self-reported fracture history. Given the fallacy of distant recall, it is possible that fracture reporting is not accurate. Still, this should be somewhat similar across all groups and less of a concern given the fracture analysis is based upon “ever” having a previous fracture prior to the baseline visit as opposed to the number of previous fractures. Moreover, the reporting of prevalent fracture may capture fractures that occurred before the onset of CKD. An additional limitation of this study is the discrepancy between this study’s finding that race and ethnicity associate with prevalent fracture and a prior study within the same population by Denburg et al. demonstrating no significant association of race with incident fracture. In the analysis of incident fracture, this study similarly did not demonstrate an association of race and ethnicity with incident fracture. The difference in the outcome between the analyses of prevalent vs. incident fracture may be due to differences in the number of fractures available for each analysis. For the prevalent analysis, 142 fractures were reported whereas for the incident analysis, only 55 fractures were reported. The lower number of incident fractures may limit the ability to detect an association by race and ethnicity and underscores the need for larger sample sizes to confirm the relationship suggested by the analysis of prevalent fracture. Although not reaching statistical significance, the direction of the association of race and ethnicity on fracture outcomes within the incident fracture analysis is consistent with the findings of the prevalent analysis with African-American race and Hispanic ethnicity both predicting a decrease in the incidence of fracture.
In conclusion, this study has described racial-ethnic differences in bone markers and reported fractures, and it illustrates the presence of a paradox of abnormal mineral markers in African-Americans, yet lower fracture risk. Additionally, this study identifies the presence of this same paradox within the Hispanic population. Given these findings, it becomes critical to consider the outcomes targeted by our current therapies. Since therapies such as active Vitamin D sterols can be associated with adverse events, it is important that we better define the intensity with which each patient needs to be treated in order to achieve the long-term goals of adequate growth, prevention of deformity and fractures and enhancement of cardiovascular health while limiting the adverse effects of treatment.
Supplementary Material
ACKOWLEDGEMENTS
Data in this manuscript were collected by the Chronic Kidney Disease in children prospective cohort study (CKiD) with clinical coordinating centers (Principal Investigators) at Children’s Mercy Hospital and the University of Missouri-Kansas City (Bradley Warady, MD) and Children’s Hospital of Philadelphia (Susan Furth, MD, PhD), Central Biochemistry Laboratory (George Schwartz, MD) at the University of Rochester Medical Center, and data coordination center (Alvaro Munoz, PhD) at the Johns Hopkins Bloomberg School of Public Health. The CKiD Study is supported by grants from the National Institute of Diabetes and Digestive and Kidney Diseases, with additional funding from the Eunice Kennedy Shriver National Institute of Child Health and Human Development, and the National Heart, Lung and Blood Institute (U01-DK-66143, U01-DK-66174, U01-DK-082194, U01-DK-66116). The CKiD website is located at http://www.statepi.jhsph.edu/ckid. KN is supported in part by NIH research grants UL1TR000124 (NCATS) and P30AG021684 (NIA). The work of ML and IBS is supported by T32-DK104687 (NIDDK). The work of ML is additionally supported by K23-DK123378 (NIDDK). JK is supported by grants R01HD091185 (NICHD) and UL1TR00457 (NIH/NCATS). KK-Z is supported in part by NIH grant K24-DK091419 (NIDDK).
DISCLOSURES
Dr. K. Kalantar-Zadeh has received honoraria and/or support from Abbott, Abbvie, ACI Clinical (Cara Therapeutics), Akebia, Alexion, Amgen, Astra-Zeneca, Aveo, BBraun, Chugai, Cytokinetics, Daiichi, DaVita, Fresenius, Genentech, Haymarket Media, Hospira, Kabi, Keryx, Kissei, Novartis, Pfizer, Regulus, Relypsa, Resverlogix, Sandoz, Sanofi, Shire, Vifor, UpToDate, ZS-Pharma. Dr. B. Warady is a consultant for Amgen. Dr. Salusky is a consultant for Akebia and Bayer and has received support from Abbvie, Amgen and Ultragenyx.
The data that support the findings of this study are available from the Chronic Kidney Disease in children prospective cohort study (CKiD).
REFERENCES
- 1.Groothoff JW, Offringa M, Van Eck-Smit BLF, et al. Severe bone disease and low bone mineral density after juvenile renal failure. Kidney Int. 2003; 63: 266–75. [DOI] [PubMed] [Google Scholar]
- 2.KDIGO 2017 Clinical Practice Guideline Update for the Diagnosis, Evaluation, Prevention, and Treatment of Chronic Kidney Disease-Mineral and Bone Disorder (CKD-MBD). Kidney Int. 2017; 7:1–59. [DOI] [PMC free article] [PubMed] [Google Scholar]
- 3.Gilsanz V, Roe TF, Mora S, et al. Changes in vertebral bone density in black girls and white girls during childhood and puberty. N Engl J Med. 1991; 325:1597–1600. [DOI] [PubMed] [Google Scholar]
- 4.Gilsanz V, Skaggs DL, Kovanlikaya A, et al. Differential Effect of Race on the Axial and Appendicular Skeletons of Children. J Clin Endocrinol Metab. 1998; 83:1420–7. [DOI] [PubMed] [Google Scholar]
- 5.Warden SJ, Hill KM, Ferira AJ, et al. Racial differences in cortical bone and their relationship to biochemical variables in Black and White children in the early stages of puberty. Osteoporos Int. 2013; 24: 1869–79. [DOI] [PMC free article] [PubMed] [Google Scholar]
- 6.Wren TA, Shepherd JA, Kalkwarf HJ, et al. Racial Disparity in Fracture Risk between White and Nonwhite Children in the United States. J Pediatr. 2012; 161: 1035–40. [DOI] [PMC free article] [PubMed] [Google Scholar]
- 7.Kumar J, McDermott K, Abraham AG, et al. Prevalence and correlates of 25-hydroxyvitamin D deficiency in the Chronic Kidney Disease in Children (CKiD) cohort. Pediatr Nephrol. 2016; 31: 121–9. [DOI] [PMC free article] [PubMed] [Google Scholar]
- 8.Laster M, Soohoo M, Streja E, et al. Racial-ethnic differences in chronic kidney disease-mineral bone disorder in youth on dialysis. Pediatr Nephrol. 2019; 34:107–15. [DOI] [PMC free article] [PubMed] [Google Scholar]
- 9.Denburg MR, Kumar J, Jemielita T, et al. Fracture Burden and Risk Factors in Childhood CKD: Results from the CKiD Cohort Study. J Am Soc Nephrol. 2016; 27:543–50. [DOI] [PMC free article] [PubMed] [Google Scholar]
- 10.Ball AM, Gillen DL, Sherrard D, et al. Risk of hip fracture among dialysis and renal transplant recipients. JAMA. 2002; 288:3014–18. [DOI] [PubMed] [Google Scholar]
- 11.Kaneko TM, Foley RN, Gilbertson DT, et al. Clinical Epidemiology of Long-bone Fractures in Patients Receiving Hemodialysis. Clin Orthop Relat Res. 2007; 457:188–93. [DOI] [PubMed] [Google Scholar]
- 12.Schwartz GJ, Munoz A, Schneider MF, et al. New equations to estimate GFR in children with CKD. J Am Soc Nephrol. 2009; 20: 629–37. [DOI] [PMC free article] [PubMed] [Google Scholar]
- 13.Thandrayen K, Norris SA, Pettifor JM. Fracture rates in urban South African children of different ethnic origins: The Birth to Twenty Cohort. Osteoporos Int. 2009; 20:47–52. [DOI] [PMC free article] [PubMed] [Google Scholar]
- 14.Mathew AT, Hazzan A, Jhaveri KD, et al. Increasing hip fractures in patients receiving hemodialysis and peritoneal dialysis. Am J Nephrol. 2014; 40:451–7. [DOI] [PubMed] [Google Scholar]
- 15.Gutiérrez OM, Isakova T, Andress DL, et al. Prevalence and severity of disordered mineral metabolism in Blacks with chronic kidney disease. Kidney Int. 2008; 73:956–62. [DOI] [PubMed] [Google Scholar]
- 16.Waziri B, Duarte R, Dickens C, et al. Racial Variations in the Markers of Mineral Bone Disorders in CKD Patients in South Africa. Kidney Int Reports. 2018; 3:583–91. [DOI] [PMC free article] [PubMed] [Google Scholar]
- 17.Powe CE, Evans MK, Wenger J, et al. Vitamin D-binding Protein and Vitamin D Status of Black American and White Americans. N Engl J Med. 2013; 369:1991–2000. [DOI] [PMC free article] [PubMed] [Google Scholar]
- 18.Portale AA, Wolf M, Jüppner H, et al. Disordered FGF23 and mineral metabolism in children with CKD. Clin J Am Soc Nephrol. 2014; 9:344–53. [DOI] [PMC free article] [PubMed] [Google Scholar]
- 19.David V, Martin A, Isakova T, et al. Inflammation and functional iron deficiency regulate fibroblast growth factor 23 production. Kidney Int. 2016; 89:135–46. [DOI] [PMC free article] [PubMed] [Google Scholar]
- 20.Laster M, Soohoo M, Hall C, et al. Racial–ethnic disparities in mortality and kidney transplant outcomes among pediatric dialysis patients. Pediatr Nephrol. 2017; 32:685–95. [DOI] [PMC free article] [PubMed] [Google Scholar]
- 21.Jovanovich A, Chonchol M, Cheung AK, et al. Racial differences in markers of mineral metabolism in advanced chronic kidney disease. Clin J Am Soc Nephrol. 2012; 7:640–7. [DOI] [PMC free article] [PubMed] [Google Scholar]
- 22.Risch N, Choudhry S, Via M, et al. Ancestry-related assortative mating in Latino populations. Genome Biol. 2009; 10:R132. [DOI] [PMC free article] [PubMed] [Google Scholar]
- 23.Schnitzler CM, Mesquita JM, Pettifor JM. Cortical bone development in black and white South African children: Iliac crest histomorphometry. Bone. 2008; 44:603–11. [DOI] [PubMed] [Google Scholar]
Associated Data
This section collects any data citations, data availability statements, or supplementary materials included in this article.