Abstract
Delirium is associated with electroencephalogram (EEG) slowing and impairments in connectivity. We hypothesized that delirium would be accompanied by a reduction in the available cortical information (ie, there is less information processing occurring), as measured by a surrogate, Lempil-Ziv Complexity (LZC), a measure of time-domain complexity. Two ongoing perioperative cohort studies (NCT03124303, NCT02926417) contributed EEG data from 91 patients before and after surgery; 89 participants were used in the analyses. After cleaning and filtering (0.1–50Hz), the perioperative change in LZC and LZC normalized (LZCn) to a phase-shuffled distribution were calculated. The primary outcome was the correlation of within-patient paired changes in delirium severity (Delirium Rating Scale-98 [DRS]) and LZC. Scalp-wide threshold-free cluster enhancement was employed for multiple comparison correction. LZC negatively correlated with DRS in a scalp-wide manner (peak channel r2 = .199, p < .001). This whole brain effect remained for LZCn, though the correlations were weaker (peak channel r2 = .076, p = .010). Delirium diagnosis was similarly associated with decreases in LZC (peak channel p < .001). For LZCn, the topological significance was constrained to the midline posterior regions (peak channel p = .006). We found a negative correlation of LZC in the posterior and temporal regions with monocyte chemoattractant protein-1 (peak channel r2 = .264, p < .001, n = 47) but not for LZCn. Complexity of the EEG signal fades proportionately to delirium severity implying reduced cortical information. Peripheral inflammation, as assessed by monocyte chemoattractant protein-1, does not entirely account for this effect, suggesting that additional pathogenic mechanisms are involved.
Keywords: Age-related pathology, Inflammation, Neurodegeneration
The pathogenesis of delirium is poorly understood, particularly the neurophysiology changes that occur as confusion develops. We propose that understanding the underlying neurophysiology mechanisms is critical to the development of novel therapeutics for delirium (1,2). The electroencephalogram (EEG) offers insights into neurophysiology and hence can provide insights into the pathophysiology of delirium, especially if the experiments are theoretically driven. Given the immense health care burden of delirium (3), and its effect on the individual (4), these developments are urgently required.
Based on prior cognitive theories, and in particular the Integrated Information Theory (5), we propose that delirium results when integrated information, particularly across higher-order cortex, drops below a critical level (2). We and others have studied integration using connectivity as a surrogate, showing that it is reduced in delirium (1,6). Here, we focus on cortical information or differentiation, using Lempil-Ziv complexity (LZC) as a surrogate (7). LZC can be conceptualized as a quantification of the number of different firing states in the brain, with greater information necessitating a larger repertoire of neuronal firing states, reflected in larger LZC values. We hypothesized that delirium would be associated with reduced cortical information, and hence lower LZC values. Further, a proportional change in LZC with delirium severity would provide further confidence for a potential causal relationship. This is supported by work showing reductions of LZC associated with dementia (8). Given our recent work showing that EEG slowing and connectivity changes in delirium were associated with cytokine monocyte chemoattractant protein (MCP-) 1 (1), we also investigated whether the changes in LZC could be explained by changes in peripheral inflammation (9,10). Furthermore, if LZC is established as robust biomarker of the delirious state, then subsequent trials of neuromonitoring may be indicated.
Materials and Methods
The data are derived from 2 perioperative cohort studies, IPOD-B2 and IPOD-B3, registered with ClinicalTrials.gov (NCT03124303, NCT02926417) and approved by the University of Wisconsin-Madison Institutional Review Board (#2015-0374, 2015-0960). IPOD-B2 is a cohort study of adult participants undergoing thoracic aortic aneurysm repair (open or endovascular; Supplementary Table 1), while IPOD-B3 is a cohort of older adult patients (>65 years old) undergoing major surgery (Supplementary Table 2). EEG data were collected from 91 patients before and after surgery. These data were previously reported (1,11). From the analysis, 2 participants’ data were excluded due to poor impedance and artifact noise in the preoperative data collection. Eighty-nine participants were used in the analyses.
The 89 participants were grouped to delirious or nondelirious at the time of the EEG recording, depending on postoperative confusion assessment method diagnoses of delirium status (CAM+/- (12,13) or CAM-ICU+/- if ventilated (14)).
Associated with the resting state EEG, we collected blood samples for biomarker analyses. Plasma samples were collected in EDTA-containing tubes preoperatively, stored at −80°C, and sent for cytokine multiplex assay (Eve Technology, Calgary, Canada). Herein, we focused on cytokine MCP-1 (1) with robust relationships to delirium in our prior work.
EEG Recording and Preprocessing
EEG data were collected using saline-cap–based high-density-EEG with 256 channels (Electrical Geodesics, Inc., Eugene, OR) at a sampling frequency of 250 Hz. Five participants’ data were down-sampled from 500 Hz to 250 Hz. During the recording, participants were instructed to sit quietly, with eyes closed, relaxed, but not to fall asleep. If patients did not adhere to the instructions at any time during the recording, we excluded that data segment. Data from periods with eyes closed were analyzed in EEGLAB (Swartz Center for Computational Neuroscience, San Diego, CA). The data were filtered by 0.1 to 50 Hz with Hamming windowed sinc FIR filter. Unprocessed data are presented in Supplementary Figure 1. Channels and data segments with predominant artifacts were removed. Independent component analysis was applied to remove eye and muscle movement artifacts. Finally, the removed channels were interpolated and signals were average-referenced. Recordings were 15 minutes long and after preprocessing had median 8.5 minutes in duration (interquartile range 5.4–10.6). There was no correlation between the durations of available EEG data and delirium severity or delirium diagnosis (yes/no) (p > .8). Data time series were divided into epochs 10 seconds long and were binarized using the median amplitude.
Lempel Ziv Complexity
To estimate the signal complexity, we calculated LZC (7), which is a measure of the number of distinct patterns within a binary time series. The LZC is defined as the counted sum of sub-strings in a signal, where the sub-strings are determined by iterating and counting unique binary sequences that have not been encountered in the prior signal sequence. The LZC was normalized by the theoretical upper bound of LZC, L/log2(L), where L is the signal length. The LZC was calculated and averaged across 10s segments of data.
To control for LZC due to changes in signal power, we normalize LZC (LZCn) (15) by dividing by phase shuffled LZC in addition to the theoretical upper bound of LZC (Supplementary Figure 2). The phase-shuffled LZC was calculated by randomly phase shuffling the actual signal before counting the sum of sub-strings. LZC was divided by the averaged value of 100 such randomly phase-shuffled LZC.
Statistical Analysis
To investigate whether delirium severity (DRS) is associated with LZC, we correlated preoperative to postoperative change in DRS with preoperative to postoperative change in LZC. Data were assessed for normality (Supplementary Figure 3). We additionally undertook binary contrasts between participants who were delirious at the time of the postoperative EEG or not and the relevant change in the EEG. We also undertook further correlations between plasma cytokines that we previously observed were associated with EEG changes in power and connectivity (1). In order for any analysis to be considered significant, statistical significance after multiple comparison correction with Statistical Non-Parametric Mapping threshold-free cluster enhancement (TFCE) (16) was required. The raw data from the peak effect channel are also plotted for descriptive purposes. Prior power analysis based on relevant EEG changes associated with delirium (increased delta power) suggested a sample size of 59 participants was required (99% power) (1). We had no prior information on how LZC would vary with delirium and hence we analyzed all available data from our cohort. This would also reduce potential sources of bias from selecting a sub-group of data.
Results
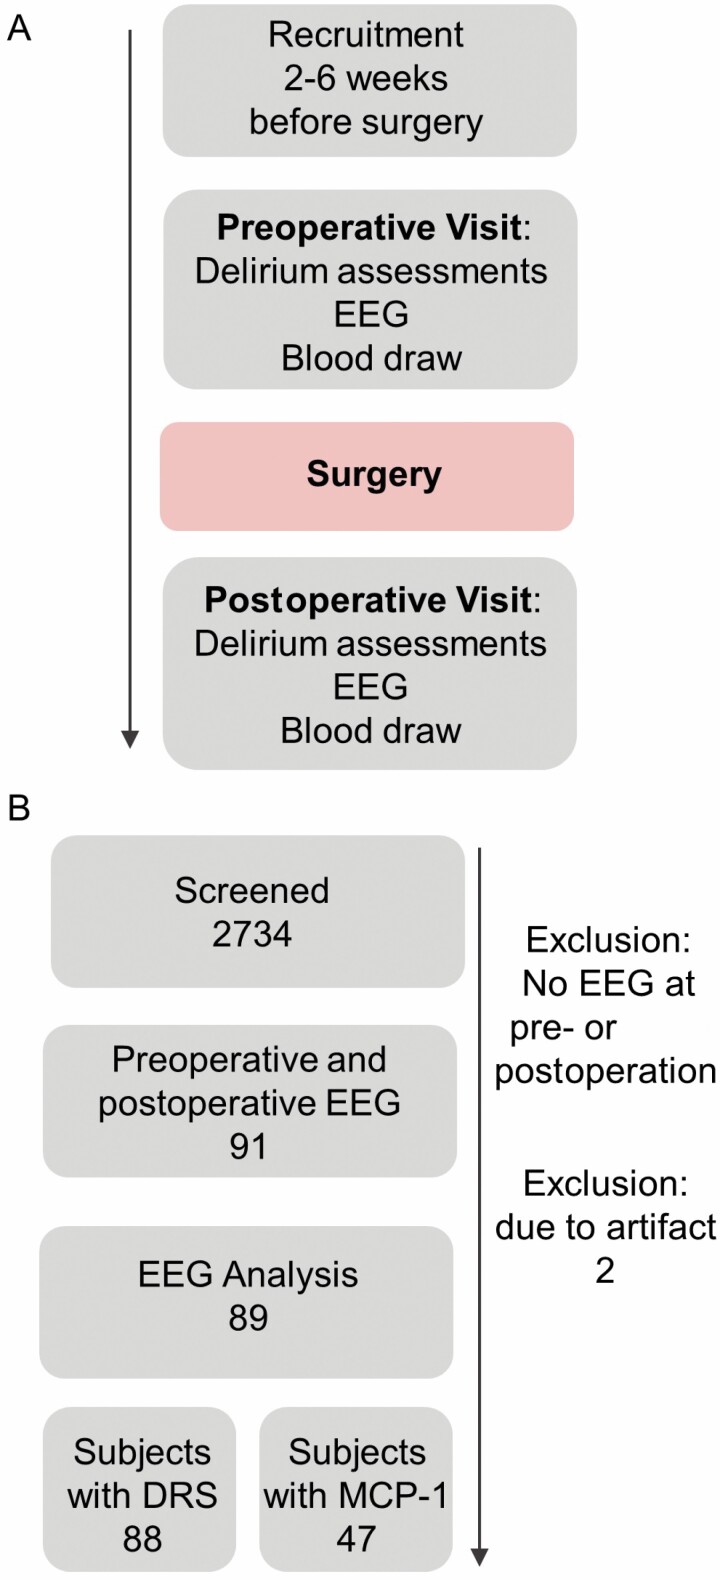
Ninety-one participants consented to a perioperative EEG. Eighty-nine participants had analyzable data. All possible data were included in the analyses of LZC (Figure 1). The median change in delirium severity was 7 (interquartile range 5–11). There were 30 delirious participants and 59 participants who were not delirious. The demographics of the cohort are available in Supplementary Table 3.
Figure 1.
STROBE diagram. (A) Study design. Delirium severity (DRS) is collected during delirium assessments, both preoperative and postoperative visits. (B) Data are from IPODB2 and IPODB3 perioperative cohort studies.
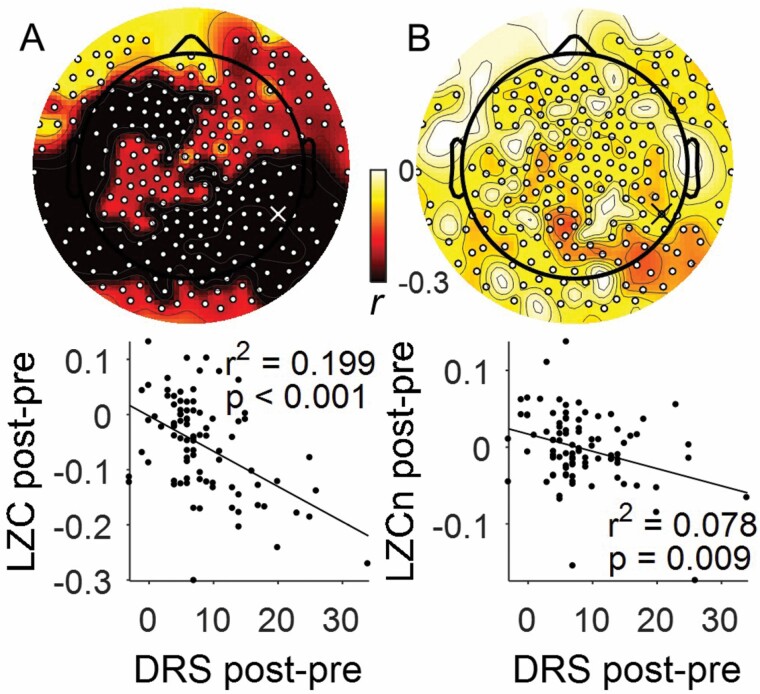
To investigate whether DRS was associated with LZC, we correlated preoperative to postoperative change in DRS with preoperative to postoperative change in LZC. After correcting for multiple corrections across channels, whole brain LZC negatively correlated with DRS (peak channel 179, r2 = .199, p < .001, Figure 2A). This whole brain effect remained for LZCn (peak channel 179, r2 = .078, p = .009, Figure 2B).
Figure 2.
Delirium severity (DRS) is associated with decreased Lempel Ziv Complexity (LZC). Correlation of change in DRS with (A) LZC (n = 88) and (B) LZCn (n = 88) with statistically significant electrodes shown by white dots (corrected TFCE, p < .05). Example channel Spearman’s correlation plotted at 90th percentile effect size overlapping between LZC and LZCn, shown by white “X” in (A) and black “X” in (B) (channel 179).
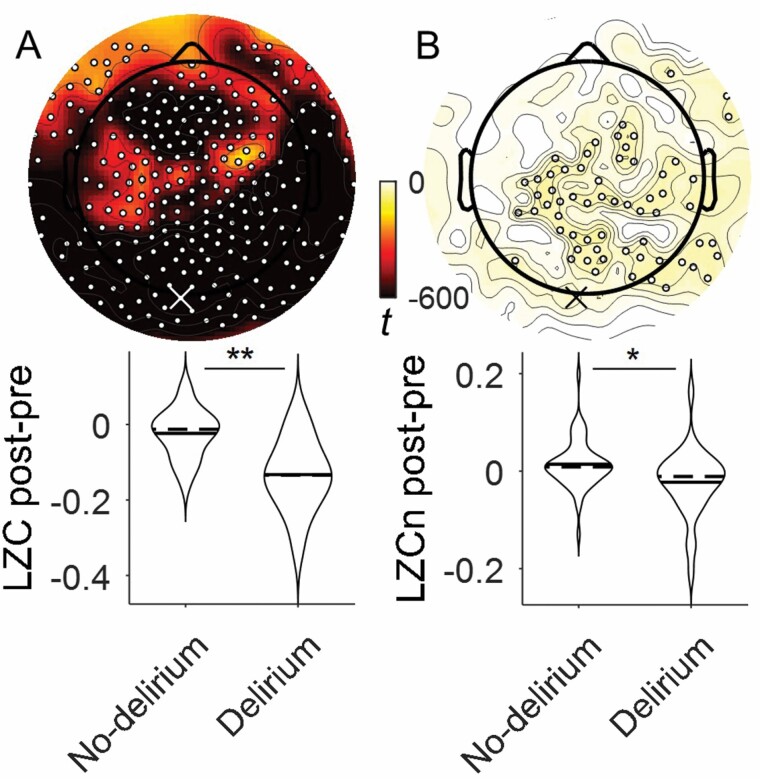
We next asked whether a binary delirium diagnosis (CAM+/-) is associated with decreased LZC. Delirium diagnosis was associated with whole brain decreases in LZC (peak channel 136, p < .001, Figure 3A). For LZCn, topological significance was constrained to the midline posterior regions (peak channel 136, p = .006, Figure 3B).
Figure 3.
Delirium incidence is associated with decreased Lempel Ziv Complexity. Contrast between LZC of patients who do and do not incur delirium with statistically significant electrodes shown by white dots (corrected TFCE t-map p < .05). Analysis of (A) LZC and (B) LZCn (No-delirium n = 59, Delirium n = 30). Example 2-sided Wilcoxon rank sum test plotted at 90th percentile effect size overlapping between LZC and LZCn, shown by white “X” in (A) and black “X” in (B) (channel 136), *p < .01, **p < .001.
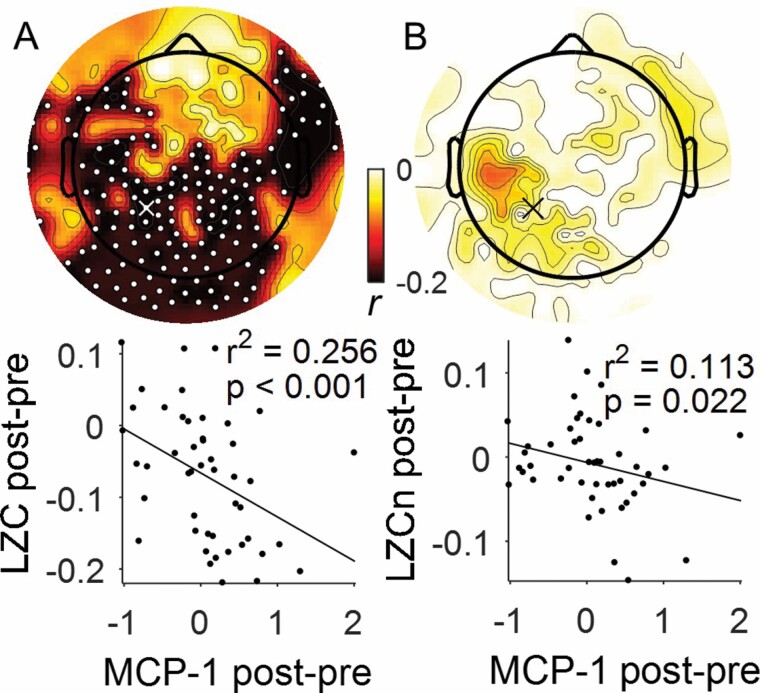
We also investigated the association of LZC and perioperative changes in cytokine MCP-1. We found negative correlations with LZC perioperative changes in the posterior and temporal regions (peak channel 87, r2 = .264, p < .001, Figure 4A). But, no significant changes were detected for LZCn. However, the TFCE R-value was predominantly biased to posterior region (peak channel 87, r2 = .127, p = .014, Figure 4B).
Figure 4.
Lempel Ziv Complexity correlation with MCP-1. (A) LZC analysis (n = 47) and (B) LZCn analysis (n = 47) with statistically significant electrodes shown by white dots (corrected TFCE p < .05). Example Spearman’s correlation plotted at 90th percentile effect size overlapping between LZC and LZCn, shown by white and black “X” (channel 87).
To verify LZCn effectively normalizes slow wave power, we correlated LZCn with slow wave activity (SWA). Before phase shuffle normalization, we found LZC perioperative change has global negative correlations with SWA (peak channel 87, r2 = .641, p < .001, Supplementary Figure 4A). After normalization, there is still a correlation between LZCn perioperative change with SWA, however the global R-value and count of significant channels decreases (peak channel 87, r2 = .114, p = .001, Supplementary Figure 4B). These results were unchanged in sensitivity analysis using Laplacian, rather than average, referencing (Supplmentary Figures 5 and 6).
Using linear regression, we next determined if LZCn and SWA have independent effects with DRS perioperative changes using the peak channel response for LZC/LZCn. Before phase shuffle normalization, only LZC had effects (linear regression, channel 179, t = −2.97, p = .004, Supplementary Table 4) with perioperative changes in DRS. After normalization, LZCn and SWA had independent associations (channel 179; LZCn t = −2.06, p = .042; SWA t = 3.47, p < .001, Supplementary Table 4) with DRS.
Finally, we conducted linear regression, based on the peak channel, to identify if postoperative sedatives and opioid analgesics, administered within 2 hours of the EEG, confounded the relationship of LZC or LZCn with changes in DRS. To capture any additional sedative contribution, not captured by this information alone, we included the Richmond Agitation Sedation Scale at time of EEG in the regression (results were qualitatively the same without these data too). Finally, while the paired change data essentially normalize for the baseline state, we also included preoperative Trail Making Test B as a measure of cognition that is strongly associated with delirium. Table 1 shows that change in DRS is associated with LZC or LZCn, even when adjusting for these confounders.
Table 1.
Linear Regression with Outcome of Delirium Severity and Predictors of Lempel-Ziv Comlpexity (LZC) or LZC, Exposure to Opioids or Sedatives, RASS and Preoperative Cognition (Trails Making Test B)
| Estimate | SE | t | p | |
|---|---|---|---|---|
| DRS~1+LZC+Opioids/Fentanyl+Sedatives+RASS+Preop-TMTB | ||||
| LZC | −35.19 | 7.46 | −4.71 | <.001 |
| Opioids/Fentanyl | 1.56 | 1.22 | 1.28 | .203 |
| Sedatives | 9.37 | 2.65 | 3.53 | <.001 |
| RASS | 1.59 | 0.88 | 1.80 | .077 |
| Preop-TMTB | 0.02 | 0.01 | 1.45 | .151 |
| DRS~1+LZCn+Opioids/Fentanyl+Sedatives+RASS+Preop-TMTB | ||||
| LZCn | −34.55 | 16.58 | −2.08 | .041 |
| Opioids/Fentanyl | 2.49 | 1.37 | 1.81 | .074 |
| Sedatives | 9.52 | 3.08 | 3.09 | .003 |
| RASS | 1.81 | 0.99 | 1.82 | .073 |
| Preop-TMTB | 0.03 | 0.01 | 2.33 | .022 |
Notes: Linear regression fit on DRS and LZC/LZCn pre- to postoperative changes (channel 179, N = 88). Channel 179 is in the 90th percentile effect size overlapping of LZC and LZCn correlation with DRS. DRS = Delirium Rating Scale-98-R; LZC = Lempel Ziv Complexity; LZCn = phase shuffle normalized Lempel Ziv Complexity; Preop-TMTB = preoperative trail making test part B; RASS = Richmond agitation-sedation scale. Opioids or sedatives (dexmedetomidine, propofol or benzodiazepines) are measured as dose yes/no within 2 hours of EEG.
Discussion
Consistent with our hypothesis, we found that the greater the delirium severity, the lesser the information/differentiation in the EEG, as reported by LZC. This pattern suggests that there is a reduced repertoire of neuronal firing states in delirium, or a loss of cortical information. The effect on complexity/differentiation was apparent even after normalizing to a phase-shuffled distribution, and in linear regression adjusting for SWA, implying that the loss of cortical information was not explained merely by amplitude changes in the EEG signal. Furthermore, the LZCn data emphasize loss of information in posterior cortical regions, which overlaps with where we previously observed the strongest correlations of EEG slowing with delirium severity. These results were also robust to confounding in linear regression with adjustment for sedative and analgesic administration (Table 1). Overall, our data appear to emphasize a role of posterior cortex in the mechanisms of delirium and provide a pathway for the development of novel therapeutic strategies that modulate cortical information.
It is intriguing that inflammation, as measured by MCP-1, was associated with changes in LZC, but not LZCn. This finding may imply that MCP-1 alone cannot explain the loss of cortical information during delirium. However, as the cytokine data were only available on a subset of the data, we cannot exclude that loss of statistical power explains this effect or that other cytokines may have a larger effect (though MCP-1 was the cytokine with the most obvious changes with delirium in our prior analysis (1)). Overall, our data are consistent with delirium being associated with reduced cortical information as we hypothesized (2). These insights pave the way for animal work (17) to determine the mechanisms through which inflammation may decrease the complexity of neuronal firing. Furthermore, associations between other putative mechanisms of delirium neurodegeneration and oxidative stress and changes in complexity should be sought.
The next steps will be to identify whether cortical information can be modulated in delirium and therefore improve delirium symptoms. Proof of principle for this may be obtained by a study of environmental enrichment where return of glasses or hearing aids are provided to improve sensory orientation. In the future, it would be of interest to test if modulation of systemic inflammation or EEG slowing could be harnessed to improve LZC, though our data suggest they may not be sufficient alone to reverse all the changes in complexity. Furthermore, it remains unclear whether the reduced repertoire of synaptic depolarizations (and hence LZC) may represent changes in synaptic pruning or neuronal loss (8–10,18). As we focus on the change from preoperative levels, our data would argue for acute changes in synaptic structure and function which would be consistent with recent data that delirium is associated with rises in neuronal injury biomarkers, tau (10) and neurofilament light (9). Future work should address how LZC changes are represented in synaptic function and structure.
Our study has important limitations. First, our study is observational in nature and we cannot ascribe causality to our findings. This was an important motivator for looking for a biological gradient between delirium severity and LZC to increase our confidence of possible causal relationship. Second, although we calculated the change in LZC to reduce interindividual variation attributable to the preoperative state, we cannot exclude effects from additional unmeasured confounding, though we have attempted to adjust for some confounders in our linear regression analysis. Third, our cohort was of modest size and we suggest that future work is required to validate and extend these findings, particularly with reference to inflammatory biomarkers. Fourth, as dementia was an exclusion criterion, we cannot comment on delirium superimposed on dementia. Despite these limitations, our study suggests LZC as a promising novel pathological biomarker of the delirium state.
Conclusion
In summary, delirium severity correlated with reductions in LZC, a surrogate of cortical information. Future studies should investigate what factors beyond inflammation may contribute to the fade in information and identify if modifiable risk factors improve delirium symptoms in parallel to improving cortical information.
Funding
This work was supported by the National Institute on Aging (grant number NIA R01 AG063849-01).
Conflict of Interest
None declared.
Supplementary Material
Author Contributions
R.D.S. designed the research with input from M.I.B., R.L., and R.A.P. and S.T. collected the data. EEG analyses were completed by S.T. with input from M.I.B. and R.D.S. Clinical data analysis was conducted by M.W. and R.D.S. All authors contributed to the interpretation and writing of the article.
References
- 1. Tanabe S, Mohanty R, Lindroth H, et al. Cohort study into the neural correlates of postoperative delirium: the role of connectivity and slow-wave activity. Br J Anaesth. 2020;125(1):55–66. doi:10.1016/j.bja.2020.02.027 [DOI] [PMC free article] [PubMed] [Google Scholar]
- 2. Sanders RD. Hypothesis for the pathophysiology of delirium: role of baseline brain network connectivity and changes in inhibitory tone. Med Hypotheses. 2011;77(1):140–143. doi:10.1016/j.mehy.2011.03.048 [DOI] [PubMed] [Google Scholar]
- 3. Sanders RD, Pandharipande PP, Davidson AJ, Ma D, Maze M. Anticipating and managing postoperative delirium and cognitive decline in adults. BMJ. 2011;343:d4331. doi:10.1136/bmj.d4331 [DOI] [PubMed] [Google Scholar]
- 4. Inouye SK, Westendorp RG, Saczynski JS. Delirium in elderly people. Lancet. 2014;383(9920):911–922. doi:10.1016/S0140-6736(13)60688-1 [DOI] [PMC free article] [PubMed] [Google Scholar]
- 5. Tononi G. An information integration theory of consciousness. BMC Neurosci. 2004;5:42. doi:10.1186/1471-2202-5-42 [DOI] [PMC free article] [PubMed] [Google Scholar]
- 6. van Dellen E, van der Kooi AW, Numan T, et al. Decreased functional connectivity and disturbed directionality of information flow in the electroencephalography of intensive care unit patients with delirium after cardiac surgery. Anesthesiology. 2014;121(2):328–335. doi:10.1097/ALN.0000000000000329 [DOI] [PubMed] [Google Scholar]
- 7. Lempel A, Ziv J. On the complexity of finite sequences. IEEE Trans Inform Theory. 1976; 22:75–81. doi:10.1007/11863854_15 [Google Scholar]
- 8. Tanabe S, Bo A, White M, et al. Cohort study of electroencephalography markers of amyloid-tau-neurodegeneration pathology. Brain Commun. 2020;2(2):fcaa099. doi:10.1093/braincomms/fcaa099 [DOI] [PMC free article] [PubMed] [Google Scholar]
- 9. Casey CP, Lindroth H, Mohanty R, et al. Postoperative delirium is associated with increased plasma neurofilament light. Brain. 2020;143(1):47–54. doi:10.1093/brain/awz354 [DOI] [PMC free article] [PubMed] [Google Scholar]
- 10. Ballweg T, White M, Parker M, et al. Association between plasma tau and postoperative delirium incidence and severity: a prospective observational study. Br J Anaesth. 2021;126(2):458–466. doi:10.1016/j.bja.2020.08.061 [DOI] [PMC free article] [PubMed] [Google Scholar]
- 11. White MF, Tanabe S, Casey C, et al. Relationships between preoperative cortical thickness, postoperative electroencephalogram slowing, and postoperative delirium. Br J Anaesth. 2021;127(2):236–244. doi:10.1016/j.bja.2021.02.028 [DOI] [PMC free article] [PubMed] [Google Scholar]
- 12. Inouye SK, van Dyck CH, Alessi CA, Balkin S, Siegal AP, Horwitz RI. Clarifying confusion: the confusion assessment method. A new method for detection of delirium. Ann Intern Med. 1990;113(12):941–948. doi:10.7326/0003-4819-113-12-941 [DOI] [PubMed] [Google Scholar]
- 13. Marcantonio ER, Ngo LH, O’Connor M, et al. 3D-CAM: derivation and validation of a 3-minute diagnostic interview for CAM-defined delirium: a cross-sectional diagnostic test study. Ann Intern Med. 2014;161(8):554–561. doi:10.7326/M14-0865 [DOI] [PMC free article] [PubMed] [Google Scholar]
- 14. Ely EW, Inouye SK, Bernard GR, et al. Delirium in mechanically ventilated patients: validity and reliability of the confusion assessment method for the intensive care unit (CAM-ICU). JAMA. 2001;286(21):2703–2710. doi:10.1001/jama.286.21.2703 [DOI] [PubMed] [Google Scholar]
- 15. Schartner M, Seth A, Noirhomme Q, et al. Complexity of multi-dimensional spontaneous EEG decreases during propofol induced general anaesthesia. PLoS One. 2015;10(8):e0133532. doi:10.1371/journal.pone.0133532 [DOI] [PMC free article] [PubMed] [Google Scholar]
- 16. Smith SM, Nichols TE. Threshold-free cluster enhancement: addressing problems of smoothing, threshold dependence and localisation in cluster inference. Neuroimage. 2009;44(1):83–98. doi:10.1016/j.neuroimage.2008.03.061 [DOI] [PubMed] [Google Scholar]
- 17. Sultan ZW, Jaeckel ER, Krause BM, et al. Electrophysiological signatures of acute systemic lipopolysaccharide-induced inflammation: potential implications for delirium science. Br J Anaesth. 2021;126(5):996–1008. doi:10.1016/j.bja.2020.12.040 [DOI] [PMC free article] [PubMed] [Google Scholar]
- 18. Sanders RD, Craigova L, Schessler B, et al. Postoperative troponin increases after noncardiac surgery are associated with raised neurofilament light: a prospective observational cohort study. Br J Anaesth. 2021;126(4):791–798. doi:10.1016/j.bja.2020.10.012 [DOI] [PMC free article] [PubMed] [Google Scholar]
Associated Data
This section collects any data citations, data availability statements, or supplementary materials included in this article.


