

Abstract
The role of adipose tissue (AT) inflammation in AT function in humans is unclear. We tested whether AT macrophage (ATM) content, cytokine gene expression, and senescent cell burden (markers of AT inflammation) predict AT insulin resistance measured as the insulin concentration that suppresses lipolysis by 50% (IC50). We studied 86 volunteers with normal weight or obesity at baseline and a subgroup of 25 volunteers with obesity before and after weight loss. There was a strong positive relationship between IC50 and abdominal subcutaneous and femoral fat cell size (FCS). The positive, univariate relationships between IC50 and abdominal AT inflammatory markers CD68, CD14, CD206 ATM/100 adipocytes, senescent cells, IL-6, and TNF-α mRNA were not significant after adjustment for FCS. A 10% weight loss significantly reduced IC50; however, there was no reduction in adipose ATM content, senescent cells, or cytokine gene expression. Our study suggests that commonly used markers of AT inflammation are not causally linked to AT insulin resistance, whereas FCS is a strong predictor of AT insulin resistance with respect to lipolysis.
Introduction
Obesity has been referred to as a state of chronic inflammation. Several markers of tissue inflammation, such as macrophages and proinflammatory cytokines, have been reported to be increased in adipose tissue (AT) of humans with obesity (1–3). Additionally, results of animal studies suggest that inflammatory cells contribute directly to the AT dysfunction and insulin resistance in obesity (4). However, AT insulin resistance can cause AT inflammation in mice (as opposed to the other way around) (5). Because therapeutic approaches to AT resistance may differ markedly depending on the underlying cause, it is important to establish whether AT inflammation is linked to adipose insulin resistance with regard to lipolysis in humans.
In adults with obesity and insulin resistance with regard to glucose metabolism, the capacity of insulin to suppress lipolysis is reduced (AT insulin resistance) (6). This results in excess circulating free fatty acids (FFA), which can cause insulin resistance in muscle and liver (7,8). AT insulin resistance can be quantified directly with measurement of the insulin concentration that suppresses lipolysis by 50% (IC50). We have demonstrated that IC50 calculated using a single-step euglycemic-hyperinsulinemic clamp correlates well with other measures of AT insulin sensitivity (9). Our hypothesis was that AT inflammation would be the best predictor of AT insulin resistance as measured by IC50.
Most attention on AT inflammation has focused on proinflammatory macrophages (3,10,11). However, AT preadipocyte senescence can trigger inflammation and recruitment of proinflammatory macrophages into AT (12). In animal models, AT senescent cells promote inflammation, AT dysfunction, and insulin resistance (13). Proinflammatory cytokines, which can be secreted by adipocytes, senescent cells, and immune cells, are thought to be important causes of AT insulin resistance (14,15). However, the relationship between AT senescent cells and tissue dysfunction in vivo in humans has not been tested.
The few in vivo human studies that have evaluated the effect of weight loss on adipose inflammation have yielded conflicting results (16,17). If weight loss improves AT inflammation and insulin resistance in a coordinate fashion, this would provide stronger evidence for a cause-and-effect relationship. However, we did not find studies where investigators attempted to link AT inflammation with AT insulin resistance in vivo. We conducted the studies here because current evidence does not yet support a causal role for AT inflammation in the development of AT dysfunction in humans. We aimed to 1) test for a relationship between AT insulin resistance (quantified as IC50) and AT macrophage (ATM) content, AT senescence, and AT cytokine expression after accounting for fat cell size (FCS) and 2) evaluate whether AT insulin resistance and inflammation improve concordantly after lifestyle-induced weight loss.
Research Design and Methods
Subjects
These studies were approved by the Mayo Clinic Institutional Review Board, and informed written consent was obtained from all volunteers.
To include participants with a wide range of body composition and AT insulin resistance for study 1, we recruited 36 volunteers with obesity (BMI 30–37 kg/m2, 8 male and 28 female) and 6 male and 6 female normal weight (NW) (BMI 20–25 kg/m2) volunteers. Additional inclusion criteria were age 18–55 years and stable weight for 2 months before the start of the study. Exclusion criteria were a history of diabetes, cardiovascular disease or known systemic inflammatory (infectious, autoimmune) illness, and use of medications known to affect FFA or AT metabolism (β-blockers, niacin, pioglitazone, etc.). Women who were postmenopausal or perimenopausal were excluded.
Study 2 represents a confirmation cohort created to ensure we did not miss an association between AT inflammation and AT insulin resistance with regard to lipolysis. To do this we modified the study design for a separate concurrent protocol to include adipose biopsies; that protocol had identical inclusion and exclusion criteria. This allowed us to collect data on an additional 24 volunteers with obesity (10 male and 14 female) and 14 NW (6 male and 8 female) volunteers.
Study Protocol
As part of the initial screening for both studies we performed blood tests to assess the participants’ eligibility. Body composition (body fat, fat-free mass [FFM], leg fat, upper-body subcutaneous and visceral fat) was measured with DEXA and single slice computed tomography of the abdomen at the L2–3 interspace (18). Some study 1 participants (N = 32) and all participants in study 2 performed an exercise bicycle test to measure peak VO2. Volunteers were asked to taper off caffeine-containing beverages for 1 week prior to the study to avoid caffeine withdrawal headaches during the insulin clamp studies. All participants consumed an isoenergetic diet (weight stable, 45% carbohydrate, 20% protein, and 35% fat) from the Mayo Clinic Clinical Research and Trials Unit (CRTU) metabolic kitchen for 3 days prior to the study to ensure consistency of energy intake and nutrient composition.
Study 1
The evening prior to studies the participants were admitted to the CRTU at 1700 h, completed an evening meal by 1830 h, and fasted (except for water) for the remainder of the study. The next morning an intravenous catheter was placed in a retrograde fashion in the hand for blood sampling and another was placed in a forearm vein for infusions. Arterialized venous blood samples were collected using the hot box technique (19). At 0700 h an infusion of [U-13C]palmitate (∼300 nmol/min) was initiated to trace FFA kinetics. Blood samples were collected at 10-min intervals between 0830 and 0900 h to measure plasma insulin concentrations and steady-state plasma palmitate concentration and enrichment. The volunteers then underwent abdominal and femoral AT biopsies with small liposuction cannula after infiltration of the tissue with diluted local anesthetic; the samples were used for measurement of FCS and AT inflammation markers. This was followed by a primed, constant infusion of insulin (1 mU ⋅ kg−1 ⋅ min−1) together with an infusion of 50% dextrose to maintain euglycemia (∼5.0 mmol/L). Between 90 and 120 min after the insulin infusion began, blood samples were obtained for measurement of plasma insulin and palmitate concentrations, as well as palmitate enrichment. The participants were then provided with lunch and were discharged from the CRTU.
After completing the baseline study, volunteers with obesity started a comprehensive lifestyle intervention with the goal of achieving a weight loss of ∼10%. They met periodically with the investigators for individualized and group counseling for nutrition and physical activity. The 6-month weight loss program was based on the Look AHEAD (Action for Health in Diabetes) trial (20). Those participants who successfully completed the weight loss program (N = 25) underwent a repeat study identical to that described above.
Study 2
The evening prior to the study was identical to study 1. The next morning intravenous catheters were placed for blood sampling and infusions as described for study 1. At 0400 h an infusion of [U-13C]palmitate (∼330 nmol/min) was initiated to trace FFA kinetics. Blood samples and AT biopsy were obtained between 0830 and 0900 h as in study 1. Thereafter, a primed, constant infusion of insulin (1 mU ⋅ kg−1 ⋅ min−1) was initiated together with an infusion of 50% dextrose to maintain euglycemia (∼5.0 mmol/L). An infusion of [9-2H]palmitate (∼400 nmol/min) was used to trace FFA kinetics during the insulin clamp. Blood samples were collected between 270 and 300 min after the insulin clamp started for measurement of plasma palmitate enrichment, plasma insulin, and palmitate concentrations.
Palmitate Kinetics and IC50
We calculated steady-state palmitate flux (µmol/min) by dividing the [U-13C]palmitate or [2H9]palmitate infusion rate by steady-state plasma enrichment as previously described (21). Then, the insulin concentration that results in 50% suppression of lipolysis for each volunteer (IC50 [µIU/mL]) was calculated for each participant as previously described (9).
AT Biopsies
AT samples (∼1–3 g from each depot) were rinsed of blood and aliquoted for measures of FCS, senescence-associated β-galactosidase (SA-β-gal) staining, and formalin fixation for immunohistochemistry (Supplementary Material). Separate aliquots were snap frozen in liquid nitrogen and stored at −80°C for later analysis for mRNA. FCS was measured as previously described (22).
Immunohistochemical Quantification of ATM Content
ATM content was quantified as previously described (23). Briefly, paraffin-embedded slide sections were stained with a total macrophage and monocyte marker antibody, anti-CD68; a proinflammatory macrophage marker, anti-CD14; and an anti-inflammatory macrophage marker antibody, anti-CD206. Adipocytes and ATM were counted with AMC counter (Supplementary Material).
Quantification of Senescent Cells in AT
Although there is no “gold standard” marker for senescence, we previously found a positive correlation between SA-β-gal activity and p16INK4A, two markers used for AT senescence (24). Therefore, we used SA-β-gal staining to identify senescent cells in this study (25). Nucleated cells positive for SA-β-gal activity were identified with fluorescent microscopy as previously described (24).
mRNA Cytokine Expression
RNA was isolated from AT with use of the RNeasy Lipid Tissue mini kit. The isolated RNA was reverse transcribed followed by RT-PCR. Details on the kits and assays used can be found in Supplementary Material.
Statistics
Because we did not use a glucose tracer for all of these studies, we estimated insulin sensitivity with respect to glucose metabolism by dividing the steady-state glucose infusion rate at the end of the insulin clamp (milligrams per kilogram of FFM) by the increase in plasma insulin concentrations from basal values. This approach provides an estimate of overall insulin sensitivity (combined suppression of glucose production and stimulation of glucose uptake). Data were analyzed with JMP 14.0 (SAS) and are expressed as mean (95% CI) or median (interquartile range [IQR]). When possible, non–normally distributed data were logarithmically transformed to achieve a normal distribution. Independent-samples t test or Mann-Whitney U test was used to test for differences between individuals with obesity and NW. Wilcoxon signed rank test for matched pairs was used to test for differences before and after weight loss. Pearson correlation coefficient (r) was used to evaluate the association between inflammatory markers and IC50. For determination of the predictors of AT insulin resistance (IC50), linear regression analysis was performed; residuals were normally distributed and plotted against predicted values to check assumptions.
For comparisons between NW and obese and the effect of weight loss a P value <0.05 was considered statistically significant. For the association between inflammatory markers and IC50, a P value <0.05 was also considered statistically significant for the predefined primary end points: 1) association between IC50 and FCS, 2) the association between IC50 and total (CD68) and proinflammatory (CD14) ATM content (unadjusted and adjusted for FCS), 3) the association between IC50 and senescent cell content (unadjusted and adjusted for FCS), and 4) the association between IC50 and inflammatory cytokine gene expression (IL-6 and TNF-α) (unadjusted and adjusted for FCS). All other association analyses were secondary end points, and a P value <0.01 was considered statistically significant to reduce the risk of type 1 errors due to multiple comparison testing.
Data and Resource Availability
No applicable resources were generated or analyzed during the current study.
Results
Subject Characteristics
The study 1 cohort comprised 48 participants (71% females, 94% Caucasian), median age 39 years (IQR 27–45). The study 2 cohort comprised 38 participants (58% females, 95% Caucasian), with a median age of 31 years (IQR 25–41). Baseline characteristics of the two study cohorts are presented in Table 1.
Table 1.
Subject characteristics
| Baseline characteristics | Study 1 | Study 2 | ||||
|---|---|---|---|---|---|---|
| NW, N = 12 | Obese, N = 36 | P | NW, N = 14 | Obese, N = 24 | P | |
| Female sex, n (%) | 6 (50) | 28 (82) | 0.14 | 8 (57) | 14 (58) | 0.94 |
| Age, years | 44 (28–50) | 38 (26–44) | 0.37 | 28 (25–34) | 35 (25–42) | 0.26 |
| BMI (kg/m2) | 23.7 (22.5–24.6) | 33.6 (32.0–35.0) | 23.0 (22.2–24.6) | 32.9 (31.1–34.5) | ||
| Visceral fat (kg) | 1.6 (1.1–2.6) | 4.2 (2.5–6.4) | <0.001 | 1.2 (0.9–1.6) | 4.9 (2.9–6.3) | <0.001 |
| Visceral fat (%)† | 9.3 (5.3–12.2) | 10.6 (6.2–14.8) | 0.76 | 8.3 (4.9–10.3) | 12.7 (7.3–19.0) | 0.008 |
| Fasting plasma glucose (mg/dL) | 89 (84–92) | 89 (85–94) | 0.77 | 85 (82–90) | 91 (86–95) | <0.01 |
| Total cholesterol (mg/dL) | 179 (157–195) | 182 (170–213) | 0.19 | 181 (143–202) | 179 (153–202) | 0.84 |
| HDL-C (mg/dL) | 70 (54–82) | 51 (44–59) | <0.01 | 62 (52–67) | 41 (36–61) | <0.01 |
| Triglycerides (mg/dL) | 60 (50–89) | 94 (77–133) | <0.01 | 78 (48–86) | 131 (82–195) | <0.001 |
| Abdominal FCS, µg lipid/cell | 0.40 (0.28–0.49) | 0.77 (0.64–0.99) | <0.001 | 0.46 (0.30–0.56) | 0.94 (0.69–1.18) | <0.001 |
| Abdominal FCS, diameter (µm)‡ | 89.5 (80.5–95.5) | 113.4 (107.2–123.6) | <0.001 | 93.0 (83.1–98.1) | 117.8 (107.5–129.2) | <0.001 |
| Femoral FCS (µg lipid/cell) | 0.59 (0.51–0.73) | 0.97 (0.82–1.15) | <0.001 | |||
| Femoral FCS, diameter (µm)‡ | 102 (93.5–110.5) | 122.5 (115.2–128.8) | <0.001 | |||
| Si (mg ⋅ kg FFM−1 ⋅ min−1) | 0.22 (0.13–0.25) | 0.12 (0.08–0.16) | 0.008 | 0.31 (0.28–0.38) | 0.13 (0.11–0.18) | <0.001 |
| IC50 (µIU/mL) | 9.6 (8.2–17.8) | 24.5 (18.3–34.1) | <0.001 | 14.8 (13.1–27.4) | 34.9 (24.8–65.2) | <0.001 |
Continuous variables are expressed as median (IQR). HDL-C, HDL cholesterol; Si, glucose infusion rate over the last 30 min of the insulin clamp adjusted for the increase in plasma insulin concentration. Because obese and NW participants were selected for BMI, this is not a random variable and therefore not subject to statistical testing.
Corresponds to the percentage of visceral fat of all total body fat.
FCS expressed as adipocyte diameter in µm.
Baseline Adipose Insulin Sensitivity
As measured by IC50 (Table 1), volunteers with obesity were more AT insulin resistant than NW volunteers for both cohorts.
AT Inflammation
The abdominal, but not femoral, content of CD68, CD14, and CD 206 ATM/100 adipocytes was greater in obese than NW for the study 1 cohort (Table 2). When expressed as ATM per milligrams of tissue, abdominal CD206 ATM content was greater in the NW than obese group, but there were no differences in CD68 or CD14 ATM content. In contrast, femoral CD68 and CD206 ATM per milligrams of tissue were greater in the NW than the obese group, with a similar trend for CD14 ATM per milligrams of tissue (P = 0.08).
Table 2.
AT inflammatory markers
| Study 1 | Study 2 | |||||
|---|---|---|---|---|---|---|
| NW, N = 12 | Obese, N = 36 | P | NW, N = 14 | Obese, N = 24 | P | |
| Macrophages in abdominal AT (ATM per 100 adipocytes) | ||||||
| CD68 | 7.7 (6.5–8.0) | 12.9 (9.3–16.3) | <0.001 | 6.8 (5.6–8.5) | 13.2 (11.4–16.8) | <0.001 |
| CD14 | 1.2 (0.7–3.0) | 4.1 (2.1–7.5) | <0.01 | 1.3(0.2–2.4) | 2.9 (2.3–3.9) | 0.06 |
| CD206 | 9.2 (7.4–10.3) | 12.6 (10.2–16.4) | <0.001 | 8.0 (4.8–9.3) | 15.5 (11.9–16.9) | <0.001 |
| Macrophages in abdominal AT (ATM per milligrams of tissue) | ||||||
| CD68 | 130 (101–192) | 126 (96–126) | 0.54 | 109 (78–143) | 126 (84–152) | 0.46 |
| CD14 | 21.3 (16.0–55.0) | 37.6 (22.7–69.5) | 0.37 | 16.5 (7.9–37.4) | 23.8 (17.5–33.7) | 0.35 |
| CD206 | 174 (131–191) | 123 (106–144) | 0.02 | 122 (74–144) | 125 (96–175) | 0.23 |
| Macrophages in femoral AT (ATM per 100 adipocytes) | ||||||
| CD68 | 11.9 (10.0–15.2) | 14.8 (10.8–20.6) | 0.29 | |||
| CD14 | 4.2 (2.4–8.5) | 4.4 (2.9–8.0) | 0.72 | |||
| CD206 | 12.4 (9.5–17.5) | 14.1 (12.2–18.5) | 0.35 | |||
| Macrophages in femoral AT (ATM per milligrams of tissue) | ||||||
| CD68 | 154 (124–202) | 112 (78–169) | 0.04 | |||
| CD14 | 43.6 (28.4–104.7) | 33.7 (19.7–58.6) | 0.08 | |||
| CD206 | 176 (125–184) | 113 (86–142) | 0.01 | |||
| Cytokine mRNA expression in abdominal AT | ||||||
| IL-6 | 0.006 (0.005–0.009) | 0.013 (0.008–0.022) | <0.01 | |||
| TNF-α | 0.280 (0.157–0.502) | 0.489 (0.369–0.639) | 0.02 | |||
| IL-1β | 0.085 (0.073–0.122) | 0.117 (0.091–0.182) | 0.10 | |||
| IL-10 | 0.141 (0.084–0.252) | 0.285 (0.184–0.476) | 0.01 | |||
| Cytokine mRNA expression in femoral AT | ||||||
| IL-6 | 0.009 (0.007–0.016) | 0.011 (0.009–0.019) | 0.38 | |||
| TNF-α | 0.409 (0.294–0.541) | 0.664 (0.513–0.834) | 0.004 | |||
| IL-1β | 0.165 (0.069–0.356) | 0.148 (0.102–0.223) | 0.98 | |||
| IL-10 | 0.243 (0.106–0.489) | 0.411 (0.331–0.483) | 0.09 | |||
| Senescent cells in AT (per 100 nucleated cells) | ||||||
| Abdominal depot | 1.0 (0.6–1.6) | 1.9 (0.9–3.9) | 0.11 | 0.4 (0.2–1.7) | 1.8 (0.9–2.5) | 0.01 |
| Femoral depot | 2.5 (1.1–2.9) | 3.4 (2.2–4.7) | 0.06 | |||
Data are median (IQR).
Differences in abdominal ATM between obese and NW groups in study cohort 2 were similar to those in study 1 (Table 2). CD68, CD206, and CD14 (P = 0.06) ATM content was greater in the obese than NW group when expressed per 100 adipocytes but not when expressed per milligrams of tissue.
The difference in the proportion of senescent cells in the abdominal depot between the obese and NW groups in study 1 did not reach statistical significance, whereas it was significantly greater in the group with obesity than in the NW group for study 2. Cellular senescence in the femoral depot tended (P = 0.06) to be greater in the obese group than in the NW group in study 1 (Table 2).
Cytokine gene expression was measured in AT samples from study 1; expression of IL-6, TNF-α, and IL-10 in abdominal fat was greater in the group of volunteers with obesity, whereas in the femoral depot only TNF-α expression was greater in those with obesity (Table 2).
Baseline FCS Versus AT Insulin Sensitivity
There was a strong positive relationship between abdominal FCS and IC50 (Fig. 1A); the relationship between femoral FCS and IC50 was also significant for study 1 (Fig. 1B). Therefore, we analyzed the relationship between IC50 and inflammatory markers both unadjusted and adjusted for FCS.
Figure 1.
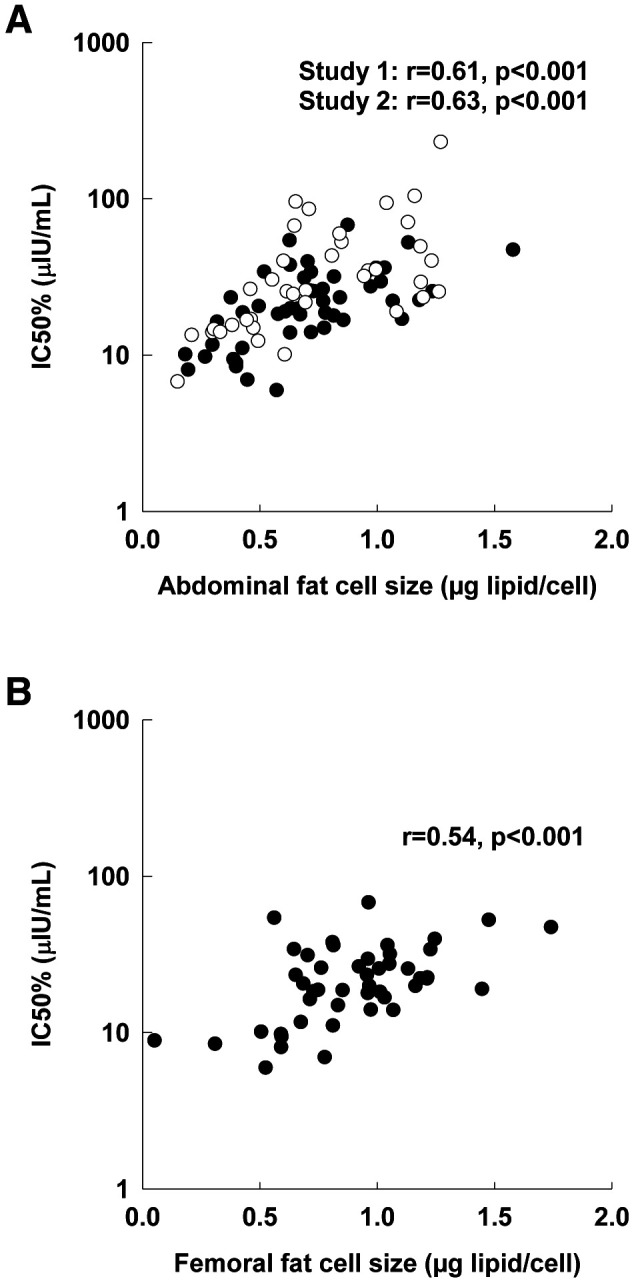
Association between IC50 and FCS. A: Abdominal fat. B: Femoral fat. Associations evaluated by Pearson correlation coefficient (r). Closed circles, study 1; open circles, study 2.
AT Macrophage Content Versus AT Insulin Sensitivity
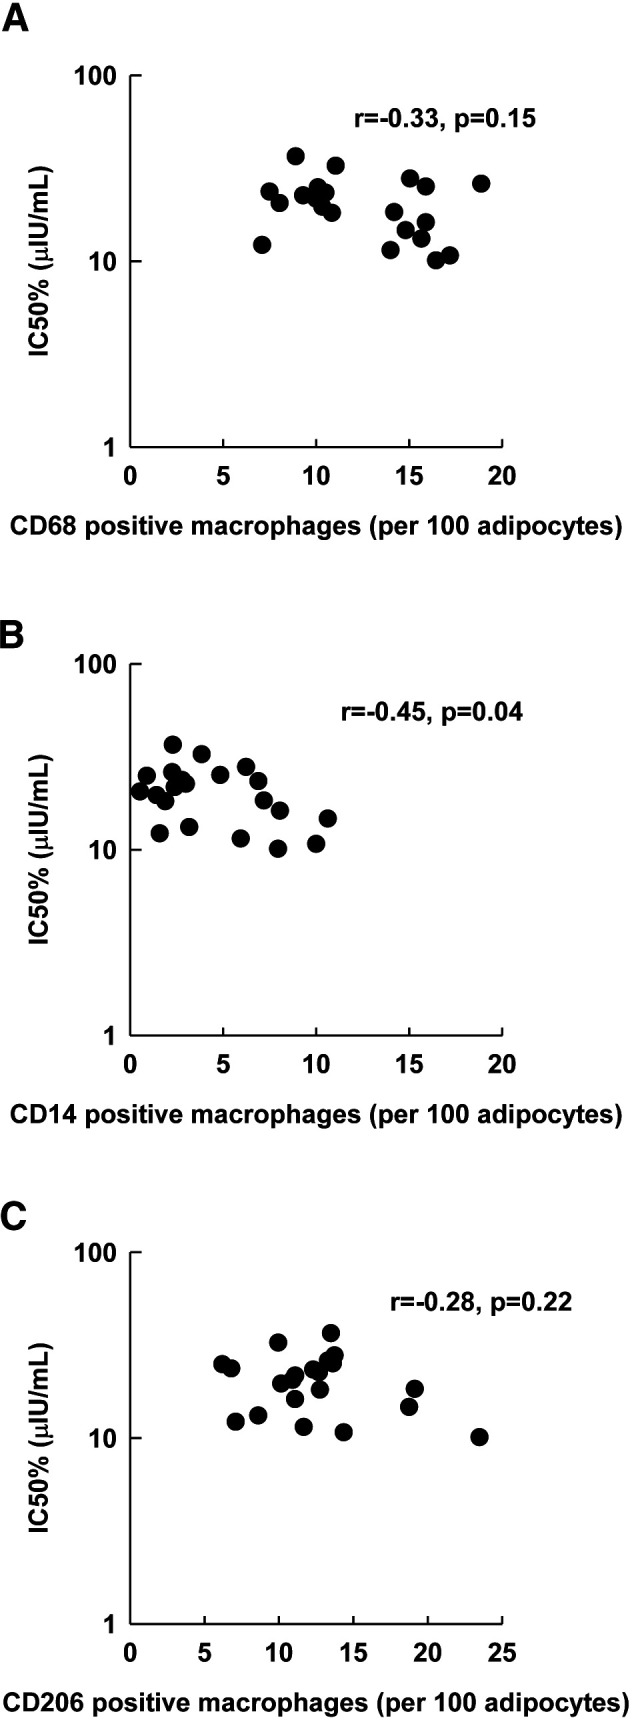
There were positive associations between the content of CD68, CD14, and CD206 ATM per 100 abdominal adipocytes and IC50 for both studies (Fig. 2); the association between abdominal CD68 ATM and IC50 for study 2 did not reach statistical significance (P = 0.06). In contrast, IC50 was not correlated with ATM content per milligrams of abdominal tissue (Fig. 2).
Figure 2.

Association between IC50 and abdominal ATM content expressed per 100 adipocytes and per milligrams of AT. A: Total ATM content (CD68) per 100 adipocytes. B: Total ATM content (CD68) per milligrams of tissue. C: Proinflammatory ATM content (CD14) per 100 adipocytes. D: Proinflammatory ATM content (CD14) per milligrams of tissue. E: Anti-inflammatory ATM content (CD206) per 100 adipocytes. F: Anti-inflammatory ATM content (CD206) per milligrams of tissue. Associations evaluated by Pearson correlation coefficient (r). Closed circles, study 1; open circles, study 2.
There was no association between IC50 and femoral AT content of CD68 and CD14 ATM but there was a positive correlation between IC50 and CD206 ATM per 100 adipocytes (Table 3). The relationships between IC50 and abdominal or femoral ATM per 100 adipocytes were not statistically significant after adjustment for FCS (Table 3).
Table 3.
Relationship between IC50 and AT inflammatory markers
| Study 1 (N = 48) | Study 2 (N = 38) | |||||||
|---|---|---|---|---|---|---|---|---|
| IC50 r | P | Adjusted P* | P † | IC50 r | P | Adjusted P* | P † | |
| Inflammatory markers | ||||||||
| Macrophages in abdominal fat depot (ATM per 100 adipocytes) | ||||||||
| CD68 | 0.33 | 0.02 | 0.87 | 0.91 | 0.36 | 0.06 | 0.68 | 0.13 |
| CD14 | 0.30 | 0.04 | 0.46 | 0.48 | 0.50 | 0.007 | 0.24 | 0.16 |
| CD206 | 0.51 | <0.001 | 0.34 | 0.36 | 0.50 | 0.007 | 0.24 | 0.18 |
| Macrophages in abdominal fat depot (ATM per milligrams of tissue) | ||||||||
| CD68 | −0.21 | 0.17 | 0.77 | 0.79 | −0.15 | 0.42 | 0.57 | 0.13 |
| CD14 | −0.02 | 0.88 | 0.29 | 0.29 | 0.15 | 0.53 | 0.27 | 0.24 |
| CD206 | −0.26 | 0.08 | 0.95 | 0.97 | −0.03 | 0.84 | 0.25 | 0.32 |
| Macrophages in femoral fat depot (ATM per 100 adipocytes) | ||||||||
| CD68 | 0.29 | 0.07 | 0.68 | 0.49 | ||||
| CD14 | 0.17 | 0.29 | 0.73 | 0.73 | ||||
| CD206 | 0.37 | 0.02 | 0.17 | 0.19 | ||||
| Macrophages in femoral fat depot (ATM per milligrams of tissue) | ||||||||
| CD68 | −0.20 | 0.22 | 0.94 | 0.87 | ||||
| CD14 | −0.11 | 0.38 | 0.54 | 0.54 | ||||
| CD206 | −0.19 | 0.25 | 0.40 | 0.43 | ||||
| Cytokines in abdominal fat depot | ||||||||
| IL-6 | 0.37 | 0.04 | 0.34 | 0.38 | ||||
| TNF-α | 0.44 | 0.01 | 0.38 | 0.37 | ||||
| IL-1β | 0.40 | 0.02 | 0.72 | 0.61 | ||||
| IL-10 | 0.43 | 0.01 | 0.12 | 0.13 | ||||
| Cytokines in femoral fat depot | ||||||||
| IL-6 | −0.12 | 0.50 | 0.47 | 0.49 | ||||
| TNF-α | 0.45 | 0.007 | 0.002 | 0.002 | ||||
| IL-1β | 0.26 | 0.14 | 0.02 | 0.02 | ||||
| IL-10 | 0.33 | 0.05 | 0.07 | 0.07 | ||||
| SA-β-gal staining cells (%) | ||||||||
| Abdominal depot | 0.36 | 0.03 | 0.45 | 0.37 | 0.29 | 0.28 | 0.68 | 0.37 |
| Femoral depot | 0.36 | 0.03 | 0.10 | 0.04 | ||||
Analysis adjusted for FCS.
Analysis adjusted for FCS and sex with multiple linear regression. P value <0.05 was considered statistically significant for the predefined primary end points: association between IC50 and FCS, association between IC50 and total (CD68) and proinflammatory (CD14) ATM content, the association between IC50 and senescent cell content, and association between IC50 and inflammatory cytokine gene expression (IL-6 and TNF-α). P value <0.01 was considered statistically significant for the association between IC50 and anti-inflammatory (CD206) ATM content, between IC50 and IL-1β, and between IC50 and IL-10.
Senescent Cells in AT Versus AT Insulin Sensitivity and Age
We found significant correlations between IC50 and abdominal and femoral AT senescent cell burden in study 1 but no correlation in study 2. The relationship between IC50 and AT senescence in study 1 was not significant after adjustment for FCS (Table 3). There was no relationship between age and abdominal (R2 = 0.02, adjusted P = 0.36) or femoral (R2 = 0.02, adjusted P = 0.14) senescence.
Cytokine Gene Expression Versus AT Insulin Sensitivity
There were positive correlations between cytokine gene expression and IC50 (Table 3). However, the relationships between abdominal AT cytokine expression and IC50 were not statistically significant after adjustment for FCS (Table 3). There was a positive correlation between IC50 and femoral expression of TNF-α (r = 0.45, adjusted P < 0.01) but no correlation between IC50 and IL-6 (r = −0.12, P = 0.49), IL-1β (r = 0.25, P = 0.14), and IL-10 (r = 0.32, P = 0.05), both in the univariate analysis and after adjustment for FCS (Table 3).
The relationships between IC50 and inflammatory markers did not change when we accounted for peak VO2 (for study 2) and sex (analyzed for study 1 and study 2) using multivariate regression models (Supplementary Table 1 and Table 3).
Effects of Weight Loss on IC50 and AT Inflammatory Markers
Twenty-five of the volunteers with obesity (BMI 33.7 kg/m2 [IQR 32–35], 72% women) participated in a 6-month comprehensive lifestyle weight loss program. They achieved a median weight loss of 10.2% (IQR 6.4–12.2). Changes in body composition, IC50, and markers of AT inflammation are provided in Table 4. There were significant reductions in percent body fat, visceral fat, and FCS. There was no difference in absolute weight loss between males and females, but males had a greater reduction in visceral fat (mean ± SD −2.0 ± 0.9 vs. −0.8 ± 0.8 kg, respectively, P = 0.01). IC50 decreased by 6 ± 13 µIU/mL (P = 0.02) after weight loss.
Table 4.
Pre– and post–weight loss body composition, IC50, and inflammatory markers
| Baseline median (IQR) | Change after weight loss (post–weight loss − pre–weight loss) (mean ± SD) | P * | |
|---|---|---|---|
| Weight | 97.3 (92.2–106.0) | −9.4 ± 5.0 | <0.001 |
| BMI (kg/m2) | 34 (32–35) | −3.1 ± 1.5 | <0.001 |
| Total body fat (%) | 44.7 (39.8–46.2) | −4.0 ± 3.1 | <0.001 |
| Visceral fat (kg) | 4.4 (2.7–6.8) | −1.2 ± 0.9 | <0.001 |
| Visceral fat (%) | 11.3 (6.1–15.9) | −1.07 ± 1.78 | 0.009 |
| Abdominal FCS (µg lipid/cell) | 0.77 (0.65–1.02) | −0.23 ± 0.24 | <0.001 |
| Abdominal FCS, diameter (µm) | 113.9 (107.1–124.9) | −13.0 ± 13.0 | <0.001 |
| Femoral FCS (µg lipid/cell) | 0.97 (0.84–1.14) | −0.26 ± 0.23 | <0.001 |
| Femoral FCS, diameter (µm) | 123 (115.5–128.5 | 13.2 ± 11.9 | <0.001 |
| Si (mg glucose infused ⋅ kg FFM−1 ⋅ min−1) | 0.12 (0.07–0.16) | 0.03 ± 0.06 | 0.02 |
| IC50 (µIU/mL) | 23.3 (19.0–32.9) | −6.2 ± 13.1 | 0.02 |
| Abdominal subcutaneous fat (N = 21) | |||
| CD68 ATM per milligrams of tissue | 130.3 (97.9–161.8) | 25.8 ± 79.9 | 0.14 |
| CD14 ATM per milligrams of tissue | 55.4 (27.8–69.9) | 5.8 ± 46.0 | 0.70 |
| CD206 ATM per milligrams of tissue | 131.8 (113.4–154.0) | 18.4 ± 67.4 | 0.24 |
| CD68 ATM per 100 adipocytes | 12.9 (9.6–15.8) | −0.73 ± 5.80 | 0.51 |
| CD14 ATM per 100 adipocytes | 4.8 (2.9–7.4) | −1.01 ± 2.73 | 0.15 |
| CD206 ATM per 100 adipocytes | 12.2 (10.2–15.4) | −1.44 ± 4.76 | 0.08 |
| Senescent cells (%) | 2.5 (1.1–4.0) | −0.8 ± 2.3 | 0.09 |
| Femoral subcutaneous fat (N = 18) | |||
| CD68 ATM per milligrams of tissue | 98.2 (78.3–147.4) | 85.4 ± 79.8 | <0.001 |
| CD14 ATM per milligrams of tissue | 33.9 (29.2–54.6) | 29.5 ± 44 | 0.02 |
| CD206 ATM per milligrams of tissue | 107.9 (89.2–124.0) | 59.4 ± 58.9 | <0.001 |
| CD68 ATM per 100 adipocytes | 12.4 (9.2–18.2) | 4.54 ± 7.08 | 0.01 |
| CD14 ATM per 100 adipocytes | 4.6 (3.2–7.6) | 1.34 ± 4.08 | 0.16 |
| CD206 ATM per 100 adipocytes | 13.7 (12.3–18.3) | 1.93 ± 5.42 | 0.07 |
| Senescent cells (%) (N = 21) | 3.4 (2.2–5.3) | −0.5 ± 1.7 | 0.16 |
Values are n = 25 unless otherwise noted. Si, insulin sensitivity with respect to glucose metabolism. Wilcoxon signed rank test for matched pairs used to test for differences before and after weight loss.
P value <0.05 was considered statistically significant.
In contrast to the improvement in AT insulin sensitivity after weight loss, there were no statistically significant changes in ATM content of abdominal subcutaneous fat. In the femoral depot the ATM per milligrams of tissue increased significantly (Table 4).
The relationships between IC50 and abdominal (r = −0.02, P = 0.94) or femoral (r = −0.14, P = 0.52) FCS was no longer present after weight loss. Likewise, the univariate associations between IC50 and ATM per 100 adipocytes were no longer apparent, and in fact trended in the opposite direction, including a significant negative correlation between IC50 and abdominal CD14 (r = −0.45, P = 0.04) (Fig. 3B).
Figure 3.
Associations between IC50 and abdominal ATM content after weight loss. A: Total ATM content (CD68). B: Proinflammatory ATM content (CD14). C: Anti-inflammatory ATM content (CD206). Associations evaluated by Pearson correlation coefficient (r).
A similar pattern was observed in the relationship between post–weight loss IC50 and ATM per milligrams of tissue. IC50 was negatively correlated with abdominal CD68 (r = −0.57, P < 0.01), CD14 (r = −0.56, P < 0.01), and CD206 (r = −0.53, P = 0.01) ATM per milligrams of tissue. We also found negative correlations between IC50 and femoral CD68 (r = −0.55, P = 0.01) and CD14 (r = −0.50, P = 0.03) ATM per milligrams of tissue.
AT senescent cell burden did not change significantly after weight loss (Table 4) and was not related to IC50 after weight loss (abdominal r = 0.27, P = 0.13; femoral r = 0.20, P = 0.39).
Baseline FCS Versus Insulin Sensitivity With Respect to Glucose Metabolism
We estimated insulin sensitivity with respect to glucose metabolism by dividing the final steady-state glucose infusion rate needed to maintain euglycemia by the increase in plasma insulin concentrations in response to the insulin infusion rate (Si). For both study 1 (r = −0.46, P = 0.001) and study 2 (r = −0.66, P < 0.001) there were negative relationships between Si and abdominal FCS (Fig. 4).
Figure 4.

Association between insulin sensitivity with respect to glucose metabolism (Si) and abdominal FCS.
Discussion
We investigated the link between AT inflammation and AT insulin resistance with regard to lipolysis. By measuring adipose macrophage burden, AT senescent cell burden, and inflammatory cytokine gene expression, we gained a more comprehensive index of AT inflammation. The relationships between markers of AT inflammation and AT insulin sensitivity as measured by IC50 were tested with use of data from two large cohorts of volunteers with a wide range of body composition. Furthermore, we assessed the effects of weight loss in insulin-resistant volunteers with obesity to test whether changes in AT inflammation would predict changes in AT insulin sensitivity. We found that IC50 was not correlated with senescent cell burden or total, proinflammatory, or anti-inflammatory ATM content when we accounted for the confounding variable of FCS. Although proinflammatory cytokine mRNA expression was associated with IC50, most of the associations were no longer statistically significant after adjustment for FCS. After a ∼10% weight loss that improved adipose lipolysis insulin sensitivity by ∼26%, there were no associations between any of the markers of AT inflammation and IC50.
The IC50 is a measure of adipose insulin sensitivity at the whole-body level (6), but the whole-body response is the sum of contributions from different adipose depots (26–28). A portion of FFA that are released from visceral AT lipolysis enter the systemic circulation after escaping uptake by the liver (29). While it is possible that those volunteers with an elevated IC50 had greater splanchnic release of FFA into the systemic circulation due to visceral AT inflammation and insulin resistance, our past studies suggest that this cannot account for much of the increased IC50 observed in obesity. We found that the vast majority of insulin-suppressed FFA release comes from upper-body subcutaneous AT under postprandial (26) and insulin clamp (27,28) conditions. Furthermore, our finding of strong associations between subcutaneous adipocyte size and IC50 is difficult to reconcile with the hypothesis that inflammation in visceral fat contributes to whole-body AT insulin resistance with regard to FFA release. We suggest that measures of subcutaneous AT morphology and inflammation are the appropriate metrics when it comes to understanding whole-body insulin resistance with regard to AT lipolysis.
Animal studies suggest that AT macrophages play an important role in the development of insulin resistance (30–32). There are much less data from human studies (17,33). We recently reported that the relationship between ATM burden and serum cytokine concentrations is confounded by adipocyte size and body composition (34). The initial goal of that project was to define “normal” ATM in humans. To that end, we analyzed what data we had available at the time for ATM, fasting glucose, insulin, and plasma lipid concentrations from studies conducted in our laboratory, including many of the volunteers participating in this study. In that report we used matching strategies for FCS and ATM to create groups discordant for each variable. Our conclusion was that ATM do not predict HOMA of insulin resistance, plasma TNF and IL-6, or dyslipidemia in humans (34). Subsequent to that publication we completed the analysis of plasma palmitate enrichment data from these studies; this allowed us to calculate IC50 and address the specific question of whether AT insulin resistance with respect to AT lipolysis is related to subcutaneous AT inflammation. Our data demonstrate that FCS, not ATM, is related to adipose insulin resistance with respect to systemic lipolysis in humans. The finding that an average 10% weight loss significantly improved AT insulin sensitivity without a reduction in ATM content further supports this conclusion. Indeed, the proinflammatory ATM content was inversely related to AT insulin resistance after weight loss. The lack of any relationship between AT inflammation and IC50 is strong evidence that ATM do not cause adipose insulin resistance with regard to lipolysis in adults without diabetes up to class II obesity.
The AT immune response to weight loss is a dynamic and heterogeneous process (35–37). Investigators have suggested that changes in ATM content and their subpopulations vary according to the degree and phase of weight loss. Humans losing ≥15% of body weight following bariatric surgery had fewer total and proinflammatory ATM (16,38). Similarly, diet-induced weight loss of 11–16% body weight reduced AT inflammation, but 5% weight loss did not reduce inflammatory or macrophage markers despite improvement in insulin sensitivity (17). The heterogeneous AT immune response after weight loss is further demonstrated by the finding that, 1 year after bariatric surgery with significant weight loss, omental ATM content decreased in only one-half of the patients (35–37). Subcutaneous ATM and gene expression of macrophage markers were upregulated after weight loss induced with 4 weeks of a very-low-calorie diet in women with obesity, followed by reduction in these parameters during a 6-month weight stabilization/maintenance period (39,40). Therefore, it is possible that ATM response in our study would have been different if the weight loss or weight maintenance phase was longer. We found no change in abdominal ATM after 6 months of 10% weight loss followed by 2 weeks of weight maintenance, whereas there were increases in femoral ATM. Of interest, there were some negative associations between ATM and IC50 after weight loss. Some investigators suggests that adipose macrophages are required for adequate adipose remodeling (41), and the increase in femoral ATM we observed following weight loss could be part of the AT remodeling response rather than inflammation per se.
AT cellular senescence is increased in obesity (13,42). In rodents, senescent cells secrete inflammatory cytokines and growth factors that recruit inflammatory cells that can lead to insulin resistance (43). Senolytic agents that reduce senescence burden in tissues reduce inflammation and also improve insulin sensitivity in AT of obese mice (44). However, a link between AT senescence and AT insulin resistance in humans has not been examined. We found that adults with obesity had more senescent cells in the abdominal (study 2) and femoral (study 1) depots than the NW adults, but after the effects of FCS on AT insulin resistance were accounted for, there was no relationship between senescent cells and insulin resistance. Rouault et al. (45) studied severely obese adults undergoing bariatric surgery and found a positive association between abdominal SC senescence, AT inflammatory markers, and systemic insulin resistance. Given our findings in volunteers with class I and II obesity, this suggests that AT senescence and inflammation may have a more prominent role in humans with class III obesity. Furthermore, in our study, AT senescent cell burden did not change after weight loss. We conclude that although AT senescence is increased in human obesity, it is not related to insulin resistance with regard to lipolysis.
Both ATM and senescent cells secrete proinflammatory cytokines TNF-α, IL-1β, and IL-6, which have been linked to AT insulin resistance (14,46). These cytokines interfere with insulin signaling in animal and in vitro studies of human adipocytes (14,47–49). Because there was no association between abdominal AT TNF-α, IL-1β, and IL-6 expression and IC50 after adjustment for FCS, it is difficult to posit that local cytokines are responsible for AT insulin resistance in humans with obesity.
Subcutaneous FCS is strongly correlated with whole-body insulin resistance in humans with and without obesity (50,51). Herein we report for the first time that FCS is the best predictor of IC50 over a wide range of body composition. Analyzing the associations between inflammatory markers (ATM, cytokine mRNA expression, senescent cells) and insulin resistance in isolation may cause investigators to overlook the confounding variables of fatness and FCS. Thus, it is crucial to study large numbers of volunteers with a wide range of body fat and include comprehensive measures of adipose morphology and inflammation to understand the independent predictors of AT insulin resistance.
The lack of positive relationship between ATM or senescence and IC50 persisted, and indeed worsened, after weight loss. We suggest that, under weight stable conditions, factors linked to FCS are more important as the cause of AT insulin resistance than inflammation. None of the factors examined here predicted the reduction of IC50 and increased AT insulin sensitivity after weight loss, suggesting that we need to explore other factors that regulate lipolysis in future studies.
Strengths and Limitations
The major strength of our study is the direct measurement of AT insulin sensitivity with regard to lipolysis using state-of-the-art tracer methods in two large cohorts across a wide range of body weight and body composition. We used IC50 as our measure of AT insulin resistance because it accounts for both the large interindividual differences in fasting insulin concentrations and those achieved during an insulin clamp. This allowed us to evaluate the relationship between markers of AT inflammation and AT insulin resistance directly rather than surrogate markers of AT insulin resistance. We also were able to address whether AT insulin resistance was related to ATM burden expressed per 100 adipocytes and per milligrams of tissue, which is an important consideration because FCS varies tremendously between individuals (34). Another important strength is the evaluation of the relationship between markers of AT inflammation and insulin resistance after weight loss, an intervention that improved AT insulin sensitivity. However, our study has some limitations. First, we measured ATM content—not function. It is possible that the ATM secretory profile of cells studied differs in a manner that might account for AT insulin resistance. However, if this were true, we would expect the mRNA expression to capture this phenomenon. Second, we did not measure inflammation in visceral AT. However, visceral AT only contributes with a small proportion of circulating FFA (26,27) and therefore plays only a small role in whole-body AT insulin sensitivity. Third, we did not include those with class III obesity, and many rodent models of obesity are double the weight of control animals. It is possible that inflammation plays a more significant role in AT dysfunction in class III obesity. Moreover, because we had gene expression data for only three participants after weight loss, we were unable to test whether our intervention changes these AT cytokine markers. Further mechanistic studies of adipocyte insulin action will be needed to clarify the mechanism(s) responsible for adipose insulin resistance with regard to lipolysis.
In conclusion, none of the markers of subcutaneous adipose inflammation can be independently linked to adipose insulin resistance in humans. Instead, FCS is the best predictor of AT insulin resistance with regard to lipolysis. After moderate weight loss, improvement of insulin sensitivity is not related to reductions in ATM or cellular senescence. We suggest that the lipolysis machinery in humans with increased FCS may be a more fruitful area of investigation than studies of ATM-mediated inflammation.
Article Information
Funding. These studies were supported by National Center for Research Resources grant 1UL1RR024150 and National Institutes of Health grants DK45343, DK40484, and 5T32 DK007352.
The content is solely the responsibility of the authors and does not necessarily represent the official views of the National Institutes of Health. These studies were begun before registration on ClinicalTrials.gov was required.
Duality of Interest. No potential conflicts of interest relevant to this article were reported.
Author Contributions. A.E.E.D.Y., E.S., D.A.D., B.G.C.L., and M.D.J. designed the studies. A.E.E.D.Y., E.S., M.M.-B., K.L., D.A.D., and B.G.C.L. conducted the studies. A.E.E.D.Y., E.S., M.M.-B., and P.R. acquired data. A.E.E.D.Y., E.S., and M.D.J. performed the analysis and interpretation of the data. A.E.E.D.Y., E.S., and M.D.J. wrote the manuscript, and all authors made a critical review and read and approved the final manuscript. M.D.J. is the guarantor of this work and, as such, had full access to all the data in the study and takes responsibility for the integrity of the data and the accuracy of the data analysis.
Footnotes
A.E.E.D.Y. and E.S. contributed equally to the study.
This article contains supplementary material online at https://doi.org/10.2337/figshare.17064371.
References
- 1. Haase J, Weyer U, Immig K, et al. Local proliferation of macrophages in adipose tissue during obesity-induced inflammation. Diabetologia 2014;57:562–571 [DOI] [PubMed] [Google Scholar]
- 2. McNelis JC, Olefsky JM. Macrophages, immunity, and metabolic disease. Immunity 2014;41:36–48 [DOI] [PubMed] [Google Scholar]
- 3. Vieira-Potter VJ. Inflammation and macrophage modulation in adipose tissues. Cell Microbiol 2014;16:1484–1492 [DOI] [PubMed] [Google Scholar]
- 4. Chawla A, Nguyen KD, Goh YP. Macrophage-mediated inflammation in metabolic disease. Nat Rev Immunol 2011;11:738–749 [DOI] [PMC free article] [PubMed] [Google Scholar]
- 5. Shimobayashi M, Albert V, Woelnerhanssen B, et al. Insulin resistance causes inflammation in adipose tissue. J Clin Invest 2018;128:1538–1550 [DOI] [PMC free article] [PubMed] [Google Scholar]
- 6. Jensen MD, Nielsen S. Insulin dose response analysis of free fatty acid kinetics. Metabolism 2007;56:68–76 [DOI] [PubMed] [Google Scholar]
- 7. Ferrannini E, Barrett EJ, Bevilacqua S, DeFronzo RA. Effect of fatty acids on glucose production and utilization in man. J Clin Invest 1983;72:1737–1747 [DOI] [PMC free article] [PubMed] [Google Scholar]
- 8. Shulman GI. Ectopic fat in insulin resistance, dyslipidemia, and cardiometabolic disease. N Engl J Med 2014;371:1131–1141 [DOI] [PubMed] [Google Scholar]
- 9. Søndergaard E, Espinosa De Ycaza AE, Morgan-Bathke M, Jensen MD. How to measure adipose tissue insulin sensitivity. J Clin Endocrinol Metab 2017;102:1193–1199 [DOI] [PMC free article] [PubMed] [Google Scholar]
- 10. Weisberg SP, McCann D, Desai M, Rosenbaum M, Leibel RL, Ferrante AW Jr. Obesity is associated with macrophage accumulation in adipose tissue. J Clin Invest 2003;112:1796–1808 [DOI] [PMC free article] [PubMed] [Google Scholar]
- 11. Wentworth JM, Naselli G, Brown WA, et al. Pro-inflammatory CD11c+CD206+ adipose tissue macrophages are associated with insulin resistance in human obesity. Diabetes 2010;59:1648–1656 [DOI] [PMC free article] [PubMed] [Google Scholar]
- 12. Kirkland JL, Tchkonia T, Pirtskhalava T, Han J, Karagiannides I. Adipogenesis and aging: does aging make fat go MAD? Exp Gerontol 2002;37:757–767 [DOI] [PubMed] [Google Scholar]
- 13. Tchkonia T, Morbeck DE, Von Zglinicki T, et al. Fat tissue, aging, and cellular senescence. Aging Cell 2010;9:667–684 [DOI] [PMC free article] [PubMed] [Google Scholar]
- 14. Fève B, Bastard JP. The role of interleukins in insulin resistance and type 2 diabetes mellitus. Nat Rev Endocrinol 2009;5:305–311 [DOI] [PubMed] [Google Scholar]
- 15. Zatterale F, Longo M, Naderi J, et al. Chronic adipose tissue inflammation linking obesity to insulin resistance and type 2 diabetes. Front Physiol 2020;10:1607. [DOI] [PMC free article] [PubMed] [Google Scholar]
- 16. Cancello R, Henegar C, Viguerie N, et al. Reduction of macrophage infiltration and chemoattractant gene expression changes in white adipose tissue of morbidly obese subjects after surgery-induced weight loss. Diabetes 2005;54:2277–2286 [DOI] [PubMed] [Google Scholar]
- 17. Magkos F, Fraterrigo G, Yoshino J, et al. Effects of moderate and subsequent progressive weight loss on metabolic function and adipose tissue biology in humans with obesity. Cell Metab 2016;23:591–601 [DOI] [PMC free article] [PubMed] [Google Scholar]
- 18. Jensen MD, Kanaley JA, Reed JE, Sheedy PF. Measurement of abdominal and visceral fat with computed tomography and dual-energy x-ray absorptiometry. Am J Clin Nutr 1995;61:274–278 [DOI] [PubMed] [Google Scholar]
- 19. Heiling VJ, Miles JM, Jensen MD. How valid are isotopic measurements of fatty acid oxidation? Am J Physiol 1991;261:E572–E577 [DOI] [PubMed] [Google Scholar]
- 20. Ryan DH, Espeland MA, Foster GD, et al.; Look AHEAD Research Group . Look AHEAD (Action for Health in Diabetes): design and methods for a clinical trial of weight loss for the prevention of cardiovascular disease in type 2 diabetes. Control Clin Trials 2003;24:610–628 [DOI] [PubMed] [Google Scholar]
- 21. Persson X-MT, Blachnio-Zabielska AU, Jensen MD. Rapid measurement of plasma free fatty acid concentration and isotopic enrichment using LC/MS. J Lipid Res 2010;51:2761–2765 [DOI] [PMC free article] [PubMed] [Google Scholar]
- 22. Tchoukalova YD, Harteneck DA, Karwoski RA, Tarara J, Jensen MD. A quick, reliable, and automated method for fat cell sizing. J Lipid Res 2003;44:1795–1801 [DOI] [PubMed] [Google Scholar]
- 23. Morgan-Bathke M, Harteneck D, Jaeger P, et al. Comparison of methods for analyzing human adipose tissue macrophage content. Obesity (Silver Spring) 2017;25:2100–2107 [DOI] [PMC free article] [PubMed] [Google Scholar]
- 24. Espinosa De Ycaza AE, Søndergaard E, Morgan-Bathke M, et al. Senescent cells in human adipose tissue: a cross-sectional study. Obesity (Silver Spring) 2021;29:1320–1327 [DOI] [PMC free article] [PubMed] [Google Scholar]
- 25. Dimri GP, Lee X, Basile G, et al. A biomarker that identifies senescent human cells in culture and in aging skin in vivo. Proc Natl Acad Sci U S A 1995;92:9363–9367 [DOI] [PMC free article] [PubMed] [Google Scholar]
- 26. Guo Z, Hensrud DD, Johnson CM, Jensen MD. Regional postprandial fatty acid metabolism in different obesity phenotypes. Diabetes 1999;48:1586–1592 [DOI] [PubMed] [Google Scholar]
- 27. Basu A, Basu R, Shah P, Vella A, Rizza RA, Jensen MD. Systemic and regional free fatty acid metabolism in type 2 diabetes. Am J Physiol Endocrinol Metab 2001;280:E1000–E1006 [DOI] [PubMed] [Google Scholar]
- 28. Meek SE, Nair KS, Jensen MD. Insulin regulation of regional free fatty acid metabolism. Diabetes 1999;48:10–14 [DOI] [PubMed] [Google Scholar]
- 29. Nielsen S, Guo Z, Johnson CM, Hensrud DD, Jensen MD. Splanchnic lipolysis in human obesity. J Clin Invest 2004;113:1582–1588 [DOI] [PMC free article] [PubMed] [Google Scholar]
- 30. Dalmas E, Toubal A, Alzaid F, et al. Irf5 deficiency in macrophages promotes beneficial adipose tissue expansion and insulin sensitivity during obesity. Nat Med 2015;21:610–618 [DOI] [PubMed] [Google Scholar]
- 31. Wang N, Tan HY, Li S, et al. SBP2 deficiency in adipose tissue macrophages drives insulin resistance in obesity. Sci Adv 2019;5:eaav0198. [DOI] [PMC free article] [PubMed] [Google Scholar]
- 32. Xu H, Barnes GT, Yang Q, et al. Chronic inflammation in fat plays a crucial role in the development of obesity-related insulin resistance. J Clin Invest 2003;112:1821–1830 [DOI] [PMC free article] [PubMed] [Google Scholar]
- 33. Fjeldborg K, Pedersen SB, Møller HJ, Christiansen T, Bennetzen M, Richelsen B. Human adipose tissue macrophages are enhanced but changed to an anti-inflammatory profile in obesity. J Immunol Res 2014;2014:309548. [DOI] [PMC free article] [PubMed] [Google Scholar]
- 34. Jia Q, Morgan-Bathke ME, Jensen MD. Adipose tissue macrophage burden, systemic inflammation, and insulin resistance. Am J Physiol Endocrinol Metab 2020;319:E254–E264 [DOI] [PMC free article] [PubMed] [Google Scholar]
- 35. Liu Y, Aron-Wisnewsky J, Marcelin G, et al. Accumulation and changes in composition of collagens in subcutaneous adipose tissue after bariatric surgery. J Clin Endocrinol Metab 2016;101:293–304 [DOI] [PubMed] [Google Scholar]
- 36. van Baak MA, Mariman ECM. Mechanisms of weight regain after weight loss - the role of adipose tissue. Nat Rev Endocrinol 2019;15:274–287 [DOI] [PubMed] [Google Scholar]
- 37. Schmitz J, Evers N, Awazawa M, et al. Obesogenic memory can confer long-term increases in adipose tissue but not liver inflammation and insulin resistance after weight loss. Mol Metab 2016;5:328–339 [DOI] [PMC free article] [PubMed] [Google Scholar]
- 38. Aron-Wisnewsky J, Tordjman J, Poitou C, et al. Human adipose tissue macrophages: m1 and m2 cell surface markers in subcutaneous and omental depots and after weight loss. J Clin Endocrinol Metab 2009;94:4619–4623 [DOI] [PubMed] [Google Scholar]
- 39. Capel F, Klimcáková E, Viguerie N, et al. Macrophages and adipocytes in human obesity: adipose tissue gene expression and insulin sensitivity during calorie restriction and weight stabilization. Diabetes 2009;58:1558–1567 [DOI] [PMC free article] [PubMed] [Google Scholar]
- 40. Kováčiková M, Sengenes C, Kováčová Z, et al. Dietary intervention-induced weight loss decreases macrophage content in adipose tissue of obese women. Int J Obes 2011;35:91–98 [DOI] [PubMed] [Google Scholar]
- 41. Wernstedt Asterholm I, Tao C, Morley TS, et al. Adipocyte inflammation is essential for healthy adipose tissue expansion and remodeling. Cell Metab 2014;20:103–118 [DOI] [PMC free article] [PubMed] [Google Scholar]
- 42. Schafer MJ, White TA, Evans G, et al. Exercise prevents diet-induced cellular senescence in adipose tissue. Diabetes 2016;65:1606–1615 [DOI] [PMC free article] [PubMed] [Google Scholar]
- 43. Minamino T, Orimo M, Shimizu I, et al. A crucial role for adipose tissue p53 in the regulation of insulin resistance. Nat Med 2009;15:1082–1087 [DOI] [PubMed] [Google Scholar]
- 44. Palmer AK, Xu M, Zhu Y, et al. Targeting senescent cells alleviates obesity-induced metabolic dysfunction. Aging Cell 2019;18:e12950. [DOI] [PMC free article] [PubMed] [Google Scholar]
- 45. Rouault C, Marcelin G, Adriouch S, et al. Senescence-associated β-galactosidase in subcutaneous adipose tissue associates with altered glycaemic status and truncal fat in severe obesity. Diabetologia 2021;64:240–254 [DOI] [PubMed] [Google Scholar]
- 46. Nguyen MT, Satoh H, Favelyukis S, et al. JNK and tumor necrosis factor-alpha mediate free fatty acid-induced insulin resistance in 3T3-L1 adipocytes. J Biol Chem 2005;280:35361–35371 [DOI] [PubMed] [Google Scholar]
- 47. Jager J, Grémeaux T, Cormont M, Le Marchand-Brustel Y, Tanti JF. Interleukin-1beta-induced insulin resistance in adipocytes through down-regulation of insulin receptor substrate-1 expression. Endocrinology 2007;148:241–251 [DOI] [PMC free article] [PubMed] [Google Scholar]
- 48. Kanety H, Feinstein R, Papa MZ, Hemi R, Karasik A. Tumor necrosis factor alpha-induced phosphorylation of insulin receptor substrate-1 (IRS-1). Possible mechanism for suppression of insulin-stimulated tyrosine phosphorylation of IRS-1. J Biol Chem 1995;270:23780–23784 [DOI] [PubMed] [Google Scholar]
- 49. Rotter V, Nagaev I, Smith U. Interleukin-6 (IL-6) induces insulin resistance in 3T3-L1 adipocytes and is, like IL-8 and tumor necrosis factor-alpha, overexpressed in human fat cells from insulin-resistant subjects. J Biol Chem 2003;278:45777–45784 [DOI] [PubMed] [Google Scholar]
- 50. Andersson DP, Eriksson Hogling D, Thorell A, et al. Changes in subcutaneous fat cell volume and insulin sensitivity after weight loss. Diabetes Care 2014;37:1831–1836 [DOI] [PubMed] [Google Scholar]
- 51. Hammarstedt A, Graham TE, Kahn BB. Adipose tissue dysregulation and reduced insulin sensitivity in non-obese individuals with enlarged abdominal adipose cells. Diabetol Metab Syndr 2012;4:42. [DOI] [PMC free article] [PubMed] [Google Scholar]