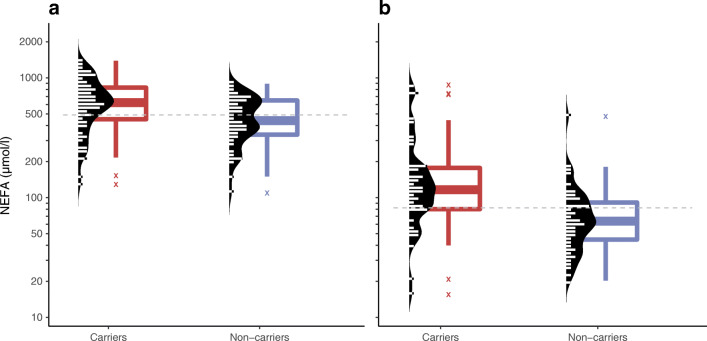
Fig. 3.
First measurements in adult age of NEFA at fasting (a) and at 120 min during an OGTT (b) in carriers and non-carriers of the HNF1A p.(Gly292fs) variant. Each observation is plotted by a short horizontal line (double width symbolises two samples with the same value, etc.); the dashed grey lines represent medians. Also, a sex- and age-adjusted log-transformed linear regression model implied lower NEFA levels among the carriers compared with the non-carriers both at fasting (p=0.00050) and at 120 min (p=2.2×10⁻⁷) after excluding the outliers marked with ‘X’. One non-carrier outlier with fasting NEFA >2000 μmol/l was excluded from the figure

