Abstract
Background
Although branched chain amino acid transaminase 1 (BCAT1) has been identified to play an essential role in multiple tumors, no studies on its role in pan‐cancer have been consulted before.
Methods
The study comprehensively analyzes the expression, potential mechanisms, and clinical significance of BCAT1 in pan‐cancer through utilizing 16,847 samples, providing novel clues for the treatment of cancers. A Kruskal–Wallis test and the Wilcoxon rank‐sum and signed‐rank tests were applied to investigate diverse BCAT1 expression between various groups (e.g., cancer tissues versus normal tissues). Spearman’s rank correlation coefficient was used in all correlation analyses in the study. Cox analyses and Kaplan‐Meier curves were utilized to identify the prognosis significance of BCAT1 expression in cancers. The significance of BCAT1 expression in differentiating cancer and non‐cancer tissues was explored via the area under the receiver operating characteristic curves (AUC).
Results
The differential expression of BCAT1 was detected in various cancers (p < 0.05), which is relevant to some DNA methyltransferases expression. BCAT1 expression was associated with mismatch repair gene expression, immune checkpoint inhibitors expression, microsatellite instability, and tumor mutational burden in some cancers, indicating its potential in immunotherapy. BCAT1 expression showed prognosis significance and played a risk role in multiple cancers (hazard ratio > 0, p < 0.05). BCAT1 expression also demonstrated conspicuous ability to distinguish some cancers tissues from their normal tissues (AUC > 0.7), indicating its potential to detect cancers. Further analyses on head and neck squamous cell carcinoma certified upregulated BCAT1 expression at both mRNA and protein levels in this disease based on in‐house tissue microarrays and multicenter datasets.
Conclusions
For the first time, the research comprehensively demonstrates the overexpression of BCAT1 in pan‐cancer, which improves the understanding of the pathogenesis of BCAT1 in pan‐cancer. Upregulated BCAT1 expression represented a poor prognosis for cancers patients, and it serves as a potential marker for cancer immunotherapy.
Keywords: cancer biology, cancer risk factors, immunology, prognosis, target therapy
For the first time, the research comprehensively demonstrates over‐expression of BCAT1 in pan‐cancer, which improves the understanding of the pathogenesis of BCAT1 in pan‐cancer. Upregulated BCAT1 expression represents poor prognosis of cancers patients, and it serves as a potential marker for cancer immunotherapy.

1. INTRODUCTION
Cancer is an increasingly significant and serious burden to human health, representing one of the most common causes of death. According to the predicted data for China, more than 4.6 million persons were diagnosed with cancer and more than 2.9 million patients would die in 2018. 1 Globally, there were estimated 19.3 million newly diagnosed cases and nearly 10.0 million deaths from various cancers in 2020. 2 With clinical care for cancers, such as multidisciplinary methods, including surgery, radiotherapy, chemotherapy, and targeted therapy, progression in treatment effects for some cancers is significant, such as melanoma and Hodgkin lymphoma. 3 However, the mortality rates in some cancers remain dismal, such as in pancreatic cancer, which has an estimated mortality rate almost equal to its predicted diagnosed cases in the same year. 2 In terms of the pathogenesis of cancers, the known risk factors include tobacco consumption, alcohol consumption, and obesity. 4 , 5 However, the pathogenesis of cancer is very complex and far from fully elucidated. Thus, it is necessary to explore the mechanism of cancer occurrence and progression to identify potential cancer‐related biomarkers for the treatment of cancer.
Branched chain amino acid transaminase 1 (BCAT1) is located at human chromosome 12p12.1. According to previous studies, it plays an important role in the development of tumors. BCAT1 has been identified as being highly expressed in a variety of cancers, such as gliomas, gastric cancer, and hepatocellular carcinoma, and has been frequently reported as a promoter in the occurrence and development of these cancers. 6 , 7 , 8 , 9 , 10 Moreover, in glioma, 11 prostate cancer, 12 and urothelial cancer, 13 it has been demonstrated that the prognosis of tumor patients with upregulated BCAT1 expression was poor. Nevertheless, the comprehensive potential mechanism and clinical significance of BCAT1 in pan‐cancer have not previously been reported, and more efforts are needed to address this lack.
In this study, for the first time, the expression, potential mechanism, and clinical significance of BCAT1 in pan‐cancer were explored based on data from multiple sources including the Genotype‐Tissue Expression (GTEx), Cancer Cell Line Encyclopedia (CCLE), The Cancer Genome Atlas (TCGA), and Gene Expression Omnibus (GEO) databases, as well as the published literature. Furthermore, we analyzed BCAT1 expression in head and neck squamous cell carcinoma (HNSCC) based on larger samples from in‐house tissue microarrays and public datasets. Overall, the research highlights an essential role of BCAT1 expression in pan‐cancer, providing a novel and potential therapeutic target for various cancers.
2. MATERIALS AND METHODS
2.1. BCAT1 expression data in pan‐cancer
GTEx 14 collects numerous normal tissues of homo sapiens, and this collection was applied to explore BCAT1 expression in 30 kinds of normal tissues in the study. CCLE 15 is a database feasible for accessing gene expression in multiple cell lines of cancers. For this purpose, CCLE data were collected for analyzing BCAT1 expression in cancers included in the TCGA dataset. On November 16, 2021, GTEx data (n of samples = 8671) and CCLE data (n of samples = 473) were downloaded from the GTEx Portal and DepMap Portal, respectively.
TCGA contains large samples of tumors and their normal samples, and the data of 32 cancers from the database were included in this study. Twenty of the 32 cancers from TCGA were identified with both cancer tissues and normal tissues, and thus data of the 20 cancers were utilized to analyze BCAT1 expression. The TCGA samples were obtained from the Xena database (constructed by the University of California, Santa Cruz) on November 16, 2021. Three types of samples (i.e., primary tumor, solid tissue normal, and primary blood‐derived cancer peripheral blood; n of cancers = 9054; n of controls = 727) from TCGA were included. The details of the 32 cancers are listed in Appendix S1.
2.2. DNA methyltransferases and BCAT1 mutations data
The expression levels of three typical DNA methyltransferases (DNMT1, DNMT3A, and DNMT3B) were obtained from the TCGA data. A BCAT1 mutations dataset, processed via MuTect2 software, 16 came from GDC Portal. A landscape of BCAT1 mutations in pan‐cancer was generated based on the dataset, and the process was completed using Sanger Box (v3.0).
2.3. Data of mismatch repair genes, immune checkpoint genes, microsatellite instability, tumor mutational burden, neoantigens count, and immune microenvironment
The expression levels of five mismatch repair (MMR) genes (MLH1, MSH2, MSH6, PMS2, and EPCAM) and 46 immune checkpoints (BTLA, etc.) were extracted from the TCGA data. Microsatellite instability (MSI), tumor mutational burden (TMB), and neoantigens count (containing single‐nucleotide variation and indel neoantigens) 17 data were obtained from the previous study by Liu et al. 18
The infiltration level data of six kinds of immune cells (B cells, CD4+ T cells, CD8+ T cells, neutrophils, macrophages, and dendritic cells) were downloaded from TIMER. 19 Three scores (immune score, stromal score, and ESTIMATE score) of the immune microenvironment were calculated via the ESTIMATE 20 algorithm.
2.4. Clinical correlation of BCAT1 in pan‐cancer
The clinical information of cancer patients was obtained from the Xena database and included clinical features and prognosis data. The correlations of BCAT1 expression with three clinical features—age, gender, and American Joint Committee on Cancer stage—were assessed using Wilcoxon tests.
Overall survival time (OST), disease‐specific survival time (DSST), disease‐free interval time (DFIT), and progression‐free interval time (PFIT) are common clinical indicators in evaluating patients’ prognoses. The criterion for censoring OST is death by any cause. DSST is identified when a patient dies of a specific disease. DFIT indicates a period without signs of cancer recurrence, while PFIT is a measure of time when patients live with diseases without worsening or advancement of the disease. Univariate Cox analysis was utilized to explore the relationship between BCAT1 expression and OST. For one cancer, when the p value of univariate Cox analysis was < 0.05, the relevance between BCAT1 expression and the OST of patients with this cancer was further analyzed through a Kaplan–Meier curve. Similar to OST, the correlations between BCAT1 expression and three prognosis signatures (DSST, DFIT, and PFIT) were investigated via univariate Cox analysis and Kaplan–Meier curves.
The significance of BCAT1 expression in differentiating cancer and non‐cancer tissues was explored via the area under the receiver operating characteristic curves (AUC). The greater the AUC value (ranging from 0 to 1), the more remarkable the ability of BCAT1 expression to differentiate cancer tissues from non‐cancer tissues, which implies BCAT1’s potential as a marker for cancer screening.
2.5. Further analyses of BCAT1 expression in HNSCC
To verify BCAT1 mRNA expression in HNSCC, multicenter microarrays were collected from the GEO database. The screening strategy was as follows: “(larynx OR mouth OR pharynx OR (Head and Neck Neoplasms)) AND (mRNA OR gene).” The inclusion criteria for the datasets were as follows: (1) the species was homo sapiens; (2) samples were from HNSCC tissue or HNSCC cell line; (3) each dataset included HNSCC samples or non‐HNSCC control samples; and (4) each dataset included BCAT1 expression profiling data. Exclusion criteria included the following: duplicate samples or incomplete data. A total of 44 microarray datasets were collected from GEO, containing HNSCC and 633 non‐HNSCC samples. After removing batch effects between diverse datasets using a surrogate variable analysis software package, 21 the samples were divided into four subgroups––laryngeal squamous cell carcinoma (LSCC), oral squamous cell carcinoma (OSCC), pharyngeal squamous cell carcinoma (PSCC), and unspecific site head and neck squamous cell carcinoma (USCC). The information of samples from the GEO database is provided in Appendix S2.
To investigate BCAT1 protein levels in HNSCC, an immunohistochemistry (IHC) experiment was performed based on five in‐house tissue microarrays (TOC481, ORC1021, HNT961, HNT962, and HNT1021), which contained 258 samples and was provided by Pantomics, Inc (Richmond, CA 94806). Similar to mRNA data, BCAT1 protein data were also classified into four types—LSCC, OSCC, PSCC, and USCC (all belonging to HNSCC). The clinical characteristics of the samples are shown in Appendix S3.
All steps of the IHC experiment were conducted according to the instructions of the manufacturer. The dewaxed and repaired tissue slides were placed in 0.01 M citrate buffer solution (pH = 6.0) to extract the antigen. The endogenous peroxidase was inactivated with 3% H2O2. The tissue slides were incubated overnight in the rabbit anti‐human BCAT1 monoclonal antibody (ab126762, ABCAM, UK; dilution 1:100) at 4°C, whereas the negative control slides were incubated overnight in a phosphate buffer. A second antibody‐labeled horseradish peroxidase (Changdao Biotechnology Co., Ltd., Shanghai, China) was added to the tissue slides, and the latter were then stored at room temperature (approximately 25℃) for 25 min and colored with 3,3’‐diaminobenzidine. The dehydrated and sealed slides were evaluated under a brightfield microscope. Positive staining appeared as brown particles in the nucleus and/or cytoplasm, whereas negative staining appeared as blue particles. All samples of the tissue microarrays were randomly selected from 10 regions to evaluate the positive cells; this was performed independently by two authors. The standard of the staining intensity score was as follows: integers 0–3 scores, for no staining, light staining, moderate staining, and strong staining, respectively; for positive cells, integers 0–4 scores, for <5%, 5%–25%, 26%–50%, 51%–75%, and >75%, respectively, of the positive cells of the visual field. The total IHC score was calculated as the product of the intensity score and the positive cells score, and the final total IHC score was the average of the two evaluations. Through the experiment and total IHC scores of the clinical samples, we attempted to analyze the difference in BCAT1 protein levels between the HNSCC and non‐HNSCC groups.
2.6. Statistical analysis
A Kruskal–Wallis test was utilized to explore the difference in BCAT1 expression between various normal human tissues from GTEx, and the same method was also used for cancer cell lines from CCLE. The Wilcoxon rank‐sum and signed‐rank tests were applied to investigate diverse BCAT1 expression between cancers and their normal tissues. Spearman's rank correlation coefficient was used in correlation analyses of BCAT1 expression with DNA methyltransferases expression, MMR genes expression, immune checkpoints expression, MSI, TMB, neoantigens, immune cell infiltration levels, and several immune‐related scores, and all correlation analyses were based on data of 32 cancers from TCGA.
The standardized mean difference (SMD) of the forest plot and Wilcoxon tests of violin plots were used to assess the difference in BCAT1 expression levels between the HNSCC group and the non‐HNSCC group. In calculating SMD, a fixed‐effects model was used when an I2 value of the I2 test was ≤50%; otherwise, a random‐effects model was applied. An SMD value greater than zero suggested upregulated BCAT1 expression in the HNSCC group, while a value less than zero represented low BCAT1 expression in HNSCC.
The result of SMD was statistically significant when the corresponding 95% confidence interval (CI) did not contain 0. Except for SMD, p < 0.05 indicated that the difference was statistically significant. The design of this study is shown in Figure 1. In the study, all figures containing statistical tests were generated via a series of software packages 22 , 23 , 24 in R (v4.1.0).
FIGURE 1.
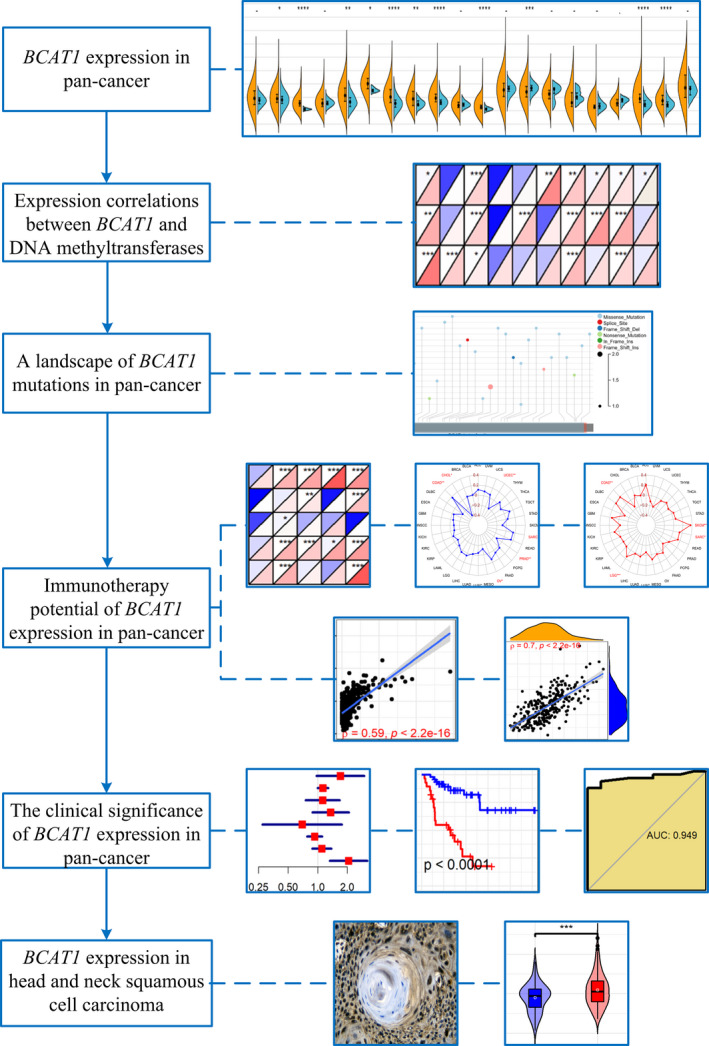
The design of this study
3. RESULTS
3.1. Upregulated BCAT1 expression in pan‐cancer
The expression of BCAT1 was diverse in various normal tissues (Figure 2A), and the same phenomenon was observed in the cell lines of 14 cancers (Figure 2B). Furthermore, compared to corresponding normal tissues, BCAT1 was differentially expressed in multiple cancer tissues based on TCGA data. Overexpression of BCAT1 was detected in 10 cancers, containing breast invasive carcinoma (BRCA), cholangiocarcinoma (CHOL), esophageal carcinoma (ESCA), glioblastoma multiforme, HNSCC, kidney chromophobe, kidney renal clear cell carcinoma (KIRC), liver hepatocellular carcinoma (LIHC), stomach adenocarcinoma (STAD), and thyroid carcinoma (THCA; Figure 2C). In contrast, low BCAT1 expression was observed in lung squamous cell carcinoma (LUSC; Figure 2C).
FIGURE 2.

BCAT1 expression in pan‐cancer and its correlations with DNA methyltransferases. BCAT1 expression in normal tissues (panel A), cancer cell lines (panel B), and pan‐cancer (panel C). Panel D: Correlations between BCAT1 expression with DNA methylation. For panel C: *p < 0.05, **p < 0.01, ***p < 0.001; p value was based on the Wilcoxon test
3.2. Expression correlation between BCAT1 and DNA methyltransferases, and the landscape of BCAT1 mutations
As a DNA chemical modification, DNA methylation can change genetic performance without affecting DNA sequence. 25 , 26 Significant correlations of BCAT1 expression with the three methyltransferases—DNMT1, DNMT3A, and DNMT3B—were detected in some cancers (Figure 2D). For BCAT1, the most common mutation in cancers was missense mutation, and not less than 2.5% of patients with colon adenocarcinoma (COAD) and rectum adenocarcinoma (READ) had observed mutations (Figure 3A).
FIGURE 3.
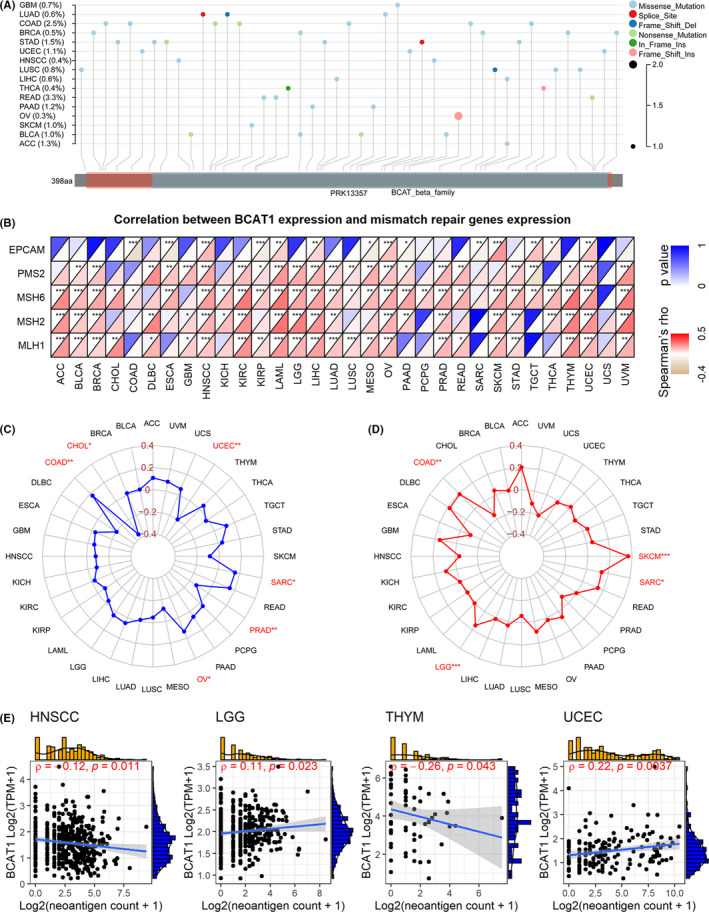
A landscape of BCAT1 mutations, and exploration of immunotherapy potential of BCAT1 expression in pan‐cancer. Spearman coefficient of BCAT1 expression with mismatch repair genes expression (panel B), microsatellite instability (panel C), tumor mutational burden (panel D), and neoantigens count (panel E). For panel A: Del, deletion; Ins, insertion
3.3. Expression relationship of BCAT1 with MMR and immune checkpoint genes expression
MMR is a repair mechanism of DNA mismatch. For cells, the dysfunction of MMR genes tends to cause difficulty in repairing DNA mismatch. As a result, the abnormal function of MMR genes can eventually lead to somatic mutations. MLH1, MSH2, MSH6, PMS2, and EPCAM are representative of MMR genes. 27 In our study, conspicuous positive associations between BCAT1 expression and the five MMR genes can be detected in quite a few cancers, particularly for HNSCC, acute myeloid leukemia, LIHC, ovarian serous cystadenocarcinoma (OV), and uterine corpus endometrial carcinoma (UCEC; Figure 3B).
Immune checkpoints are a class of immunosuppressive molecules. Tumor cells can inhibit the immune response by activating these molecules. 28 Interestingly, BCAT1 expression was associated with at least six immune checkpoint genes in 32 cancers, while all 46 immune checkpoint genes were detected as relevant to BCAT1 expression in at least eight cancers (Appendix S4).
3.4. Correlation of BCAT1 expression with MSI, TMB, neoantigens count, and immune microenvironment
The microsatellite is a short tandem repeat DNA sequence in the genome. A new microsatellite allele (compared to normal tissue) may occur when repeat units (resulting from MMR) are inserted or deleted at one or some microsatellite loci in tumor tissue, which is defined as MSI. 29 , 30 BCAT1 expression was positively related to MSI in COAD, OV, and sarcoma (SARC), while it was negatively related to CHOL, prostate adenocarcinoma, and UCEC (Figure 3C).
TMB is an indicator used to quantitatively evaluate the total number of mutations in tumor cells. BCAT1 expression was significantly and positively associated with TMB in four cancers, including COAD, brain lower grade glioma (LGG), SARC, and skin cutaneous melanoma (SKCM; Figure 3D).
Increasing mutations (e.g., single‐nucleotide mutations) represent more significant immunogenicity of the neoantigens encoded by cell mutant genes, 31 and the latter can activate and proliferate T cells through complex mechanisms. 32 Briefly, the presence of neoantigens on the surface of tumor cells helps the immune system recognize tumor cells. In our study, slight correlations between BCAT1 expression and neoantigen count were detected in thymoma and UCEC (Figure 3E).
HNSCC, LUSC, and READ were the three cancers (HNSCC was the top one) with the most conspicuous correlations between BCAT1 expression and infiltration levels of all six immune cells, particularly for dendritic and neutrophilic cells (Figure 4A). The most significant relationships between BCAT1 expression and stromal scores were detected in COAD, READ, and BLCA. In three cancers––COAD, READ, and HNSCC, BCAT1 expression showed the most conspicuous with immune scores; that for ESTIMATE scores were COAD, READ, and bladder urothelial carcinoma (BLCA; Figure 4B).
FIGURE 4.
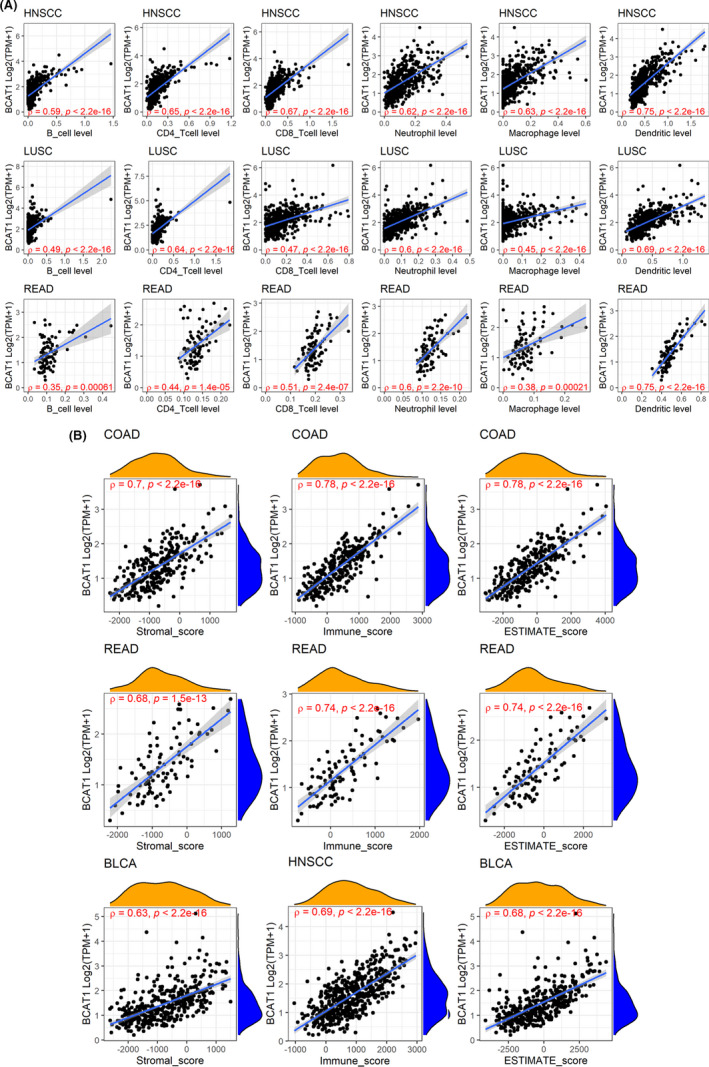
Relevance between BCAT1 expression with infiltration levels of all the six immune cells (panel A) and immune microenvironment scores (panel B). The letter “ρ” is followed by the Spearman correlation coefficient
3.5. Relationship between BCAT1 expression and clinical features
Tumor patients with distinct clinical features may have different prognoses, so we explored the correlation between BCAT1 expression and clinical features. In cancers with statistically significant results (p < 0.05), downregulated BCAT1 expression was detected in elderly patients (except for ESCA; Figure 5A) and males (except for SARC; Figure 5B). At the advanced stages (American Joint Committee on Cancer), BCAT1 demonstrated diverse expression levels in various cancers—increased levels in kidney renal papillary cell carcinoma, STAD, and testicular germ cell tumors; reduced levels in CHOL, lung adenocarcinoma, pancreatic adenocarcinoma (PAAD), SKCM, and THCA (Figure 5C), suggesting that BCAT1 may play different roles in these cancers.
FIGURE 5.
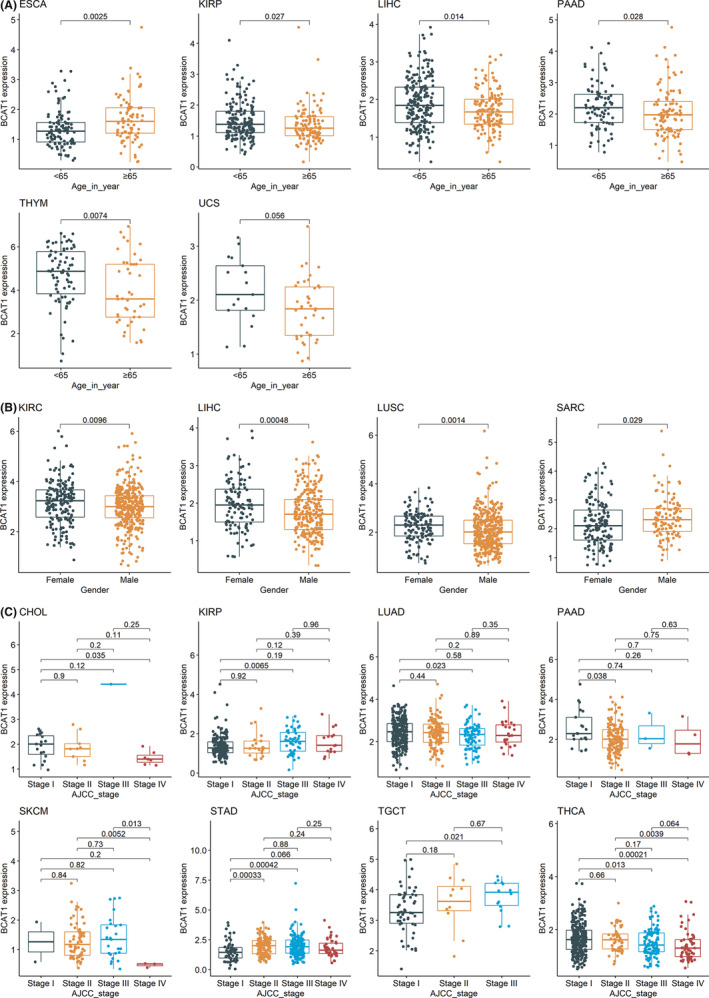
Associations of BCAT1 expression and patients’ clinical features. The figure shows the relevance of BCAT1 expression with age (panel A), gender (panel B), and AJCC (American Joint Committee on Cancer) stage (panel C) of cancer patients. p value was based on the Wilcoxon test
3.6. Clinical significance of BCAT1 expression in pan‐cancer
Little was understood about the clinical value of BCAT1 expression in multiple cancers, and thus we attempted to discuss the issue in our study. Through univariate Cox analysis, BCAT1 expression showed the risk factor of prognostic significance in eight cancers, containing adrenocortical carcinoma (ACC), BLCA, BRCA, KIRC, LGG, LIHC, PAAD, and uveal melanoma (UVM; Figure 6A). These results were verified using the Kaplan–Meier curves, where high BCAT1 expression represented shorter OST for patients with the eight cancers (Figure 6B). Relevance between high BCAT1 expression and shorter DSST can be observed in ACC, BLCA, BRCA, KIRC, LGG, LIHC, PAAD, SKCM, and UVM (Figure 6C,D). Upregulated BCAT1 expression indicated unfavorable DFIT for ACC and PAAD (Figure 7A,C). There was a similar association between BCAT1 expression and PFIT for patients with ACC, BRCA, KIRC, LGG, mesothelioma, PAAD, and UVM (Figure 7B,D). In contrast, BCAT1 expression tended to have a protective role for patients with OV in both DFIT and PFIT (Figure 7).
FIGURE 6.
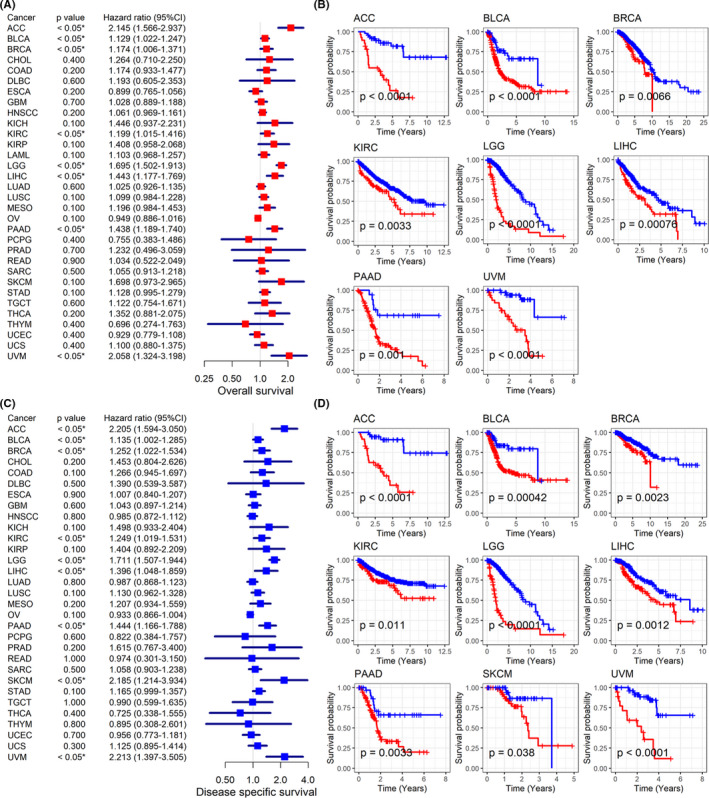
Relation of BCAT1 expression with overall survival and disease‐specific survival of cancers patients. Panels A–B: BCAT1 expression shows the risk factor for cancer patients (panel A) and it was related to the shorter overall survival time of cancer patients (panel B). Panels C–D: BCAT1 expression demonstrates the risk factor for cancer patients (panel C) and it was related to shorter disease‐specific survival time of cancers patients (panel D)
FIGURE 7.

Relation of BCAT1 expression with disease‐free survival and progression‐free survival of cancers patients. Panels A–B: BCAT1 expression demonstrates the risk factor for most cancer patients in both disease‐free survival (panel A) and progression‐free survival (panel B). Panels C–D: BCAT1 expression was related to shorter disease‐free survival time (panel C) and progression‐free survival time (panel D) of most cancer patients
AUC values were greater than 0.7 in 8/20 cancers (Figure 8), suggesting that BCAT1 expression demonstrated the conspicuous ability to distinguish these cancers tissues from their normal tissues. Particularly, the AUC of CHOL was up to 0.949 (Figure 8), indicating that BCAT1 made it feasible to identify CHOL and non‐CHOL.
FIGURE 8.
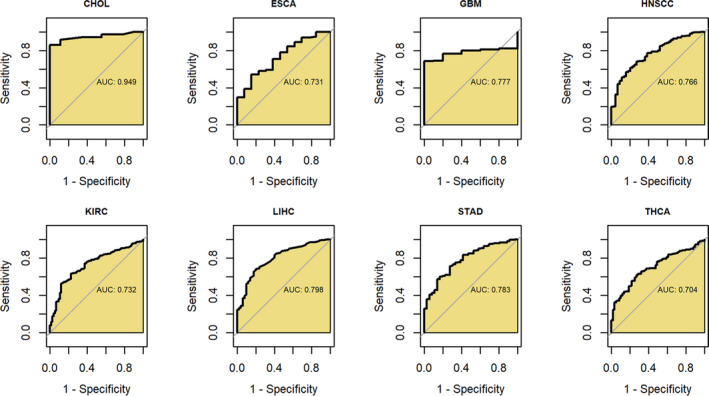
Receiver operating characteristic curves for detecting the ability of BCAT1 expression to distinguish these cancers tissues from their normal tissues. AUC, area under the receiver operating characteristic curve
3.7. BCAT1 expression in HNSCC
As mentioned above, differential expression was significant in pan‐cancer. Furthermore, using multicenter data, we also constructed a comprehensive study on the expression of BCAT1 in HNSCC. Based on multicenter data, upregulated BCAT1 mRNA expression was observed in HNSCC (SMD = 0.60, 95% CI [0.50–0.70]; Figure 9A). A similar conclusion can be drawn for LSCC, OSCC, PSCC, and USCC, with their SMDs >0 and corresponding 95% CIs >0 (Figure 9A). Results of Wilcoxon tests also supported increased BCAT1 mRNA expression in all four subgroups of HNSCC (Figure 9B). Through in‐house tissue microarrays, conspicuously positive BCAT1 protein staining was not detected in non‐HNSCC tissues (Figure 10A–D and Figure 10I–L) but in HNSCC tissues (Figure 10E–H,M–P), demonstrating high BCAT1 protein levels in HNSCC, which was confirmed using the Wilcoxon tests (Figure 10Q).
FIGURE 9.

Violin plots (panel A) and the forest plot (panel B) of BCAT1 expression in head and neck squamous cell carcinoma. LSCC: laryngeal squamous cell carcinoma; OSCC: oral squamous cell carcinoma; PSCC: pharyngeal squamous cell carcinoma; USCC: unspecific site head and neck squamous cell carcinoma. ** p value of the Wilcoxon test <0.01, *** p value of the Wilcoxon test <0.001
FIGURE 10.
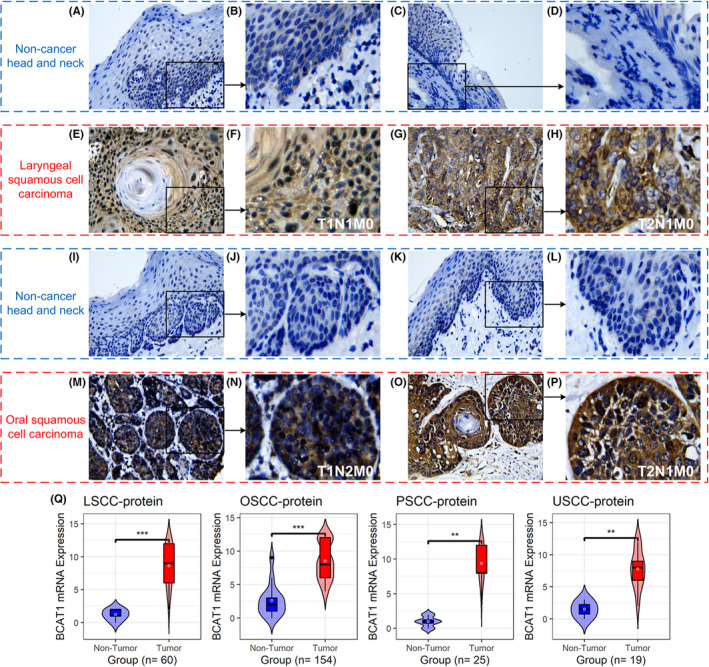
BCAT1 protein levels in tissues by in‐house tissue microarrays. Panels A–P: The protein levels of BCAT1 in head and neck squamous cell carcinoma tissues and their control tissues under the microscope. Panel Q: A violin plot of BCAT1 protein levels in head and neck squamous cell carcinoma tissues and their control tissues. ** p value of the Wilcoxon test <0.01, *** p value of the Wilcoxon test <0.001
4. DISCUSSION
Cancer is a serious threat to human health, and research on targeted treatment and immunotherapy is meaningful. BCAT1 encodes a transaminase of branched chain amino acids––valine, isoleucine, and leucine. Although BCAT1 has been identified as playing an important role in a variety of tumors, no studies on BCAT1 in pan‐cancer have previously been reported.
To the best of our knowledge, this is the first comprehensive analysis of the expression, potential mechanisms, and clinical significance of BCAT1 in pan‐cancer, using 16,847 samples, and provides novel clues for the treatment of cancers. Differential expression of BCAT1 was detected in various cancers, and it was relevant to some DNA methyltransferases expression, immune checkpoint genes expression, MMR genes expression, MSI, TMB, and neoantigens count in some cancers. BCAT1 expression showed significant prognosis and identification potential in multiple cancers. To some extent, further analyses of BCAT1 in HNSCC support some findings in pan‐cancer: upregulated BCAT1 expression (at both mRNA and protein levels) in HNSCC was identified based on in‐house tissue microarrays and datasets from various sources.
The differential expression of BCAT1 in cancers is common, and its elevated expression is predominant. Previously, high BCAT1 expression was reported in multiple cancers, such as ESCA, 26 gastric cancer, 7 ovarian cancer, 33 and non‐small cell lung cancer. 34 In our study, upregulated BCAT1 expression was identified in 10 cancers (e.g., BRCA), while decreased BCAT1 expression was detected in LUSC. Among these cancers, to the best of our knowledge, our study is the first to shed light on the diverse expression of BCAT1 in CHOL, kidney chromophobe, STAD, and thyroid carcinoma, suggesting the novelty of our research.
BCAT1 expression shows different correlations with DNA methyltransferases in diverse tumors. As one DNA chemical modification, DNA methylation can change genetic performance without affecting DNA sequence, where DNA methyltransferases involve. 25 Zeng et al. 26 identified that DNMT1 mediated the methylation of hsa‐miR‐124‐3p, subsequently contributing to the high expression of BCAT1 in ESCA, suggesting the correlation between BCAT1 differential expression and DNA methylation. In our research, BCAT1 expression was correlated with the three DNA methyltransferase genes––DNMT1, DNMT3A, and DNMT3B in some cancers. However, no previous reports about the relation of BCAT1 with DNMT3A and DNMT3B were found. Therefore, it is necessary to further explore this to understand whether the three methylation genes have a regulatory relationship with the upregulated expression of BCAT1.
The associations of BCAT1 expression with its mutations were found in some cancers, and dysregulated MMR genes may take part in BCAT1 mutations. Taking COAD as an example, it had the most BCAT1 mutations among the 32 cancers included in our study, and interestingly, BCAT1 expression was negatively relevant to the expression of an MMR gene––EPCAM. Although this requires further experimental confirmation, it may make sense with the fact that: MMR is the DNA replication repair mechanism of cells, critical to ensuring genomic integrity and stability, and the dysfunction of MMR causes the deletion of DNA replication repair, resulting in gene mutations. 35 However, more work must be carried out, focusing particularly on the relation of BCAT1 with its mutations and MMR; doing so may contribute to the understanding of dysregulated BCAT1 expression in pan‐cancer.
BCAT1 may have the potential as a therapeutic target for cancers. Immune checkpoint inhibitors help the body recover a normal antitumor immune response, which is considered to be an antitumor immunotherapy. High MSI and TMB were identified as biomarkers for immune checkpoint blockade therapy, suggesting their potential in immunotherapy. 36 , 37 TMB contributed to the increasing neoantigens count. With neoantigens, cancer cells tend to be recognized and cleared in the immune microenvironment, where many immune cells (particularly T cells) involve. 38 In our study, BCAT1 expression was found to be related to MSI, TMB, and immune checkpoint genes in several cancers (e.g., COAD and SARC). Although no conspicuous relevance was found between BCAT1 expression with neoantigens count, its remarkable correlation with the immune microenvironment was discovered in our study. For example, BCAT1 expression was dramatically and positively related to infiltration levels of neutrophil, dendritic cells, CD4 T cells, and CD8 T cells in some cancers (e.g., HNSCC). These cells are known to take part in innate immune response and/or adaptive immune response. 39 , 40 , 41 The close positive relevance of BCAT1 expression to several immune scores was also detected in pan‐cancer analyses. Taken together, BCAT1 is likely to be a tumor biomarker related to tumor immune cell infiltration, and it demonstrates the potential of immune treatment for multiple cancers.
BCAT1 expression showed conspicuous clinical significance in cancers. Previously, several studies have revealed the risk role of high expression of BCAT1 in the prognosis of patients with glioma, 11 prostate cancer, 12 urothelial cancer, 13 and HNSCC. 42 This scenario was observed in ACC, BLCA, BRCA, KIRC, LGG, LIHC, PAAD, and UVM via analysis of relevance between BCAT1 expression and OST. Furthermore, the high BCAT1 expression represents shorter DSST for patients with the eight cancers (ACC, etc.) and SKCM, clearly suggesting its risk roles in these cancers. As reported by Panosyan et al., 43 BCAT1 was related to the adverse outcomes of glioblastoma patients. Zheng et al. 10 identified the relationship between BCAT1 expression and poor prognosis for LIHC, resulting from the stimulation of epithelial–mesenchymal transition by BCAT1. 44 Interestingly, to the best of our knowledge, the current study is the first to reveal the prognostic significance of BCAT1 expression in ACC, BRCA, KIRC, PAAD, and UVM, suggesting the novelty of our research. Moreover, the relevance between high BCAT1 expression and shorter DFIT can be observed in ACC and PAAD, while the upregulated expression of BCAT1 was relevant to poor PFIT for patients with ACC, BRCA, KIRC, LGG, mesothelioma, PAAD, and UVM. The results revealed that BCAT1 expression represented unfavorable progression (e.g., recurrence) in patients with these cancers. Except for HNSCC, 45 , 46 no similar reports could thus far be found. Thus, the conspicuous and consistent risk factor of BCAT1 expression was identified in multiple cancers. Moreover, the study revealed the significance of BCAT1 expression in differentiating some cancers (e.g., CHOL) from their control tissues, and such a finding has not before been reported. Collectively, BCAT1 expression was possibly a marker for prognosis and identifying cancers.
We further analyzed BCAT1 in HNSCC. Elevated BCAT1 expression in HNSCC has been reported by Wang et al. 45 However, some limitations like limited samples (n < 380) can be seen in the study. Moreover, HNSCC is complex given its multiple sites sources; for instance, a gene may be upregulated in some subgroups but not in the other subtypes. 47 , 48 Through comprehensively investigating a large sample (n of public data = 1818, n of in‐house tissue microarrays = 258), our study demonstrated that BCAT1 was significantly highly expressed in HNSCC at both the mRNA and protein levels in all four subgroups of HNSCC—LSCC, OSCC, PSCC, and USCC. This suggests the trend of BCAT1 expression in HNSCC is consistent with the majority of tumors (ACC, etc.).
There are some limitations to the current research. For instance, we failed to collect enough body fluid samples to verify the expression of BCAT1 in pan‐cancer. In addition, further in vivo and in vitro experiments should be undertaken to investigate the mechanisms of BCAT1 in pan‐cancer. In‐house samples for multiple cancers (not only HNSCC) should be included in future studies.
For the first time, this study comprehensively demonstrates a high expression of BCAT1 in pan‐cancer, which improves the understanding of the pathogenesis of BCAT1 in pan‐cancer. Upregulated BCAT1 expression represents poor prognosis of cancers patients, and it serves as a potential marker for cancer immunotherapy.
ETHICAL APPROVAL STATEMENT
The study was approved by the Ethics Committee of the First Affiliated Hospital of Guangxi Medical University, China.
CONFLICT OF INTEREST
No potential competing interest was reported by the authors.
AUTHOR CONTRIBUTIONS
Guo‐Sheng Li, Gang Chen, and Lin‐Jie Yang contributed to the collection of funding. All authors contributed to conception and design, drafting, and critically revising the manuscript, and gave final approval to the version to be published.
Supporting information
Appendix S1
Appendix S2
Appendix S3
Appendix S4
ACKNOWLEDGMENTS
We thank Guangxi Key Laboratory of Medical Pathology for its technical support. The results shown in the study are in part based upon data generated by the GTEx, CCLE, GEO, TCGA, and Sanger Box 3.0. Our deepest gratitude goes to the anonymous reviewers for their careful work and thoughtful suggestions that have helped to improve this paper substantially.
Li G‐S, Huang H‐Q, Liang Y, et al. BCAT1: A risk factor in multiple cancers based on a pan‐cancer analysis. Cancer Med. 2022;11:1396–1412. doi: 10.1002/cam4.4525
DATA AVAILABILITY STATEMENT
The data that support the findings of pan‐cancer analyses are available in public databases with serial number for each dataset (e.g., GSE107591), and the databases containing GTEx Portal at https://gtexportal.org/home/, DepMap Portal at https://depmap.org/portal/download/, Gene Expression Omnibus at https://www.ncbi.nlm.nih.gov/gds/, the Cancer Genome Atlas at https://www.cancer.gov/about‐nci/organization/ccg/research/structural‐genomics/tcga, and Sanger Box 3.0 at http://vip.sangerbox.com/. Data on in‐house tissue microarrays and microarray matrix used during the current study are available from the corresponding author upon reasonable request.
REFERENCES
- 1. Feng RM, Zong YN, Cao SM, Xu RH. Current cancer situation in China: good or bad news from the 2018 Global Cancer Statistics? Cancer Commun (Lond). 2019;39(1):22. [DOI] [PMC free article] [PubMed] [Google Scholar]
- 2. Sung H, Ferlay J, Siegel RL, et al. Global cancer statistics 2020: GLOBOCAN estimates of incidence and mortality worldwide for 36 cancers in 185 countries. CA Cancer J Clin. 2021;71(3):209‐249. [DOI] [PubMed] [Google Scholar]
- 3. Miller KD, Fidler‐Benaoudia M, Keegan TH, Hipp HS, Jemal A, Siegel RL. Cancer statistics for adolescents and young adults, 2020. CA Cancer J Clin. 2020;70(6):443‐459. [DOI] [PubMed] [Google Scholar]
- 4. Rehm J, Shield KD, Weiderpass E. Alcohol consumption. A leading risk factor for cancer. Chem Biol Interact. 2020;331:109280. [DOI] [PubMed] [Google Scholar]
- 5. Coleman HG, Xie SH, Lagergren J. The epidemiology of esophageal adenocarcinoma. Gastroenterology. 2018;154(2):390‐405. [DOI] [PubMed] [Google Scholar]
- 6. Zou H, Liao M, Xu W, Yao R, Liao W. Data mining of the expression and regulatory role of BCAT1 in hepatocellular carcinoma. Oncol Lett. 2019;18(6):5879‐5888. [DOI] [PMC free article] [PubMed] [Google Scholar]
- 7. Xu Y, Yu W, Yang T, et al. Overexpression of BCAT1 is a prognostic marker in gastric cancer. Hum Pathol. 2018;75:41‐46. [DOI] [PubMed] [Google Scholar]
- 8. Tonjes M, Barbus S, Park YJ, et al. BCAT1 promotes cell proliferation through amino acid catabolism in gliomas carrying wild‐type IDH1. Nat Med. 2013;19(7):901‐908. [DOI] [PMC free article] [PubMed] [Google Scholar]
- 9. Xu M, Liu Q, Jia Y, et al. BCAT1 promotes tumor cell migration and invasion in hepatocellular carcinoma. Oncol Lett. 2016;12(4):2648‐2656. [DOI] [PMC free article] [PubMed] [Google Scholar]
- 10. Zheng YH, Hu WJ, Chen BC, et al. BCAT1, a key prognostic predictor of hepatocellular carcinoma, promotes cell proliferation and induces chemoresistance to cisplatin. Liver Int. 2016;36(12):1836‐1847. [DOI] [PubMed] [Google Scholar]
- 11. Panosyan EH, Lasky JL, Lin HJ, et al. Clinical aggressiveness of malignant gliomas is linked to augmented metabolism of amino acids. J Neurooncol. 2016;128(1):57‐66. [DOI] [PMC free article] [PubMed] [Google Scholar]
- 12. Chattopadhyay I, Wang J, Qin M, et al. Src promotes castration‐recurrent prostate cancer through androgen receptor‐dependent canonical and non‐canonical transcriptional signatures. Oncotarget. 2017;8(6):10324‐10347. [DOI] [PMC free article] [PubMed] [Google Scholar]
- 13. Chang IW, Wu WJ, Wang YH, et al. BCAT1 overexpression is an indicator of poor prognosis in patients with urothelial carcinomas of the upper urinary tract and urinary bladder. Histopathology. 2016;68(4):520‐532. [DOI] [PubMed] [Google Scholar]
- 14. Consortium GT . The genotype‐tissue expression (GTEx) project. Nat Genet. 2013;45(6):580‐585. [DOI] [PMC free article] [PubMed] [Google Scholar]
- 15. Ghandi M, Huang FW, Jane‐Valbuena J, et al. Next‐generation characterization of the cancer cell line encyclopedia. Nature. 2019;569(7757):503‐508. [DOI] [PMC free article] [PubMed] [Google Scholar]
- 16. Beroukhim R, Mermel CH, Porter D, et al. The landscape of somatic copy‐number alteration across human cancers. Nature. 2010;463(7283):899‐905. [DOI] [PMC free article] [PubMed] [Google Scholar]
- 17. Thorsson V, Gibbs DL, Brown SD, et al. The immune landscape of cancer. Immunity. 2018;48(4):812‐30 e14. [DOI] [PMC free article] [PubMed] [Google Scholar]
- 18. Liu J, Lichtenberg T, Hoadley KA, et al. An integrated TCGA pan‐cancer clinical data resource to drive high‐quality survival outcome analytics. Cell. 2018;173(2):400‐16 e11. [DOI] [PMC free article] [PubMed] [Google Scholar]
- 19. Li T, Fu J, Zeng Z, et al. TIMER2.0 for analysis of tumor‐infiltrating immune cells. Nucleic Acids Res. 2020;48(W1):W509‐W514. [DOI] [PMC free article] [PubMed] [Google Scholar]
- 20. Yoshihara K, Shahmoradgoli M, Martinez E, et al. Inferring tumour purity and stromal and immune cell admixture from expression data. Nat Commun. 2013;4:2612. [DOI] [PMC free article] [PubMed] [Google Scholar]
- 21. Leek JT, Storey JD. Capturing heterogeneity in gene expression studies by surrogate variable analysis. PLoS Genet. 2007;3(9):1724‐1735. [DOI] [PMC free article] [PubMed] [Google Scholar]
- 22. Ritchie ME, Phipson B, Wu D, et al. limma powers differential expression analyses for RNA‐sequencing and microarray studies. Nucleic Acids Res. 2015;43(7):e47. [DOI] [PMC free article] [PubMed] [Google Scholar]
- 23. Balduzzi S, Rucker G, Schwarzer G. How to perform a meta‐analysis with R: a practical tutorial. Evid Based Ment Health. 2019;22(4):153‐160. [DOI] [PMC free article] [PubMed] [Google Scholar]
- 24. Robin X, Turck N, Hainard A, et al. pROC: an open‐source package for R and S+ to analyze and compare ROC curves. BMC Bioinformatics. 2011;12:77. [DOI] [PMC free article] [PubMed] [Google Scholar]
- 25. Bronner C, Alhosin M, Hamiche A, Mousli M. Coordinated dialogue between UHRF1 and DNMT1 to ensure faithful inheritance of methylated DNA patterns. Genes (Basel). 2019;10(1):65. [DOI] [PMC free article] [PubMed] [Google Scholar]
- 26. Zeng B, Zhang X, Zhao J, et al. The role of DNMT1/hsa‐miR‐124‐3p/BCAT1 pathway in regulating growth and invasion of esophageal squamous cell carcinoma. BMC Cancer. 2019;19(1):609. [DOI] [PMC free article] [PubMed] [Google Scholar]
- 27. Latham A, Srinivasan P, Kemel Y, et al. Microsatellite Instability Is Associated With the Presence of Lynch Syndrome Pan‐Cancer. J Clin Oncol. 2019;37(4):286‐295. [DOI] [PMC free article] [PubMed] [Google Scholar]
- 28. Toor SM, Sasidharan Nair V, Decock J, Elkord E. Immune checkpoints in the tumor microenvironment. Semin Cancer Biol. 2020;65:1‐12. [DOI] [PubMed] [Google Scholar]
- 29. Li K, Luo H, Huang L, Luo H, Zhu X. Microsatellite instability: a review of what the oncologist should know. Cancer Cell Int. 2020;20:16. [DOI] [PMC free article] [PubMed] [Google Scholar]
- 30. Zhao P, Li L, Jiang X, Li Q. Mismatch repair deficiency/microsatellite instability‐high as a predictor for anti‐PD‐1/PD‐L1 immunotherapy efficacy. J Hematol Oncol. 2019;12(1):54. [DOI] [PMC free article] [PubMed] [Google Scholar]
- 31. Jardim DL, Goodman A, de Melo GD, Kurzrock R. The challenges of tumor mutational burden as an immunotherapy biomarker. Cancer Cell. 2021;39(2):154‐173. [DOI] [PMC free article] [PubMed] [Google Scholar]
- 32. Schumacher TN, Scheper W, Kvistborg P. Cancer neoantigens. Annu Rev Immunol. 2019;37:173‐200. [DOI] [PubMed] [Google Scholar]
- 33. Wang ZQ, Faddaoui A, Bachvarova M, et al. BCAT1 expression associates with ovarian cancer progression: possible implications in altered disease metabolism. Oncotarget. 2015;6(31):31522‐31543. [DOI] [PMC free article] [PubMed] [Google Scholar]
- 34. Mayers JR, Torrence ME, Danai LV, et al. Tissue of origin dictates branched‐chain amino acid metabolism in mutant Kras‐driven cancers. Science. 2016;353(6304):1161‐1165. [DOI] [PMC free article] [PubMed] [Google Scholar]
- 35. Belfield EJ, Ding ZJ, Jamieson FJC, et al. DNA mismatch repair preferentially protects genes from mutation. Genome Res. 2018;28(1):66‐74. [DOI] [PMC free article] [PubMed] [Google Scholar]
- 36. Galuppini F, Dal Pozzo CA, Deckert J, Loupakis F, Fassan M, Baffa R. Tumor mutation burden: from comprehensive mutational screening to the clinic. Cancer Cell Int. 2019;19:209. [DOI] [PMC free article] [PubMed] [Google Scholar]
- 37. Chan TA, Yarchoan M, Jaffee E, et al. Development of tumor mutation burden as an immunotherapy biomarker: utility for the oncology clinic. Ann Oncol. 2019;30(1):44‐56. [DOI] [PMC free article] [PubMed] [Google Scholar]
- 38. Li R, Han D, Shi J, et al. Choosing tumor mutational burden wisely for immunotherapy: A hard road to explore. Biochim Biophys Acta Rev Cancer. 2020;1874(2):188420. [DOI] [PubMed] [Google Scholar]
- 39. van der Leun AM, Thommen DS, Schumacher TN. CD8(+) T cell states in human cancer: insights from single‐cell analysis. Nat Rev Cancer. 2020;20(4):218‐232. [DOI] [PMC free article] [PubMed] [Google Scholar]
- 40. Hinshaw DC, Shevde LA. The tumor microenvironment innately modulates cancer progression. Cancer Res. 2019;79(18):4557‐4566. [DOI] [PMC free article] [PubMed] [Google Scholar]
- 41. Borst J, Ahrends T, Babala N, Melief CJM, Kastenmuller W. CD4(+) T cell help in cancer immunology and immunotherapy. Nat Rev Immunol. 2018;18(10):635‐647. [DOI] [PubMed] [Google Scholar]
- 42. Okada R, Koshizuka K, Yamada Y, et al. Regulation of oncogenic targets by miR‐99a‐3p (passenger strand of miR‐99a‐duplex) in head and neck squamous cell carcinoma. Cells. 2019;8(12):1535. [DOI] [PMC free article] [PubMed] [Google Scholar]
- 43. Panosyan EH, Lin HJ, Koster J, Lasky JL 3rd. In search of druggable targets for GBM amino acid metabolism. BMC Cancer. 2017;17(1):162. [DOI] [PMC free article] [PubMed] [Google Scholar]
- 44. Qi LN, Xiang BD, Wu FX, et al. Circulating tumor cells undergoing EMT provide a metric for diagnosis and prognosis of patients with hepatocellular carcinoma. Cancer Res. 2018;78(16):4731‐4744. [DOI] [PubMed] [Google Scholar]
- 45. Wang H, Wang F, Ouyang W, Jiang X, Wang Y. BCAT1 overexpression regulates proliferation and cMyc/GLUT1 signaling in head and neck squamous cell carcinoma. Oncol Rep. 2021;45(5):52. [DOI] [PMC free article] [PubMed] [Google Scholar]
- 46. Ji X, Guo X, Wang Y, Li X, Li H. Rab18 regulates proliferation, invasion and cisplatin sensitivity through STAT3 signaling in head and neck squamous cell carcinoma. Onco Targets Ther. 2020;13:4123‐4134. [DOI] [PMC free article] [PubMed] [Google Scholar]
- 47. Lundberg M, Renkonen S, Haglund C, et al. Association of BMI‐1 and p16 as prognostic factors for head and neck carcinomas. Acta Otolaryngol. 2016;136(5):501‐505. [DOI] [PubMed] [Google Scholar]
- 48. Li GS, Hou W, Chen G, et al. Clinical significance of integrin subunit beta 4 in head and neck squamous cell carcinoma. Cancer Biother Radiopharm. 2020. 10.1089/cbr.2020.3943 [DOI] [PubMed] [Google Scholar]
Associated Data
This section collects any data citations, data availability statements, or supplementary materials included in this article.
Supplementary Materials
Appendix S1
Appendix S2
Appendix S3
Appendix S4
Data Availability Statement
The data that support the findings of pan‐cancer analyses are available in public databases with serial number for each dataset (e.g., GSE107591), and the databases containing GTEx Portal at https://gtexportal.org/home/, DepMap Portal at https://depmap.org/portal/download/, Gene Expression Omnibus at https://www.ncbi.nlm.nih.gov/gds/, the Cancer Genome Atlas at https://www.cancer.gov/about‐nci/organization/ccg/research/structural‐genomics/tcga, and Sanger Box 3.0 at http://vip.sangerbox.com/. Data on in‐house tissue microarrays and microarray matrix used during the current study are available from the corresponding author upon reasonable request.


