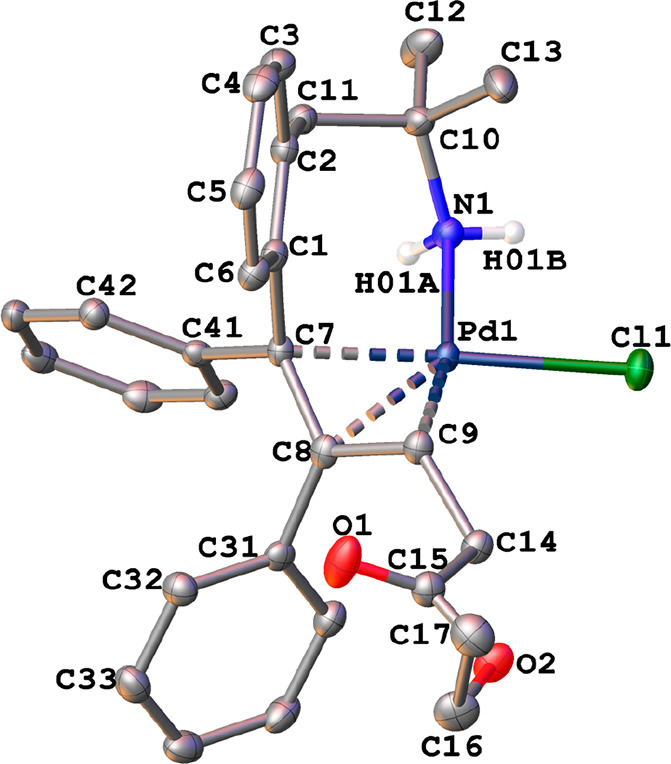
Figure 3.

X-ray thermal ellipsoid plot (50% probability) of syn-2b along with the labeling scheme. The hydrogen atoms bonded to carbon have been omitted for clarity. Selected bond lengths (Å) and angles (deg): Pd(1)–Cl(1) = 2.3864(5), Pd(1)–N(1) = 2.1257(18), Pd(1)–C(7) = 2.1198(19), Pd(1)–C(8) = 2.1400(19), Pd(1)–C(9) = 2.1167(19), C(7)–C(8) = 1.441(3), C(8)–C(9) = 1.421(3); Cl(1)–Pd(1)–N(1) = 89.81(5), C(7)–C(8)–C(9) = 117.38(18), C(8)–C(9)–C(14) = 122.49(18).
