

Abstract
Ferroptosis, a form of regulated cell death induced by excessive lipid peroxidation, has recently emerged as a key tumor suppression mechanism1–4. Glutathione peroxidase 4 (GPX4)5, 6 and ferroptosis suppressor protein 1 (FSP1)7, 8 constitute two major ferroptosis defense systems. Here we show that treatment with GPX4 inhibitors in cancer cells results in an acute depletion of N-carbamoyl-L-aspartate (C-Asp), a pyrimidine biosynthesis intermediate, with a concomitant accumulation of uridine. Supplementation of dihydroorotate (DHO) or orotate (OA), the substrate and product of DHO dehydrogenase (DHODH), attenuates or potentiates ferroptosis induced by GPX4 inhibition, respectively, and these effects are particularly pronounced in cancer cells with low expression of GPX4 (GPX4low). DHODH inactivation induces extensive mitochondrial lipid peroxidation and ferroptosis in GPX4low cancer cells, whereas DHODH inactivation synergizes with ferroptosis inducers to induce mitochondrial lipid peroxidation and ferroptosis in GPX4high cancer cells. Mechanistically, DHODH operates in parallel to mitochondrial GPX4 (but independent of cytosolic GPX4 or FSP1) to inhibit ferroptosis in the mitochondrial inner membrane, through reducing ubiquinone (CoQ) to ubiquinol (CoQH2), a radical-trapping antioxidant with anti-ferroptosis activity. We further show that the DHODH inhibitor brequinar selectively suppresses GPX4low tumor growth through inducing ferroptosis, whereas combined treatment with brequinar and sulfasalazine, an FDA-approved drug with ferroptosis inducing activity, synergistically induces ferroptosis and suppresses GPX4high tumor growth. Our results identify a DHODH-mediated ferroptosis defense mechanism in mitochondria and suggest a therapeutic strategy to target ferroptosis in cancer treatment.
Keywords: ferroptosis, DHODH, GPX4, lipid peroxidation, mitochondria, cancer therapy
Cells have evolved at least two defense mechanisms to suppress ferroptosis: GPX4 utilizes reduced glutathione (GSH) to detoxify lipid hydroperoxides and inhibit ferroptosis5, 6, and FSP1 (also called AIFM2) functions as an oxidoreductase to reduce CoQ to CoQH2 mainly on the plasma membrane; CoQH2 then acts as a lipophilic radical-trapping antioxidant to detoxify lipid peroxyl radicals7, 8. Whether there exist additional cellular defense mechanisms against ferroptosis at other subcellular compartments remains unclear.
Metabolomics link DHODH to ferroptosis
Global metabolomic analyses revealed that treatment with GPX4 inhibitor RSL3 or ML162 in cancer cells resulted in a marked depletion of C-Asp, an intermediate of pyrimidine biosynthesis, with a concomitant accumulation of uridine, an end product of pyrimidine biosynthesis (Fig. 1a, b and Extended Data Fig. 1a–f). Metabolic tracer studies revealed that RSL3 treatment significantly increased 15N-UMP levels, and this effect was completely rescued by the ferroptosis inhibitor liproxstatin-1 (Fig. 1c). Supplementation of pyrimidine biosynthesis intermediates (Extended Data Fig. 1f) revealed that DHO protected cells from, whereas OA sensitized cells to, GPX4 inhibition; surprisingly, uridine supplementation did not affect cellular sensitivity to GPX4 inhibitors (Fig. 1d). We confirmed that DHO or OA supplementation drastically increased its intracellular levels (Extended Data Fig. 1g). C-Asp appears to be largely impermeable to cells, as C-Asp supplementation only moderately increased its intracellular levels (Extended Data Fig. 1h) and did not affect ferroptosis sensitivity (Fig. 1d). The observation that the substrate and product of the DHODH reaction (Extended Data Fig. 1f) exerted opposite effects on ferroptosis sensitivity suggested a potential role for DHODH in regulating ferroptosis in a manner independent of its function in generating pyrimidine nucleotides. Consistent with this, we found that RSL3 treatment significantly increased DHODH activity (Extended Data Fig. 1i).
Fig. 1. Metabolomics link DHODH to ferroptosis.
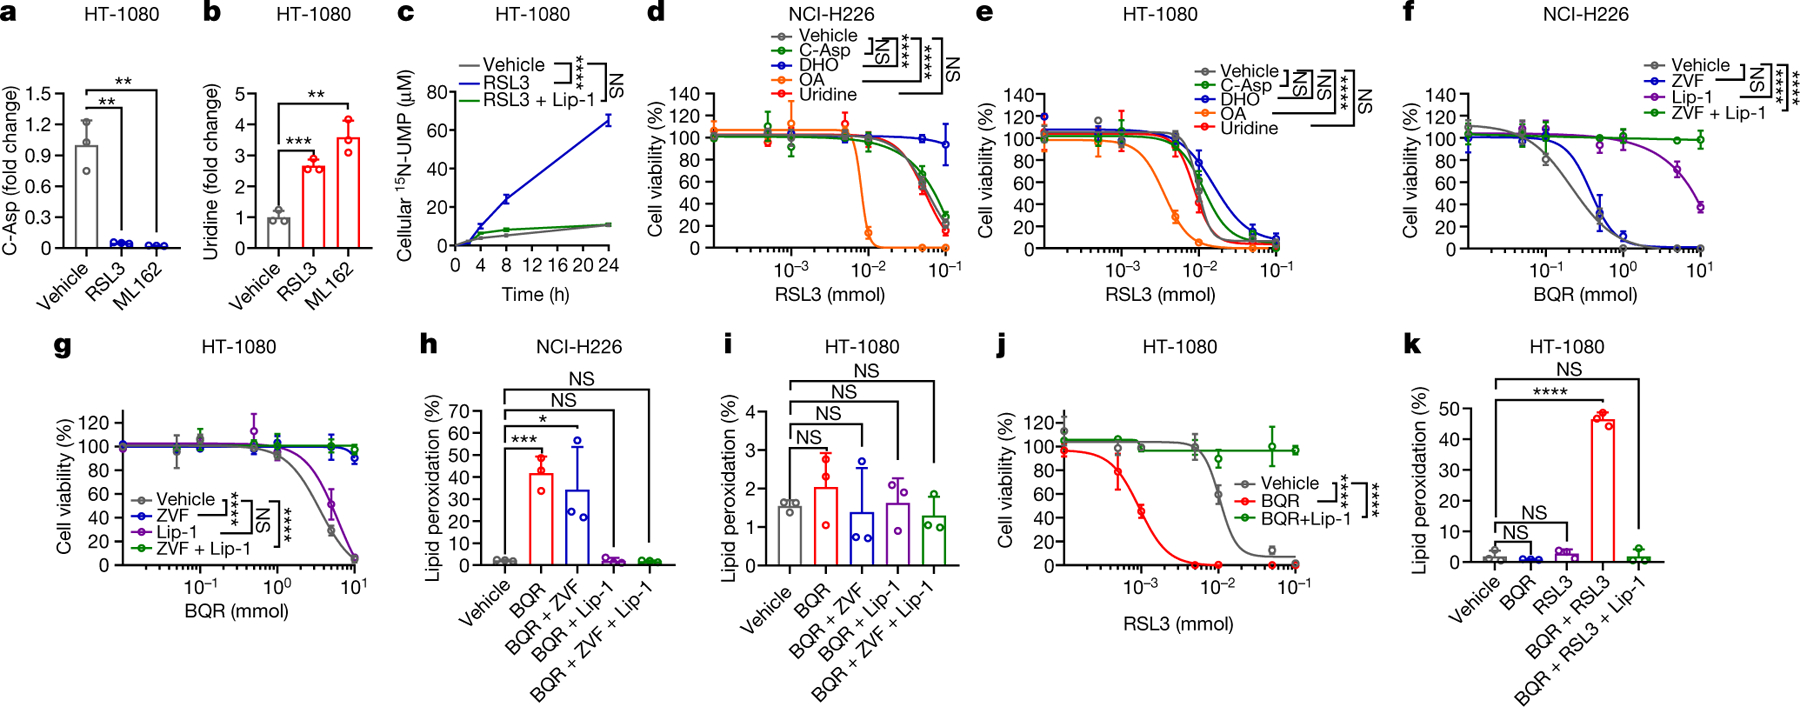
a, b, Fold changes in C-Asp (a) and uridine (b) induced by RSL3 (10 μM) or ML162 (10 μM) for 2 hours in HT-1080 cells. c, 15N-UMP levels in HT-1080 cells treated with RSL3 (10 μM) and/or liproxstatin-1 (Lip-1; 10 μM) for 2 hours. d, e, Cell viability in NCI-H226 (d) or HT-1080 cells (e) treated with RSL3 for 4 hours following pretreatment with vehicle, C-Asp (100 μM), DHO (100 μM), OA (100 μM), or uridine (50 μM) for 48 hours. f, g, Cell viability in NCI-H226 (f) or HT-1080 cells (g) treated with brequinar (BQR) for 4 hours following pretreatment with Lip-1 (10 μM) and/or Z-VAD-FMK (ZVF; 10 μM) for 24 hours. h, i, Lipid peroxidation in NCI-H226 (h) or HT-1080 (i) cells treated with BQR (500 μM), following pretreatment with vehicle, ZVF (10 μM), and/or Lip-1 (10 μM) for 24 hours. j, Cell viability in HT-1080 cells treated with RSL3 and BQR (500 μM) for 4 hours. k, Lipid peroxidation in HT-1080 cells treated with RSL3 (1 μM) and/or BQR (500 μM) for 2 hours, following pretreatment with vehicle or Lip-1 (10 μM) for 24 hours. Data are presented as mean values +/− SD, n = 3 independent repeats (a-k). Statistical analysis was performed using unpaired, two-tailed t-test. *P < 0.05, **P < 0.01, ***P < 0.001, ****P < 0.0001.
We noticed that DHO (or OA) supplementation generally exerted much more pronounced protecting (or sensitizing) effects in GPX4low cell lines (such as NCI-H226) than in GPX4high cell lines (such as HT-1080) (Fig. 1d, e and Extended Data Fig. 1j–l). Analyses of a panel of GPX4high and GPX4low cancer cell lines revealed that GPX4low cancer cells generally were more sensitive to DHODH inhibitors (Extended Data Fig. 1m, n). Notably, liproxstatin-1, but not the apoptosis inhibitor Z-VAD-FMK, largely rescued DHODH inhibition-induced cell death in GPX4low NCI-H226 cells (Fig. 1f and Extended Data Fig. 2a), whereas the opposite was observed in GPX4high HT-1080 cells treated with a DHODH inhibitor (Fig. 1g and Extended Data Fig. 2b). Consistently, DHODH inhibition induced potent lipid peroxidation and ferroptosis marker gene PTGS2 expression in GPX4low but not in GPX4high cancer cells (Fig. 1h, i and Extended Data Fig. 2a, b). Therefore, ferroptosis induction likely accounts for the more pronounced vulnerability of GPX4low cancer cells than GPX4high cancer cells to DHODH inhibition.
While DHODH inhibition did not obviously induce ferroptosis in GPX4high cells (Fig. 1g), it markedly sensitized such cells to ferroptosis induced by class 2 ferroptosis inducers (RSL3 and ML162, which inhibit GPX4 activity) (Fig. 1j, k and Extended Data Fig. 2c–e) or class 1 ferroptosis inducers (sulfasalazine and erastin, which block SLC7A11-mediated cystine transport; cancer cells mainly rely on SLC7A11 to obtain cysteine for GSH synthesis9) (Extended Data Fig. 2f, g). DHODH inhibitor treatment did not affect the expression of GPX4, SLC7A11, or ACSL4 (a lipid metabolism enzyme that is required for ferroptosis in many cell lines10), or GSH levels (Extended Data Fig. 2h, i). Together, these data suggest that DHODH inhibition induces ferroptosis in GPX4low cancer cells but sensitizes GPX4high cancer cells to ferroptosis.
DHODH deletion promotes ferroptosis
The aforementioned data prompted further analyses of the genetic interaction between DHODH and GPX4. Analyses of the Cancer Therapeutics Response Portal11 revealed that DHODH expression correlated with resistance to GPX4 inhibitors (Fig. 2a). DHODH knockout (KO) in GPX4high HT-1080 cells (Extended Data Fig. 3a) abolished DHODH enzyme activity and induced substantial cell death (but without inducing obvious lipid peroxidation), which could be largely rescued by uridine supplementation (Extended Data Fig. 3b–e). We confirmed the lack of lipid peroxidation induction upon DHODH deletion in additional GPX4high cancer cells (Extended Data Fig. 3a, e). (Unless otherwise stated, we used uridine supplemented medium in all of our studies with DHODH KO cells.) DHODH deletion markedly sensitized HT-1080 cells to RSL3- or ML162-induced lipid peroxidation and ferroptosis (Fig. 2b, c and Extended Data Fig. 3f, g), which could be largely abolished by ACSL4 deletion (Extended Data Fig. 3h, i). DHODH deletion did not affect GPX4, SLC7A11, or ACSL4 expression levels, or GSH levels (Extended Data Fig. 3j, k). Notably, unlike in HT-1080 cells, DHODH deletion in GPX4low NCI-H226 cells potently induced lipid peroxidation and ferroptosis even with uridine supplementation, and uridine supplementation was not sufficient to maintain long-term culturing of DHODH KO NCI-H226 cells (Fig. 2d, e and Extended Data Fig. 3l–o). We validated DHODH deletion-induced lipid peroxidation in additional GPX4low cancer cells (Extended Data Fig. 3l, p).
Fig. 2. DHODH deletion promotes ferroptosis.
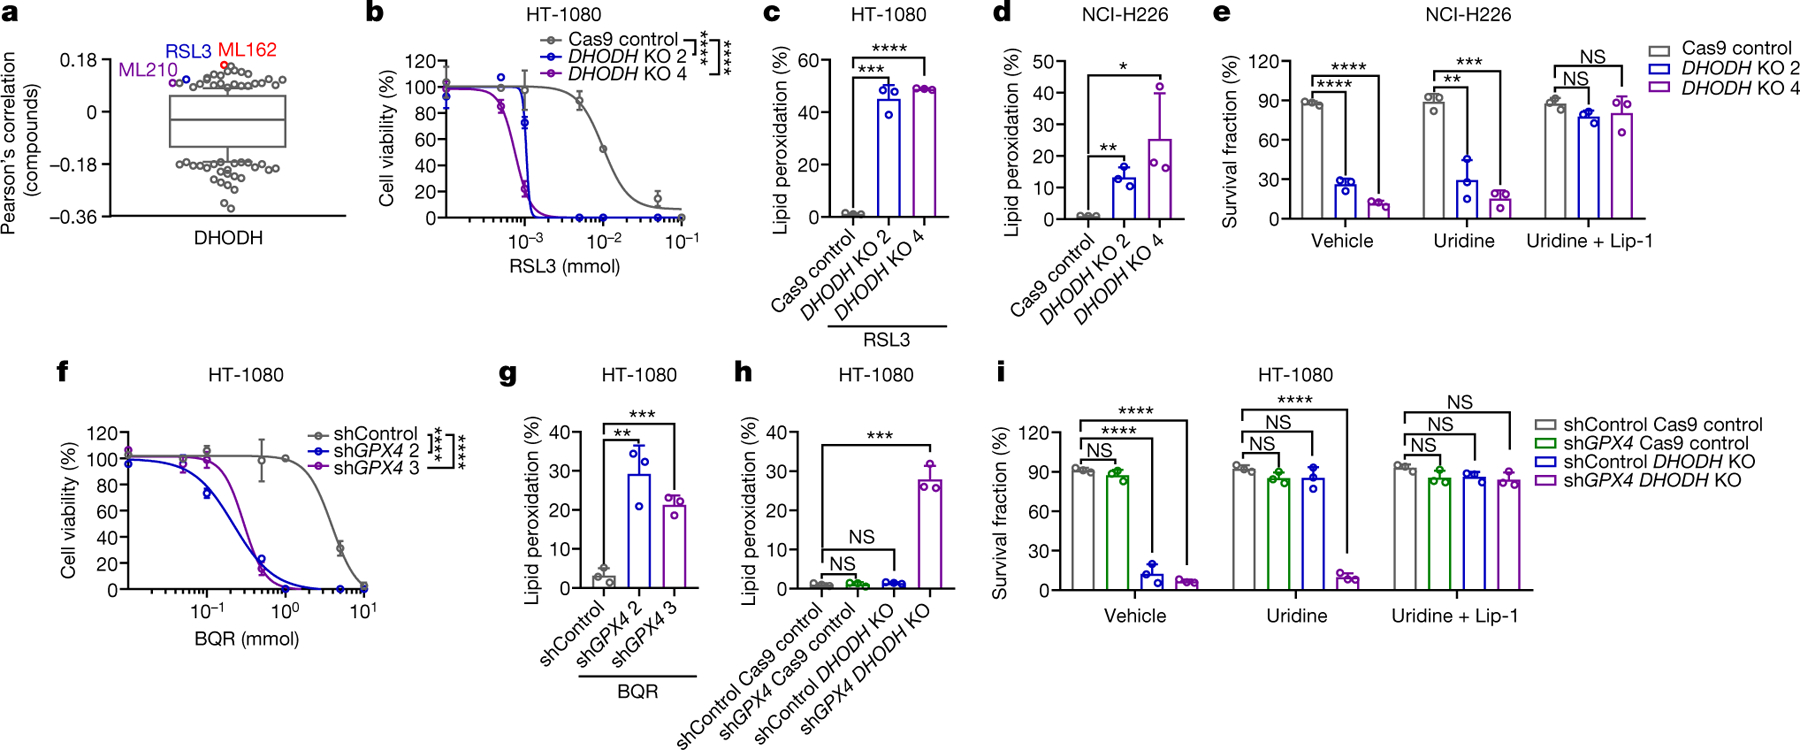
a, High DHODH expression correlates with resistance to GPX4 inhibitors (RSL3, ML162, and ML210) in cancer cells. Plotted data were mined from the CTRP database. Plotted values are Pearson’s correlation coefficients. Box plots indicate median, 10th and 90th percentiles, and minima and maxima of the distributions. b, Cell viability in Cas9ctrl and DHODHko HT-1080 cells treated with RSL3 for 4 hours. c, Lipid peroxidation in Cas9ctrl and DHODHko HT-1080 cells treated with RSL3 (1 μM) for 2 hours. d, Lipid peroxidation in Cas9ctrl and DHODHko NCI-H226 cells. e, Cell survival fraction in Cas9ctrl and DHODHko NCI-H226 cells treted with vehicle, uridine (50 μM), and uridine (50 μM) + Lip-1 (10 μM) for 24 hours. f, Cell viability in Shctrl and GPX4sh HT-1080 cells treated with BQR for 4 hours. g, Lipid peroxidation in Shctrl and GPX4sh HT-1080 cells treated with BQR (500 μM) for 2 hours. h, Lipid peroxidation in HT-1080 cells with indicated genotypes. i, Cell survival fraction in HT-1080 cells with indicated genotypes treated with vehicle, uridine (50 μM), and uridine (50 μM) + Lip-1 (10 μM) for 24 hours. Cells were grown in uridine supplemented medium (50 μM) (b-d, h). Data are presented as mean values +/− SD, n = 3 independent repeats (a-i). Statistical analysis was performed using unpaired, two-tailed t-test. *P < 0.05, **P < 0.01, ***P < 0.001, ****P < 0.0001.
GPX4 partial knockdown in HT-1080 cells did not affect basal cell growth or viability but markedly sensitized cells to DHODH inhibitor-induced lipid peroxidation and ferroptosis (Fig. 2f, g and Extended Data Fig. 4a–d). GPX4 knockdown significantly increased DHODH levels (Extended Data Fig. 4a), which likely represents an adaptive cellular response attempting to suppress ferroptosis in response to chronic GPX4 inactivation. Further deleting DHODH in GPX4 knockdown cells (but not DHODH deletion or GPX4 knockdown alone) markedly induced lipid peroxidation and ferroptosis (Fig. 2h, i and Extended Data Fig. 4e, f); uridine supplementation rescued cell death in DHODH KO cells, but not in such cells with GPX4 knockdown (Fig. 2i and Extended Data Fig. 4g). Together, our data suggest that DHODH acts in parallel to GPX4 to suppress ferroptosis, and DHODH deletion induces ferroptosis in GPX4low cancer cells (or GPX4high cancer cells with GPX4 knockdown).
We also studied the genetic interaction between DHODH and FSP17, 8. FSP1 overexpression significantly suppressed, while its deletion promoted, RSL3-induced ferroptosis in HT-1080 cells; however, FSP1 overexpression or deletion did not affect RSL3-induced ferroptosis in DHODH KO counterparts (Extended Data Fig. 4h–k). Likewise, DHODH inhibitor treatment promotes RSL3-induced ferroptosis in wild-type (WT) cells but not in FSP1 KO counterparts (Extended Data Fig. 4l). Our data suggest that DHODH and FSP1 likely operate in two separate systems to inhibit ferroptosis.
DHODH inhibits mitochondrial ferroptosis
DHODH is an enzyme localized on the outer face of the mitochondrial inner membrane12. Restoration of DHODH WT, but not its catalytically inactive mutant (R135C) or a mutant defective in mitochondrial localization (Δ2–12), rescued ferroptosis sensitivity to GPX4 inhibitors in DHODH KO HT-1080 cells (Fig. 3a and Extended Data Fig. 4m–q). Mammalian cells encode several GPX4 isoforms with distinctive subcellular localization, including cytosol- and mitochondria-localized GPX4 (GPX4cyto and GPX4mito)13. Fractionation analyses revealed that GPX4high cancer cells generally exhibited high expression of both GPX4mito and GPX4cyto (Extended Data Fig. 5a). Notably, restoration of GPX4mito, but not GPX4cyto, in GPX4 knockdown HT-1080 cells rescued cellular sensitivity to DHODH inhibition (Fig. 3b and Extended Data Fig. 5b–e). We confirmed this observation in a variety of cell lines (Extended Data Fig. 5f, g). Likewise, overexpression of GPX4mito, but not GPX4cyto, in NCI-H226 cells rendered these cells more resistant to DHODH inhibition and mitigated lipid peroxidation induced by DHODH inhibitors (Extended Data Fig. 6a–d). We further showed that the RTA 2,2,6,6-tetramethylpiperidinyl-1-oxy (TEMPO), similar to liproxstatin-1, rescued GPX4 inhibition-induced ferroptosis in both DHODH WT and KO HT-1080 cells; in contrast, mitochondria-targeted TEMPO (mito-TEMPO)14 provided substantial protection in DHODH KO but not in its WT counterparts (Fig. 3c, d and Extended Data Fig. 6e).
Fig. 3. DHODH suppresses mitochondrial lipid peroxidation.
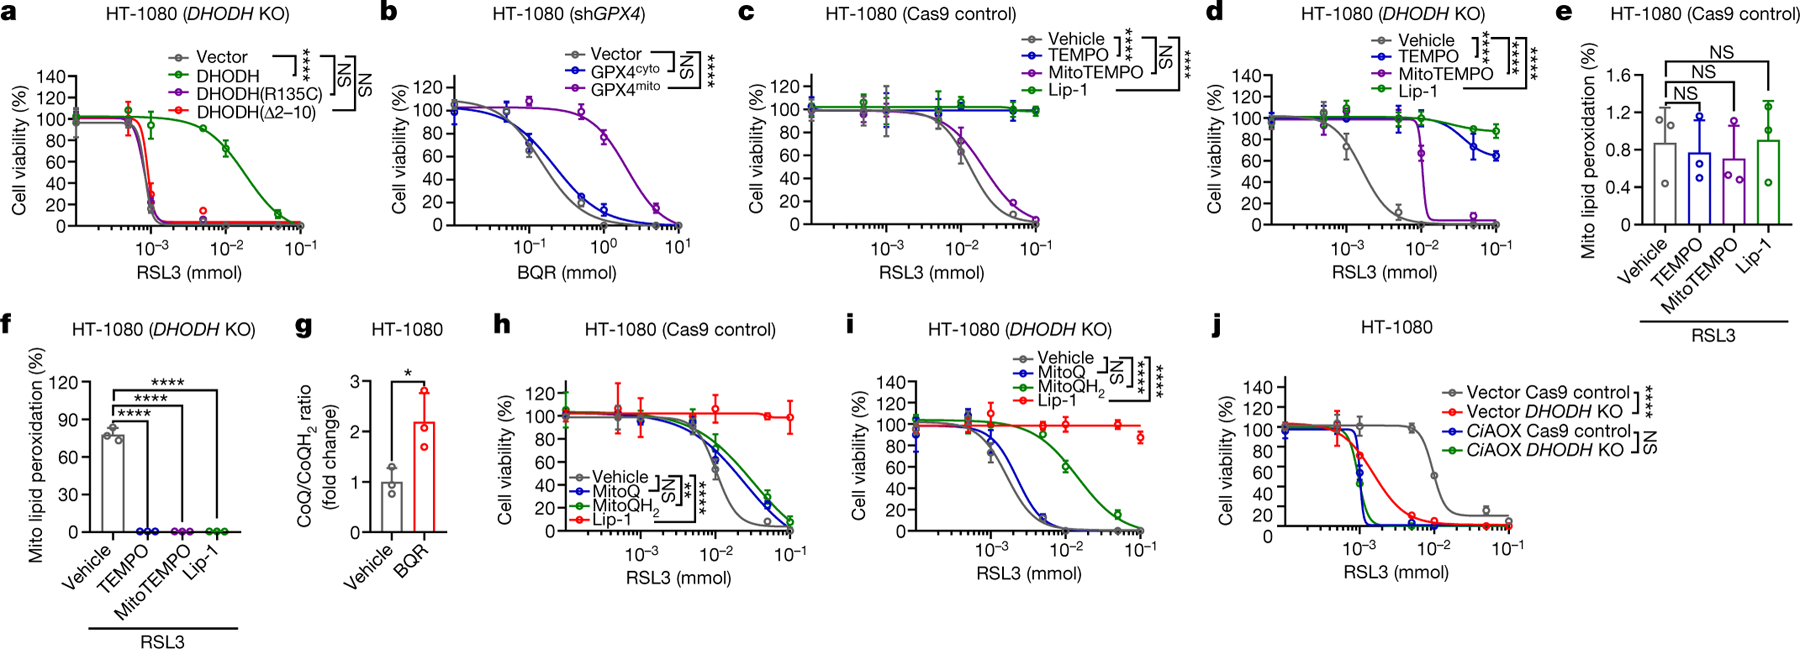
a, b, Cell viability in HT-1080 cells with indicated genotypes treated with RSL3 (a) or BQR (b) for 4 hours. c, d, Cell viability in Cas9ctrl (c) or DHODHko (d) HT-1080 cells treated with RSL3 for 4 hours, following pretreatment with vehicle, TEMPO (10 μM), MitoTEMPO (10 μM), or Lip-1 (10 μM) for 24 hours. e, f, Mitochondrial lipid peroxidation in Cas9ctrl (e) or DHODHko (f) HT-1080 cells treated with RSL3 (1 μM) for 2 hours following pretreatment with vehicle, TEMPO (10 μM), MitoTEMPO (10 μM), or Lip-1 (10 μM) for 24 hours. g, CoQ/CoQH2 ratio in HT-1080 cells treated with BQR (1 mM) for 2 hours. h, i, Cell viability in Cas9ctrl (h) or DHODHko (i) HT-1080 cells treated with RSL3 for 4 hours, following pretreatment with vehicle, MitoQ (10 μM), MitoQH2 (10 μM), or Lip-1 (10 μM) for 24 hours. j, Cell viability in HT-1080 cells with indicated genotypes treated with RSL3 for 4 hours. Cells were grown in 50 μM uridine supplemented medium (a, c-f, h-j). Data are presented as mean values +/− SD, n = 3 independent repeats (a-j). Statistical analysis was performed using unpaired, two-tailed t-test. *P < 0.05, **P < 0.01, ***P < 0.001, ****P < 0.0001.
Consistent with a previous report6, staining of mito-BoDIPY (a mitochondria-targeted version of C11-BoDIPY to specifically detect mitochondrial lipid peroxidation15) showed no obvious mitochondrial lipid peroxidation upon GPX4 inhibition in HT-1080 cells (Fig. 3e); remarkably, GPX4 inhibitors induced potent mitochondrial lipid peroxidation in DHODH KO HT-1080 cells, which could be suppressed by TEMPO, mito-TEMPO, or liproxstatin-1 treatment (Fig. 3f and Extended Data Fig. 6f). Likewise, combined inactivation of GPX4 and DHODH, but not either single inactivation, massively induced mitochondrial lipid peroxidation (Extended Data Fig. 6g–k). FSP1 overexpression or deletion did not affect mitochondrial lipid peroxidation in either DHODH WT or KO cells (Extended Data Fig. 6l–n). Overexpression of mitochondria-localized FSP1 (by adding a mitochondrial targeting sequence to the N-terminus of FSP1) did not affect mitochondrial lipid peroxidation or provide any protection to RSL3-induced ferroptosis in HT-1080 cells or DHDOH KO counterparts (Extended Data Fig. 6o–q). These data suggest that targeting FSP1 to mitochondria alone is not sufficient to drive its presumed anti-ferroptosis function in mitochondria, likely because FSP1’s function in ferroptosis regulation requires additional regulatory proteins that localize on the plasma membrane. Finally, restoration of GPX4mito, but not GPX4cyto, suppressed mitochondrial lipid peroxidation caused by DHODH inhibition in GPX4 knockdown HT-1080 cells or GPX4low NCI-H226 cells (ExtendedData Fig. 6r, s). Our data therefore support a model wherein DHODH acts in parallel to mitochondrial GPX4, but not cytosolic GPX4 or FSP1, to suppress mitochondrial lipid peroxidation and ferroptosis.
We found that DHODH inhibition did not sensitize cells to the class 3 ferroptosis inducer FIN56, which acts by depleting both GPX4 protein and CoQ16 (Extended Data Fig. 7a, b). Unlike RSL3, FIN56 treatment induced substantial mitochondrial lipid peroxidation, and DHODH deletion did not further increase mitochondrial lipid peroxidation under FIN56 treatment (Extended Data Fig. 7b). Deletion of COQ2, a key enzyme involved in CoQ biosynthesis, or blocking CoQ biosynthesis by 4-chlorobenzoic acid (4-CBA) treatment significantly decreased total CoQ levels (Extended Data Fig. 7c–e), and promoted ferroptosis much more dramatically in HT-1080 cells than in their DHODH KO counterparts (Extended Data Fig. 7f–j). These data suggest that DHODH suppresses mitochondrial lipid peroxidation and ferroptosis in a CoQ-dependent manner.
DHODH couples the oxidation of DHO to OA to the reduction of CoQ to CoQH2 in the mitochondrial inner membrane12 (Extended Data Fig. 7k). We confirmed that DHODH inhibition significantly increased CoQ/CoQH2 ratio (Fig. 3g and Extended Data Fig. 7l). Supplementation of mitoQ and mitoQH2 (mitochondria-targeted analogs of CoQ and CoQH2, respectively) provided limited protection against RSL3- or ML162-induced ferroptosis in HT-1080 cells (Fig. 3h and Extended Data Fig. 7m), which is consistent with a previous report6; in contrast, mitoQH2, but not mitoQ, significantly protected against RSL3- or ML162-induced mitochondrial lipid peroxidation and ferroptosis in DHODH KO cells (Fig. 3i and Extended Data Fig. 7m–o). These results suggest that (i) mitoQH2 mainly inhibits ferroptosis in cells with extensive mitochondrial lipid peroxidation (such as DHODH KO cells with GPX4 inactivation), and (ii) DHODH is required for reducing mitoQ to mitoQH2 to suppress ferroptosis in HT-1080 cells. We confirmed these observations in most other cell lines we have tested (Extended Data Fig. 8a–j).
Electron transport chain (ETC) complex III converts CoQH2 back to CoQ. Treatment with complex III inhibitor myxothiazol significantly decreased CoQ/CoQH2 ratio, and similar to mitoQH2 treatment, did not affect ferroptosis sensitivity in HT-1080 cells yet protected against RSL3-induced ferroptosis in DHODH KO cells, albeit with a more moderate protective effect than mitoQH2 (Fig. 3i and Extended Data Fig. 8k–n). This is likely because upon GPX4 inactivation, much of the CoQH2 pool is consumed by quenching mitochondrial lipid peroxides, leaving less CoQH2 available to feed complex III. Finally, overexpression of Ciona intestinalis AOX, which oxidizes mitochondrial CoQH2 to CoQ without pumping protons17, had a dramatic sensitizing effect on RSL3-induced mitochondrial lipid peroxidation and ferroptosis in HT-1080 cells; importantly, DHODH deletion did not provide additional ferroptosis sensitizing effect in AOX-overexpressing cells (Fig. 3j and Extended Data Fig. 8o, p). Together, our data support a model that DHODH inhibits ferroptosis through reducing CoQ to CoQH2 in mitochondria.
DHODH inhibition in tumor ferroptosis
We further investigated the therapeutic potential of DHODH inhibitors in treating GPX4low tumors in vivo. In our following preclinical studies, we focused on brequinar, a DHODH inhibitor which has been tested in multiple clinical trials18–21. We showed that, while brequinar treatment or GPX4 knockdown alone did not affect the growth of HT-1080 xenograft tumors, GPX4 knockdown sensitized HT-1080 xenograft tumors to DHODH inhibition; importantly, treatment with liproxstatin-1 largely restored the growth of GPX4-knockdown tumors under brequinar treatment (Fig. 4a, b and Extended Data Fig. 9a). Brequinar treatment did not affect cleaved caspase-3 or Ki67 staining in these tumors (Extended Data Fig. 9b–d), yet dramatically increased 4-HNE staining, a lipid peroxidation marker22, in GPX4-knockdown tumors, but not in control tumors (Fig. 4c, d and Extended Data Fig. 9b). Likewise, brequinar significantly suppressed the tumor growth of GPX4low NCI-H226 xenografts or GPX4low patient-derived xenografts (PDXs), but not that of GPX4high PDXs, and the suppressed tumor growth could be restored by liproxstatin-1 treatment (Fig. 4e–i and Extended Data Fig. 9e, f). In addition, DHODH deletion markedly suppressed NCI-H226 xenograft tumor growth; notably, combined treatment with liproxstatin-1 and uridine, but not either treatment alone, almost completely restored the growth of DHODH KO tumors (Extended Data Fig. 9g, h), which is consistent with our in vitro data (Fig. 2e).
Fig. 4. DHODH inhibitor treatment suppresses tumor growth through inducing ferroptosis.
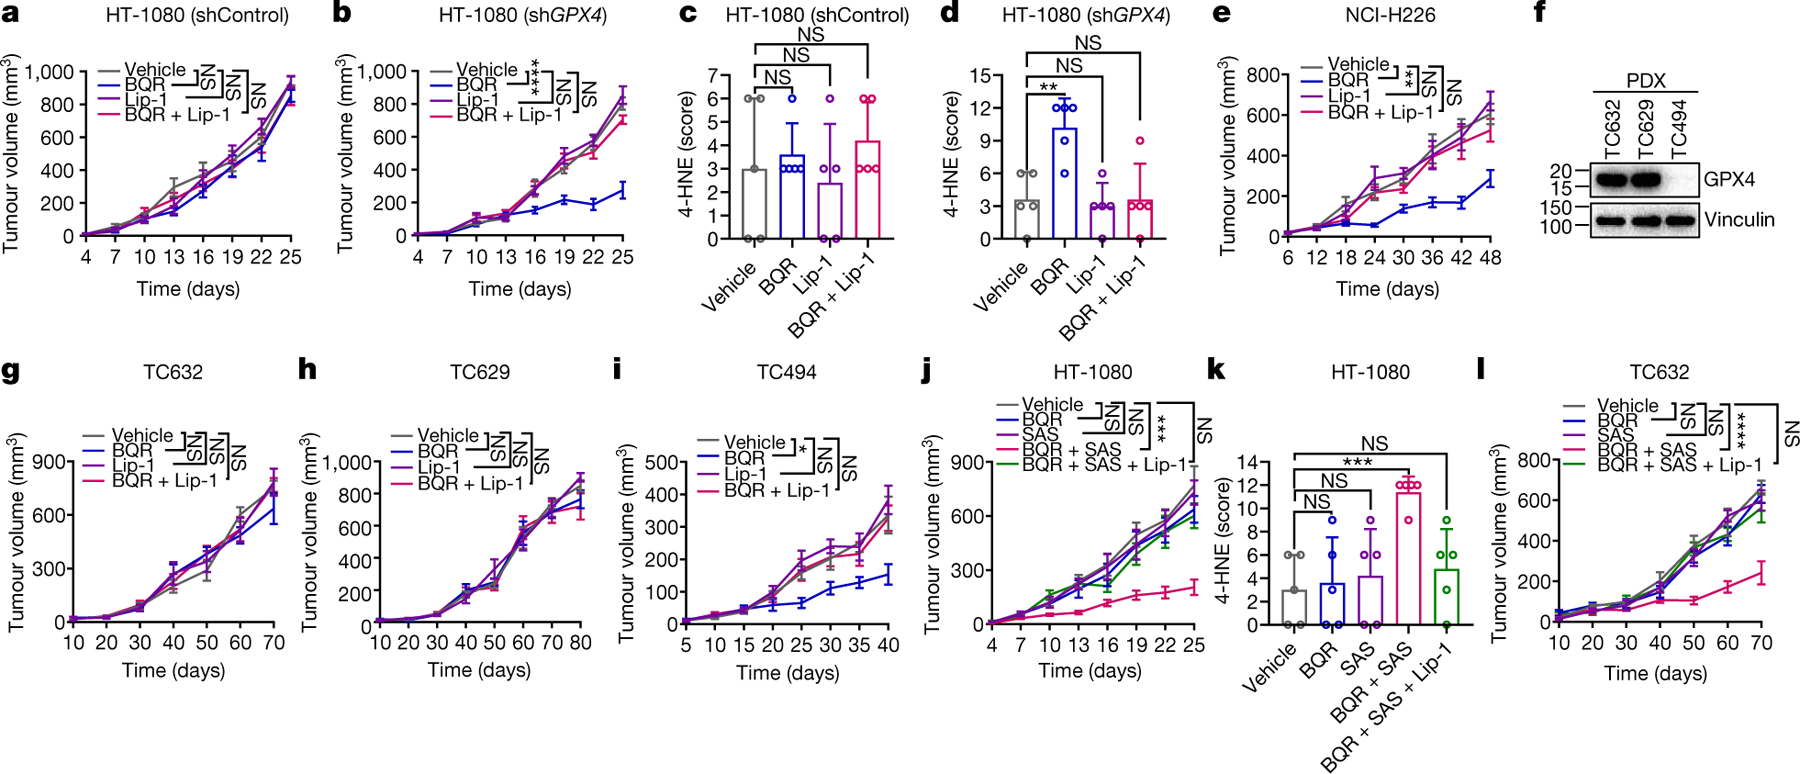
a, b, e, g-j, l, Tumor volumes of Shctrl (a) and GPX4sh (b) HT-1080 xenografts, NCI-H226 xenografts (e), TC632 (g, l), TC629 (h) or TC494 (i) PDXs, or HT-1080 xenografts (j) with indicated treatments at different days. c, d, k, Immunochemistry scoring of 4-HNE staining in Shctrl (c) and GPX4sh (d) HT-1080 xenograft tumors, or HT-1080 xenograft tumors (k) with indicated treatments. f, GPX4 protein levels in different PDX models. Data are presented as mean values +/− SD, n = 8 (a, b, e, j), n = 5 (c, d, k) or n = 6 independent tumors (g-i, l). Statistical analysis was performed using unpaired, two-tailed t-test. Western blot is representative of two biological replicates (f). *P < 0.05, **P < 0.01, ***P < 0.001, ****P < 0.0001.
Finally, we showed that combined treatment with brequinar and sulfasalazine, a ferroptosis inducer that inhibits SLC7A1123, synergistically induced lipid peroxidation and suppressed HT-1080 xenograft tumor growth, and the suppressed tumor growth could be largely restored by liproxstatin-1 treatment (Fig. 4j, k and Extended Data Fig. 9i–l). We made similar observations in GPX4high PDXs (Fig. 4l and Extended Data Fig. 9m, n). In all these animal studies, drug treatment did not significantly affect animal weights (Extended Data Fig. 9o), suggesting that the treatment was well-tolerated in vivo. Together, our results suggest DHODH inhibitors as a potential agent to treat GPX4low cancers and the combination of DHODH inhibitors with sulfasalazine to treat GPX4high cancers.
In summary, our study indicates that there exist at least three cellular protective systems against ferroptosis with distinctive subcellular localization (Extended Data Fig. 10): GPX4 in the cytosol and mitochondria, FSP1 on the plasma membrane, and DHODH in mitochondria. Our data further suggest that DHODH and mitochondrial GPX4 constitute two major defense arms to detoxify lipid peroxides in mitochondria; consequently, disabling one arm forces cells to be more dependent on the other, and disabling both arms can trigger ferroptosis mainly induced by mitochondrial lipid peroxidation. It should be noted that DHODH is an essential gene and uridine supplementation is required for maintaining cell proliferation and revealing ferroptosis phenotypes in DHODH KO cells, which likely explains why DHODH was not identified from previous CRISPR screens24, 25. This study also raises the question on the role of other mitochondrial enzymes that generate CoQH2, such as complex I, in regulating ferroptosis. A previous study showed that inhibiting complex I does not affect sensitivity to GPX4 inhibition or even blocks ferroptosis induced by erastin26. It is possible that other pro-ferroptosis functions of complex I, such as generating reactive oxygen species or ATP26, 27, have masked its anti-ferroptosis function via producing CoQH2; notably, DHODH is not involved in these pro-ferroptosis functions. Additional studies are needed to clarify complex I’s function in ferroptosis regulation. Finally, identification of DHODH inhibitors as ferroptosis inducers could have direct translational impacts for cancer therapy, considering that DHODH inhibitors and sulfasalazine have already been approved by FDA or extensively tested in clinic. DHODH inhibitors should be further combined with other standard-of-cares that induce ferroptosis, such as radiotherapy and immunotherapy22, 28–30.
Methods
Cell culture studies
UMRC2, UMRC6, and RCC4 cell lines were provided by W. G. Kaelin at Dana-Farber Cancer Institute. TK-10 cell line was obtained from Dr. Gordon Mills at MD Anderson Cancer Center. All other cancer cell lines were obtained from the American Type Culture Collection. All cell lines were free of mycoplasma contamination (tested by the vendor). No cell line used in this study has been found in the International Cell Line Authentication Committee database of commonly misidentified cell lines, based on short tandem repeat profiling performed by the vendor. Cells were cultured in DMEM with 10% (volume/volume; v/v) FBS and 1% (v/v) penicillin/streptomycin at 37 °C with a humidified atmosphere of 20% O2 and 5% CO2. All cell lines were cultured in a 10-cm plate and then cultured into a 12-well plate for cell death and lipid peroxidation measurement. For cell viability assays, cells were cultured into a 96-well plate. Cells were treated with ferroptosis inducers including RSL3 (Selleckchem), ML162 (Cayman Chemical), erastin (Cayman Chemical), FIN56 (Cayman Chemical), or sulfasalazine (Sigma-Aldrich); DHODH inhibitors including brequinar (Tocris), leflunomide (Sigma-Aldrich), or teriflunomide (Sigma-Aldrich); cell death inhibitors liproxstatin-1 (Cayman Chemical) or Z-VAD-FMK (R&D Systems); antioxidants including TEMPO (Sigma-Aldrich), MitoTEMPO (Sigma-Aldrich), MitoQ (Cayman Chemical), or MitoQH2 (Cayman Chemical); and mitochondria complex III inhibitor including myxothiazol (Sigma-Aldrich).
Plasmid constructs
GPX4 short hairpin RNA (shRNA) was purchased from Origene (TR316568). The target sequences of shRNAs used in this study are listed in Supplementary Table 1. GPX4 expression plasmids were obtained from Dr. Aikseng Ooi at The University of Arizona Health Sciences. DHODH and FSP1 cDNAs were obtained from the Functional Genomics Core Facility of The University of Texas MD Anderson Cancer Center, ciAOX cDNAs was purchased from Addgene (#111661), and subsequently cloned into the lentivirus vector pLVX-Puro. All constructs were confirmed by DNA sequencing.
CRISPR-Cas9–mediated gene knockout
Knockout of DHODH, ACSL4 and COQ2 in human cell lines was performed using single guide RNAs (sgRNAs) and doxycycline (DOX)-inducible CRISPR-Cas9 expression system as described in our recent publication27. sgRNAs were cloned into the lentiviral lentiGuide vector. The sequences of sgRNAs used in this study are listed in Supplementary Table 1. LentiGuide clones were transfected into HEK293T cells with psPAX2 packaging plasmid and pMD2.G expressing plasmid. Cells were infected with lentivirus with 0.8 μg/ml polybrene, selected with puromycin (1 μg/ml, InvivoGen), blasticidin (2 μg/ml, InvivoGen) or hygromycin B (2 μg/ml, InvivoGen) for 3 days and then single cells were sorted into 96-well plates. Single cells were maintained in DMEM with 10% (v/v) FBS and 1% (v/v) penicillin/streptomycin at 37 °C in an incubator with 20% O2 and 5% CO2 for 3–4 weeks and each colony was verified by western blot to confirm the target gene deletion. To generate cell lines with DOX-inducible CRISPR-Cas9–mediated gene deletion, cells were infected with lentivirus, selected with puromycin (1 μg/ml, InvivoGen), blasticidin (2 μg/ml, InvivoGen) or hygromycin B (2 μg/ml, InvivoGen) for 2 days and then single cells were sorted into 96-well plates. Once cell lines were established, 1 μg/ml of DOX (Sigma-Aldrich) was added to the media to induce target gene deletion for 48 hours after selection; then cells were cultured in DOX-free media for subsequent analyses.
Overexpression cell line generation
Cell lines with stable overexpression of target genes were generated as previously described31, 32. In brief, HEK293T cells were transfected with either pLVX-empty vector or target gene constructs, together with psPAX.2 and pMD2.G third-generation lentiviral packaging system using 0.8 μg/ml of polybrene. 72 hours later, lentivirus particles in the medium were collected and filtered, then the target cell lines were infected. At 48 hours after infection, puromycin was added to obtain stable cell lines with successful transduction.
Metabolomic analysis
Metabolomic analysis was performed as previously described33. Cells were seeded on 35 mm culture plates at a density sufficient to ensure approximately 70–80% confluence at the time of extraction. For metabolic tracer analysis of pyrimidine synthesis, HT-1080 cells were treated with RSL3 and/or Lip-1 for 2 hours and then were shifted to drug-free media containing amide-15N-glutamine (this time point is defined as 0 hour). Metabolites were extracted at the indicated time points for subsequent analyses. Metabolites were extracted by rapidly aspirating the culture medium and then adding 0.6 mL of an 80% methanol: 20% water mixture at dry ice temperature. The plates were incubated on dry ice for 15 minutes before the cell material was scraped into eppendorf tubes pre-chilled on ice. The cell debris was pelleted by centrifugation at 13,000 RCF for 5 minutes at 4°C and the supernatant was transferred to a fresh tube and stored on dry ice until analysis. Just prior to analysis, 500 μL of extract was dried under nitrogen gas flow and then resuspended in 100 μL water.
The complete platform consists of an Accela 1250 HPLC system, Accela Open Autosampler, MayLab Mistraswitch column oven and Exactive orbitrap mass spectrometer, controlled by the Xcalibur 3.0.63 software package. Chromatography was performed with a Phenomenex Synergi Hydro-RP column (100 × 2 mm, 2.5 μm particle size). Solvent A is 10 mM tributylamine and 15 mm acetic acid in water; Solvent B is methanol. The gradient is: 0 min, 0% B; 2.5 min, 0% B; 5 min, 20% B; 7.5 min, 20% B; 13 min, 55% B; 15.5 min, 95% B; 18.5 min, 95% B; 19 min, 0% B; 25 min, 0% B. The injection volume was 10 μL. The column temperature was set to 40° C, and the flow rate was 200 μL/min. The Exactive was operated in negative ionization mode with an electrospray ionization interface. The instrument parameters are as follows: sheath gas flow rate 30 (arbitrary units), aux gas flow rate 10 (arbitrary units), sweep gas flow rate 3 (arbitrary units), spray voltage 3 kV, capillary temperature 325°C, capillary voltage −25 V, tube lens voltage −50 V. The scan range was set to 80–1000 m/z, with a maximum inject time of 250 ms, resolution of 100,000 at 1 Hz, and AGC (automatic gain control) target 1E6. The data were analyzed using the MAVEN software suite57 with signal intensity determined as the Peak Area (Top). For metabolic labeling experiments, the data were corrected to account for the natural abundance of nitrogen-15 using IsoCorrectoR34.
Cell viability assay
Viable cells were measured using Cell Counting Kit-8 (CCK-8, Dojindo) as previously described35, 36. Briefly, cells were seeded onto 96-well plates at a density of 2 × 10⁴ per well. The next day, cells were treated with GPX4 or DHODH inhibitors for 4 hours. Subsequently, cells exposed to 10 μl CCK-8 reagent (100 μl medium per well) for 1 hour at 37 °C, 5% CO2 in an incubator. The absorbance at a wavelength of 450 nm was determined using a FLUOstar Omega microplate reader (BMG Labtech).
Cell death assay
Cell death was measured by propidium iodide (Roche) staining using a flow cytometer, as previously described37, 38. For propidium iodide-staining, cells were seeded at a density of 50% confluence into 12-well plates. The next day, cells were treated with different reagents. To measure cell death, the cells were collected (including floating dead cells), stained with 5 μg/ml propidium iodide and the percentage of the propidium iodide-positive dead cell population was analyzed using the flow cytometer BD Accuri C6 (BD Biosciences) and an FL2 detector. A minimum of 10,000 single cells were analyzed per well and all experiments were carried out at least in triplicate.
Lipid peroxidation measurement
Cells were seeded on 12-well plates and incubated overnight. The next day, cells were treated with compounds for the indicated times, harvested by trypsinization and resuspended in 200 μl PBS containing 5 μM C11-BODIPY 581/591 (Invitrogen). Cells were incubated for 30 min at 37 °C in a water bath. Lipid peroxidation was assessed using the flow cytometer BD Accuri C6 with a 488 nm laser on an FL1 detector. A minimum of 10,000 single cells were analyzed per well.
DHODH activity measurement
DHODH activity was determined spectrophotometrically at 37 °C by monitoring the decrease in absorbance at 600 nm of reduced 2,6-dichlorophenol-indophenol (DCPIP) as previously described39. Briefly, the reaction was initiated with 20 mM DHO in 1 ml of standard reaction buffer supplemented with 50 μM DCPIP, 2 μg of rotenone, 2 μg of antimycin A, 5 mM NaN3 and 0.1 mg of whole-cell lysate. The data were expressed as nmol min−1 μg−1 of protein.
Glutathione measurement
Glutathione level measurement was performed as previously described4. 1 × 10⁵ cells per well were seeded into 6-well dishes. Cells were treated with drugs for 2 hours. Cells were collected by scraping and prepared for measurement of glutathione using the Glutathione Assay Kit (Cayman Chemical) according to the protocol. The GSH and GSSG concentrations were calculated using a standard curve and normalized to the total protein level.
CoQ and CoQH2 analysis
Ubiquinone (CoQ) and ubiquinol (CoQH2) were extracted from cultured cells using a modified version of the method developed by Nagase et al. to analyze CoQ and CoQH2 in cerebrospinal fluid40. Briefly, cells were first grown on 35 mm plates to approximately 70% confluence. The cells were then quickly washed once in 1 mL of room temperature, serum-free culture medium to remove serum-derived CoQ and CoQH2 with minimal metabolic perturbation to the cells. 600 μL of freshly prepared, ice-cold isopropanol containing 100 μM tert-butyl-hydroquinone was added to the plates, which were then placed on a cold plate on ice. The cells were scraped with a cell lifter and the cell suspension transferred to Eppendorf tubes on ice. After briefly vortexing, the tubes were clarified by centrifugation at 13,000 RCF at 4° C for 5 minutes and the supernatants transferred to fresh tubes. These extracts were stored on dry ice in the dark until analysis by LC-MS. The relative levels of CoQ and CoQH2 in these conditions were stable for at least 48 hours. CoQ and CoQH2 levels were determined by LC-MS using an analytical method derived from the lipidomics method as previously described41. The extracts were transferred to amber glass sample vials in an autosampler maintained at 4° C. Separation was performed on a Thermo Scientific UltiMate 3000 HPLC system using an Acquity UPLC HSS T3 column (2.1×100 mm, 1.8 μm particle size). Mobile phase A consisted of acetonitrile:water (60:40, v/v) with 10 mM ammonium acetate and 0.1% acetic acid; mobile phase B consisted of isopropanol:acetonitrile:water (85:10:5, v/v/v) with 10 mM ammonium acetate and 0.1% acetic acid. The gradient was 0 min, 40% B; 1.5 min, 40% B; 12 min, 100% B; 15 min, 100% B; 16 min, 40% B; 17 min, 40% B. The injection volume was 10 μL. The column temperature was set to 55° C, and the flow rate was 400 μL/min.
Samples were analyzed by an Exactive orbitrap mass spectrometer in positive ionization mode with a heated electrospray ion source. The instrument parameters are as follows: sheath gas flow rate 30 (arbitrary units), aux gas flow rate 10 (arbitrary units), sweep gas flow rate 3 (arbitrary units), spray voltage 4 kV, capillary temperature 120°C, heater temperature 500° C, capillary voltage 65 V, tube lens voltage 100 V. The scan range was set to 200–1000 m/z, with a maximum inject time of 100 ms, resolution of 100,000 at 1 Hz, and AGC (automatic gain control) target 1E6. The data were analyzed using the MAVEN software suite 57 with signal intensity determined as the Peak Area (Top). Both CoQ and CoQH2 were detected as their ammonium adducts ([M+NH4]+).
Quantitative Reverse Transcription PCR
qRT-PCR was performed as previously described42, 43. Briefly, total RNA was extracted using TRIzol reagent (15596026, Invitrogen), and cDNA was synthesized with SuperScript II Reverse Transcriptase (18064014, Invitrogen). qRT-PCR was performed using SYBR GreenER qPCR SuperMix Universal (11762500, Invitrogen), and triplicate samples were run on a Stratagene MX3000P qPCR system according to the manufacturer’s protocol. The threshold cycle (Ct) values for each gene were normalized to those of β-actin, and the 2−ΔΔCt method was used for quantitative analysis. Primer sequences are list in Supplementary Table 1.
Immunoblotting
Western blotting to analyze protein expression was performed as previously described44, 45. Briefly, cell pellets and tissues were lysed using IP lysis buffer (Fisher Scientific) and the protein concentration was determined by a Bicinchoninic Acid Protein Assay (Thermo Scientific) using a FLUOstar Omega microplate reader (BMG Labtech). 25 μg of protein was used for immunoblot analysis using antibodies against DHODH (1:1,000, 14877-1-AP, Proteintech), GPX4 (1:1,000, MAB5457, R&D systems), vinculin (1:3,000, V4505, Sigma-Aldrich), SLC7A11 (1:1,000, 12691, Cell Signaling), ACSL4 (1:1,000, sc-271800, Santa Cruz), COQ2 (1:1,000, sc-517107, Santa Cruz Biotechnology), FSP1 (1:1,000, sc-377120, Santa Cruz Biotechnology), and Flag (1:10,000, 66008-3-Ig, Proteintech).
Histology and immunohistochemistry
Fresh tumor tissues were fixed in 10% neutral buffered formalin overnight, washed once with PBS, and stored in 70% ethanol at 4 °C. The tissues were dehydrated and embedded in paraffin by the Research Histology Core Laboratory (MD Anderson Cancer Center) according to standard protocols. Embedded tissues were sectioned at a thickness of 5 μm for H&E or immunohistochemistry (IHC) analysis. IHC analysis was performed as previously described46, 47. Briefly, the primary antibodies, including ki-67 (1:500, 9027s, Cell Signaling Technology), cleaved-caspase 3 (1:500, 9661s, Cell Signaling Technology), or 4-HNE (1:400, ab46545, Abcam) were incubated overnight at 4 °C. Staining was performed using the Vectastain elite ABC kit and DAB peroxidase substrate kit (Vector laboratories). Images were randomly taken from the renal cortex (five images per tumor) at ×200 magnification using an Olympus BX43 microscope.
Cell line-derived xenograft model
All the xenograft experiments were performed in accordance with a protocol approved by the Institutional Animal Care and Use Committee and Institutional Review Board at The University of Texas MD Anderson Cancer Center. The study is compliant with all relevant ethical regulations regarding animal research. Rodent housing conditions used in this study are: temperature set point: 72F; high limit: 74F; low limit: 70F. Humidity set point: 45%; high limit: 55%; low limit: 40%. Light cycle: 12 hour light/dark. Animals were euthanized when the xenograft tumour size reached 1,500 mm3. No mouse exhibited severe loss of body weight (>15%) or evidence of infections or wounds. Female 4- to 6-week-old athymic nude mice (Foxn1nu/Foxn1nu) were purchased from the Experimental Radiation Oncology Breeding Core Facility at MD Anderson Cancer Center and housed in the Animal Care Facility at the Department of Veterinary Medicine and Surgery at MD Anderson. Cancer cell lines were suspended and counted in cold phosphate-buffered saline (PBS), and 5 × 10⁶ HT-1080 or 1 × 10⁷ NCI-H226 cells were injected into mice subcutaneously. When the tumor reached 50–100 mm3, the mice were assigned randomly into different treatment groups. Brequinar or sulfasalazine was dissolved in dimethyl sulfoxide (DMSO) and diluted in PBS. Brequinar was intraperitoneally injected into mice at a dose of 30mg/kg every three days. Sulfasalazine was intraperitoneally injected daily at a dose of 100 mg/kg. Liproxstatin-1 diluted in PBS was intraperitoneally injected daily at a dose of 10 mg/kg. The daily injection of brequinar, sulfasalazine, or liproxstatin-1 was continued until the endpoint as indicated in the corresponding figures. The tumor volume was measured every 3 days until the endpoint and calculated according to the equation volume = length × width2 × 1/2.
Patient-derived xenograft (PDX) model
PDXs were generated in accordance with protocols approved by the Institutional Review Board at The University of Texas MD Anderson Cancer Center. Informed consent was obtained from the patients and the study is compliant with all relevant ethical regulations regarding research involving human participants. Rodent housing conditions used in this study are: temperature set point: 72F; high limit: 74F; low limit: 70F. Humidity set point: 45%; high limit: 55%; low limit: 40%. Light cycle: 12 hour light/dark. Animals were euthanized when the xenograft tumour size reached 1,500 mm3. No mouse exhibited severe loss of body weight (>15%) or evidence of infections or wounds. All the NOD scid gamma (NSG) mice were purchased from the Experimental Radiation Oncology Breeding Core Facility at MD Anderson Cancer Center and housed in the Animal Care Facility at the Department of Veterinary Medicine and Surgery at MD Anderson Cancer Center. PDX model used in this study was originally obtained from lung cancer PDX platform at MD Anderson Cancer Center. PDX experiments were performed as previously described33. Briefly, PDX tumors in cold DMEM media were minced into fragments 1–2 mm3 in volume. Then each PDX tumor fragment was subcutaneously inoculated into the dorsal flank of NSG mice. When the tumors reached 50–100 mm3 in volume, the mice were assigned randomly into different treatment groups for the treatment of brequinar, sulfasalazine, and/or liproxstatin-1 as described under cell line-derived xenograft model. The tumor volume was measured every 3 days until the endpoint and calculated according to the equation volume = length × width2 × 1/2.
Statistics and reproducibility
Results of cell culture experiments were collected from at least 3 independent replicates. Volumes or weights from at least 6 tumor in each group were plotted. Data are presented as means ± standard deviation (SD). Statistical significance (P values) was calculated using unpaired Student’s t-tests or log-rank test by GraphPad Prism 8.0 or SPSS 25.0. *P < 0.05; **P < 0.01; ***P < 0.001; ****P < 0.0001; ns., non-significant.
Extended Data
Extended Data Fig. 1. Pharmacologic inhibition of GPX4 affects intermediate levels in the de novo pyrimidine biosynthesis pathway.
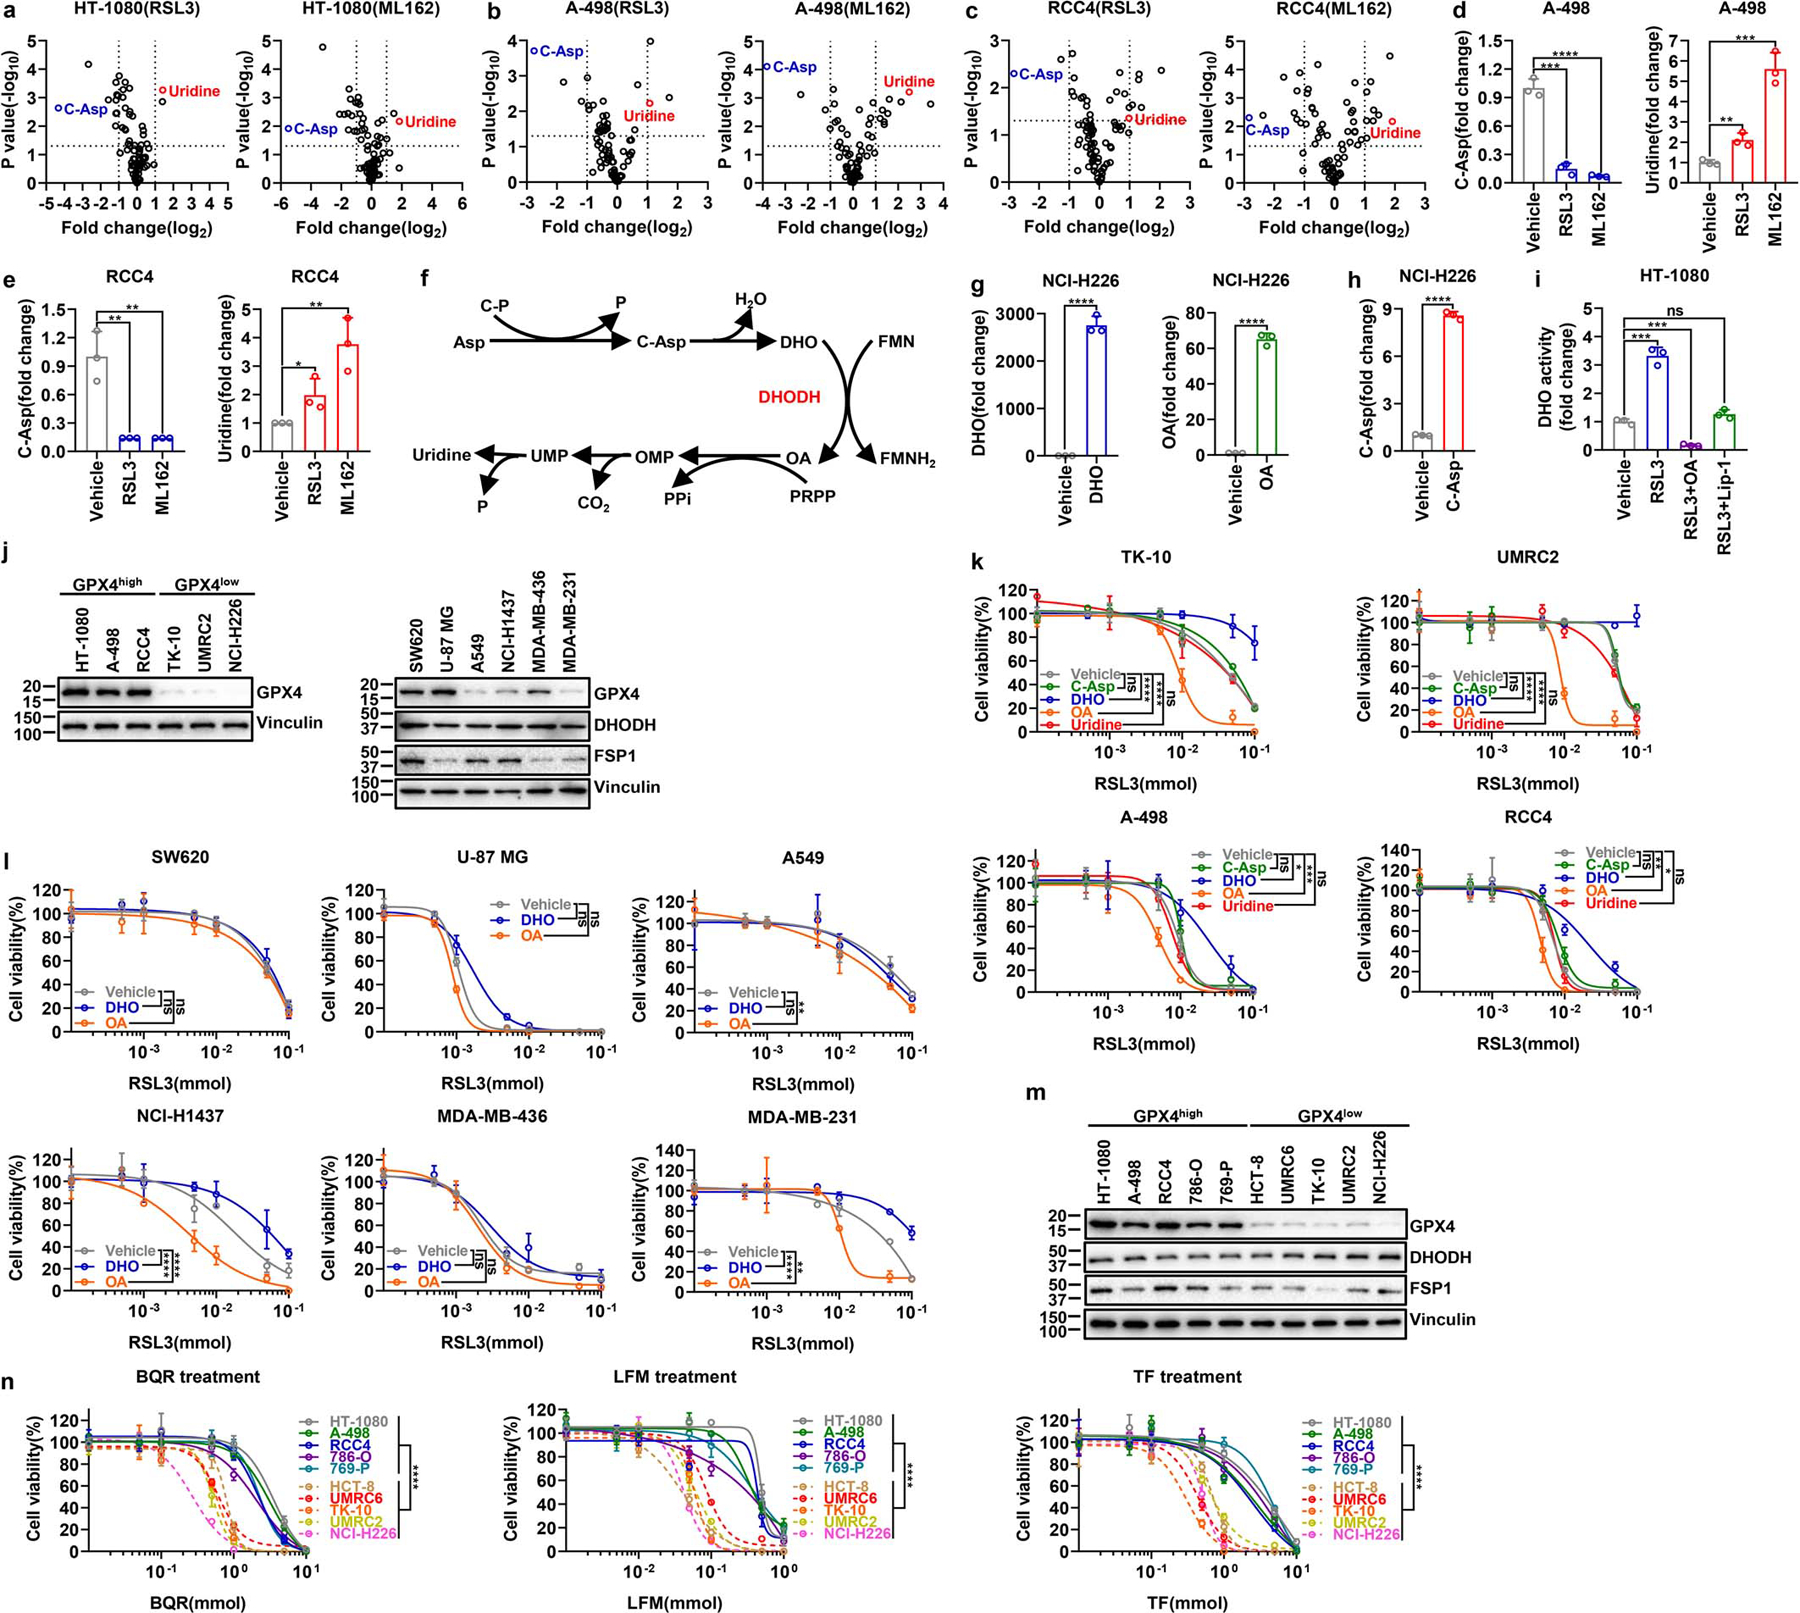
a-c, Volcano plots comparing metabolomic profiles from HT-1080(a), A-498 (b) or RCC4 (c) cells treated with vehicle and the same cells treated with RSL3 (10 μM) or ML162 (10 μM) for 2 hours. d, e, Bar graph showing the fold changes in C-Asp and uridine induced by RSL3 (10 μM) or ML162 (10 μM) treatment for 2 hours compared with vehicle treatment in A-498 (d) or RCC4 (e) cells. f, Simplified schematic of de novo pyrimidine biosynthesis pathway. g, Bar graph showing the fold changes in intracellular DHO or OA levels upon treatment with vehicle, DHO (100 μM) or OA (100 μM), respectively, for 48 hours in NCI-H226 cells. h, Bar graph showing the fold changes in intracellular C-Asp levels upon treatment with vehicle or C-Asp (100 μM) for 48 hours in NCI-H226 cells. i, DHO activity measurement in HT-1080 cells treated with RSL3 (10 μM) for 2 hours, following pretreatment with vehicle, OA (100 μM) for 24 hours, or Lip-1 (10 μM) for 48 hours. j, GPX4 protein levels in different cell lines were determined by western blotting. k, Cell viability measurement in TK-10, UMRC2, A-498 or RCC4 cells treated with different doses of RSL3 for 4 hours, following pretreatment with vehicle, C-Asp (100 μM), DHO (100 μM), OA (100 μM), or uridine (50 μM) for 48 hours. l, Cell viability measurement in SW620, U-87 MG, A549, NCI-H1437, MDA-MB-436 or MDA-MB-231 cells treated with different doses of RSL3 for 4 hours, following pretreatment with vehicle, DHO (100 μM) or OA (100 μM) for 48 hours. m, GPX4, DHODH, and FSP1 protein levels in different cancer cell lines were determined by western blotting. n, Cell viability measurement in GPX4high (HT-1080, A-498, RCC4, 786-O, and 769-P) and GPX4low (HCT-8, UMRC6, TK-10, UMRC2, and NCI-H226) cells treated with different doses of DHODH inhibitors BQR, LFM, or TF for 4 hours. Data are presented as mean values +/− SD, n = 3 independent repeats (a-e, g-i, k, l, n). Statistical analysis was performed using unpaired, two-tailed t-test. Western blot is representative of two biological replicates (j, m). *P < 0.05, **P < 0.01, ***P < 0.001, ****P < 0.0001. Asp, aspartate; C-P, carbamoyl phosphate; P, phosphate; C-Asp, N-Carbamoyl-L-aspartate; DHO, dihydroorotate; FMN, flavin mononucleotide; FMNH2, reduced flavin mononucleotide; OA, orotate; PRPP, phosphoribosyl pyrophosphate; PPi, inorganic pyrophosphate; OMP, orotidine 5'-monophosphate; CO2, carbon dioxide; UMP, uridine 5'-monophosphate; BQR, brequinar; LFM, leflunomide; TF, teriflunomide.
Extended Data Fig. 2. The effect of DHODH inhibitors on inducing ferroptosis in different cancer cells with differential expression of GPX4.
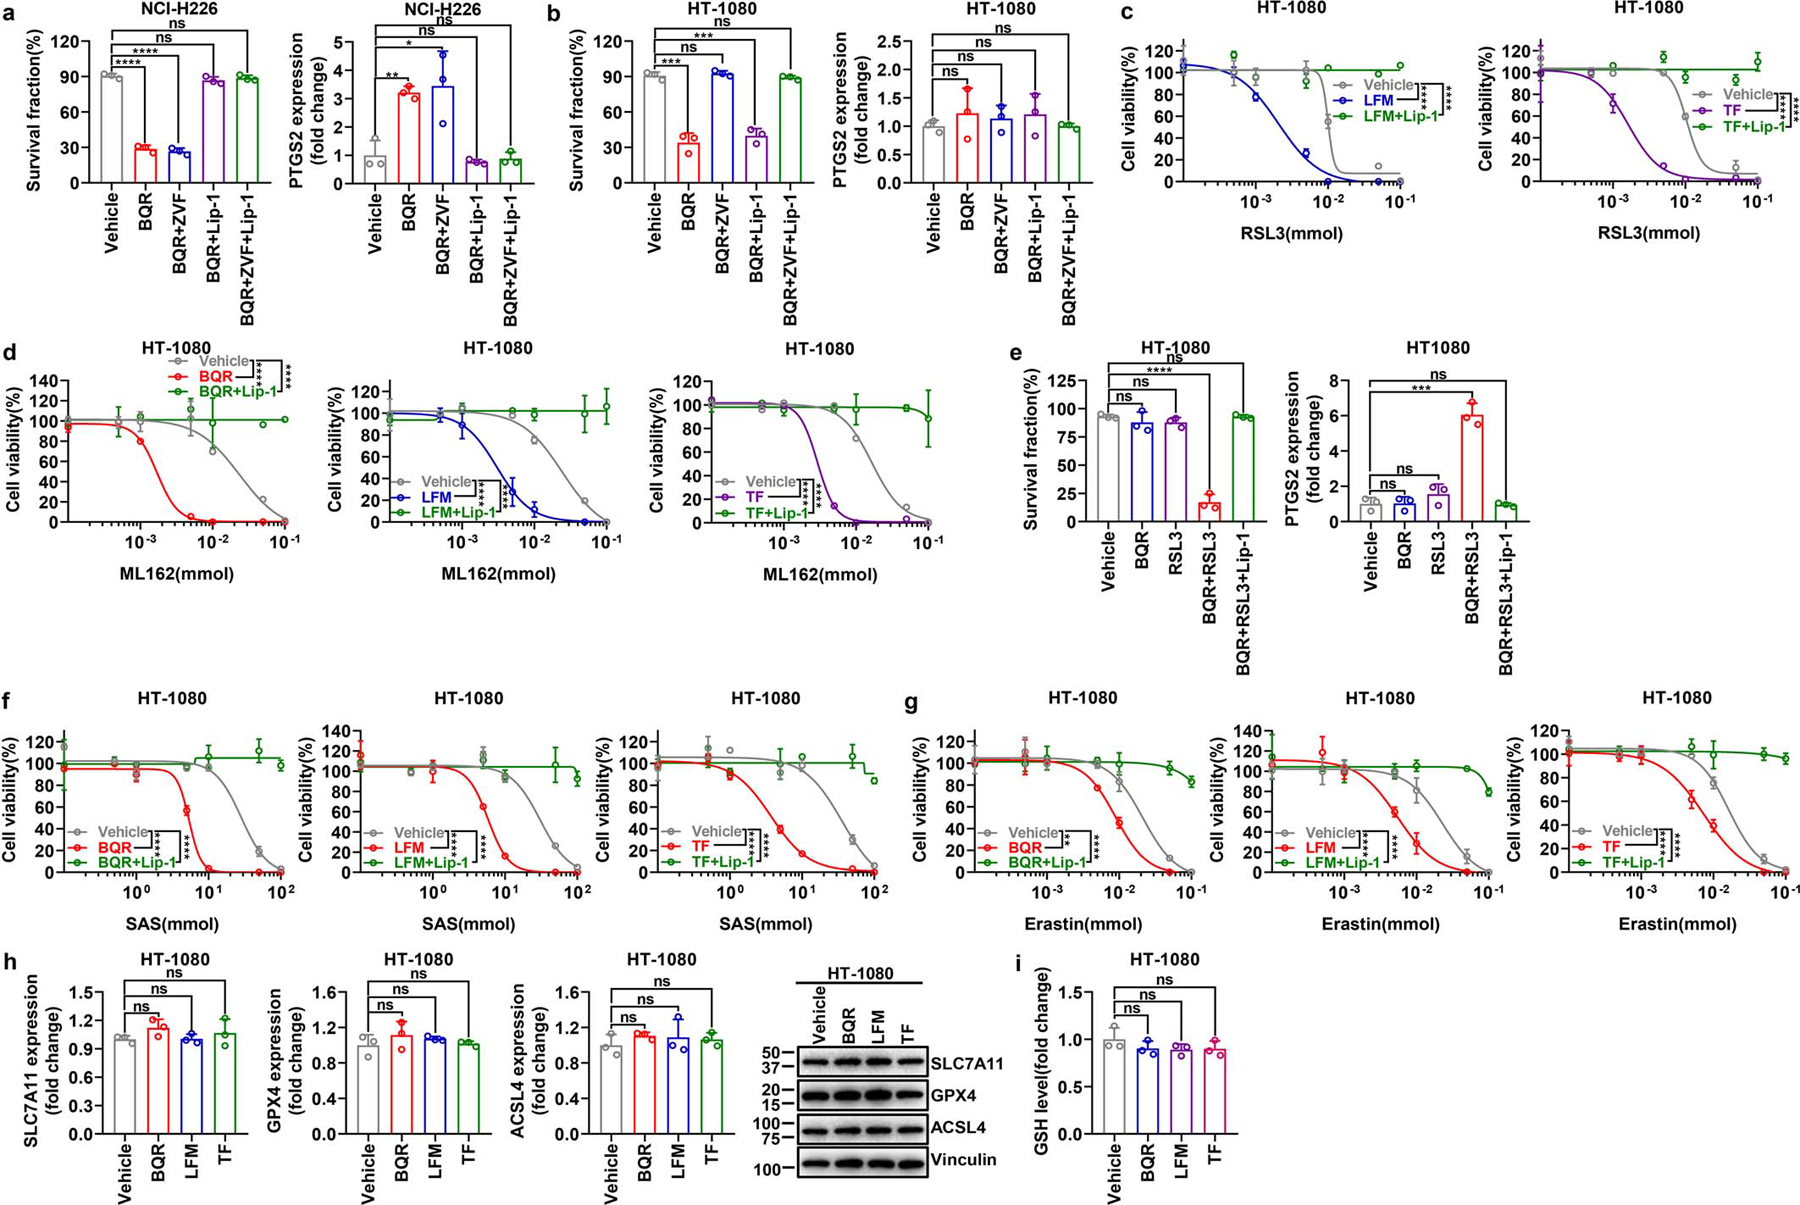
a, b, Measurement of cell survival fraction and PTGS2 mRNA levels in NCI-H226 (a) or HT-1080 (b) cells upon treatment with BQR (500 μM for NCI-H226 cells; 5 mM for HT-1080 cells), following pretreatment with vehicle, ZVF (10 μM), and/or Lip-1 (10 μM) for 24 hours. c, Cell viability measurement in HT-1080 cells treated with different doses of RSL3 and co-treatment with LFM (100 μM) or TF (500 μM) for 4 hours, following pretreatment with vehicle or Lip-1 (10 μM) for 24 hours. d, Cell viability measurement in HT-1080 cells treated with different doses of ML162 and co-treatment with BQR (500 μM), LFM (100 μM), or TF (500 μM) for 4 hours, following pretreatment with vehicle or Lip-1 (10 μM) for 24 hours. e, Measurement of cell survival fraction and PTGS2 mRNA levels in HT-1080 cells upon treatment with RSL3 (1 μM) and/or BQR (500 μM) for 4 hours, following pretreatment with vehicle or Lip-1 (10 μM) for 24 hours. f, Cell viability measurement in HT-1080 cells treated with different doses of SAS and co-treatment with BQR (500 μM), LFM (100 μM) or TF (500 μM) for 4 hours, following pretreatment with vehicle or Lip-1 (10 μM) for 24 hours. g, Cell viability measurement in HT-1080 cells treated with different doses of erastin and co-treatment with BQR (500 μM), LFM (100 μM) or TF (500 μM) for 4 hours, following pretreatment with vehicle or Lip-1 (10 μM) for 24 hours. h, mRNA levels of SLC7A11, GPX4, or ACSL4, as well as their protein levels were measured in HT-1080 cells treated with BQR (500 μM), LFM (100 μM), or TF (500 μM) for 4 hours. i, GSH level measurement in HT-1080 cells upon treatment with BQR (500 μM), LFM (100 μM), or TF (500 μM) for 2 hours. Data are presented as mean values +/− SD, n = 3 independent repeats (a-i). Statistical analysis was performed using unpaired, two-tailed t-test. Western blot is representative of two biological replicates (h). *P < 0.05, **P < 0.01, ***P < 0.001, ****P < 0.0001. BQR, brequinar; LFM, leflunomide; TF, teriflunomide; ZVF, N-benzyloxycarbonyl-val-ala-asp(o-me) fluoromethyl ketone; Lip-1, liproxstatin-1; SAS, sulfasalazine; GSH, glutathione.
Extended Data Fig. 3. DHODH deletion sensitizes GPX4high cancer cells to ferroptosis or induces ferroptosis in GPX4low cancer cells.
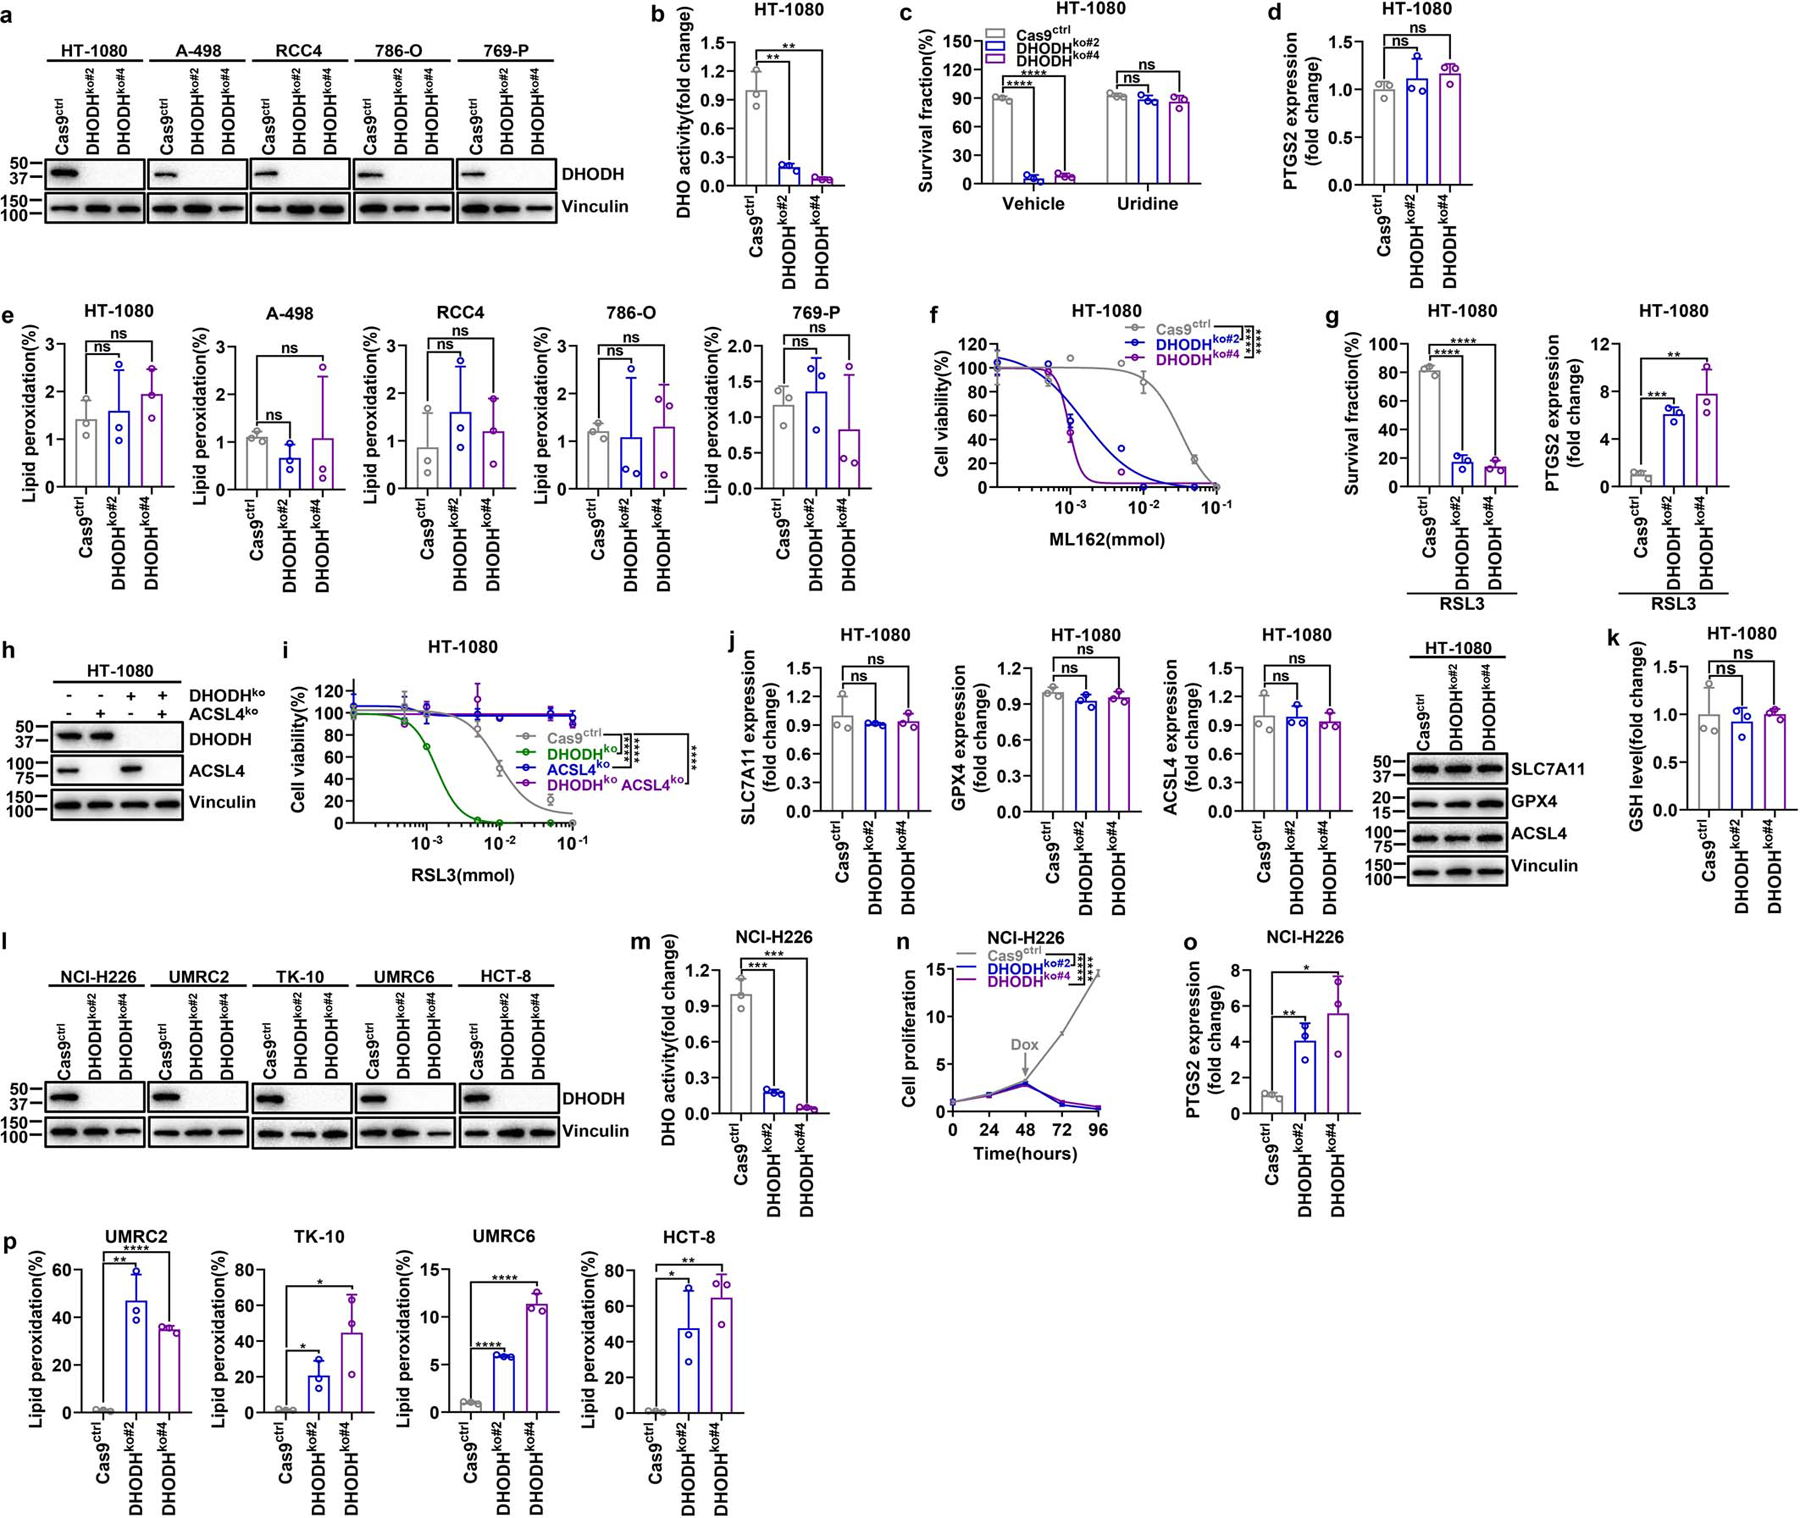
a, DHODH protein levels in Cas9ctrl and DHODHko GPX4high cancer cell lines. b, DHO activity measurement in Cas9ctrl and DHODHko HT-1080 cells. c, Measurement of cell survival fraction in Cas9ctrl and DHODHko HT-1080 cells upon treatment with vehicle or uridine (50 μM). d, PTGS2 mRNA measurement in Cas9ctrl and DHODHko HT-1080 cells. e, Lipid peroxidation measurement in Cas9ctrl and DHODHko GPX4high cell lines as indicated. f, Cell viability measurement in Cas9ctrl and DHODHko HT-1080 cells treated with different doses of ML162 for 4 hours. g, Measurement of cell survival fraction and PTGS2 mRNA levels in Cas9ctrl and DHODHko HT-1080 cells upon treatment with RSL3 (1 μM) for 4 hours. h, Western blot analysis of DHODH and ACSL4 protein levels in HT-1080 cells with indicated genotypes. i, Cell viability measurement in HT-1080 cells with indicated genotypes treated with different doses of RSL3 for 4 hours. j, Measurement of SLC7A11, GPX4, or ACSL4 mRNA levels as well as their protein levels in Cas9ctrl and DHODHko HT-1080 cells. k, GSH levels measurement in Cas9ctrl and DHODHko HT-1080 cells. l, DHODH protein levels in Cas9ctrl and DHODHko GPX4low cell lines. m, DHO activity measurement in Cas9ctrl and DHODHko NCI-H226 cells. n, Cell proliferation measurement of Cas9ctrl and DHODHko NCI-H226 cells. o, Measurement PTGS2 mRNA levels in Cas9ctrl and DHODHko NCI-H226 cells. p, Lipid peroxidation measurement of Cas9ctrl and DHODHko GPX4low cells. Cells were grown in medium supplemented with Lip-1 (10 μM) (l, m) and/or uridine (50 μM) (a, b, d-p). Data are presented as mean values +/− SD, n = 3 independent repeats (b-g, i-k, m-p). Statistical analysis was performed using unpaired, two-tailed t-test. Western blot is representative of two biological replicates (a, h, j, l). *P < 0.05, **P < 0.01, ***P < 0.001, ****P < 0.0001. CTRP, Cancer Therapeutics Response Portal; DHO, dihydroorotate; GSH, glutathione.
Extended Data Fig. 4. Analyses of genetic interactions between DHODH and GPX4 (or FSP1).
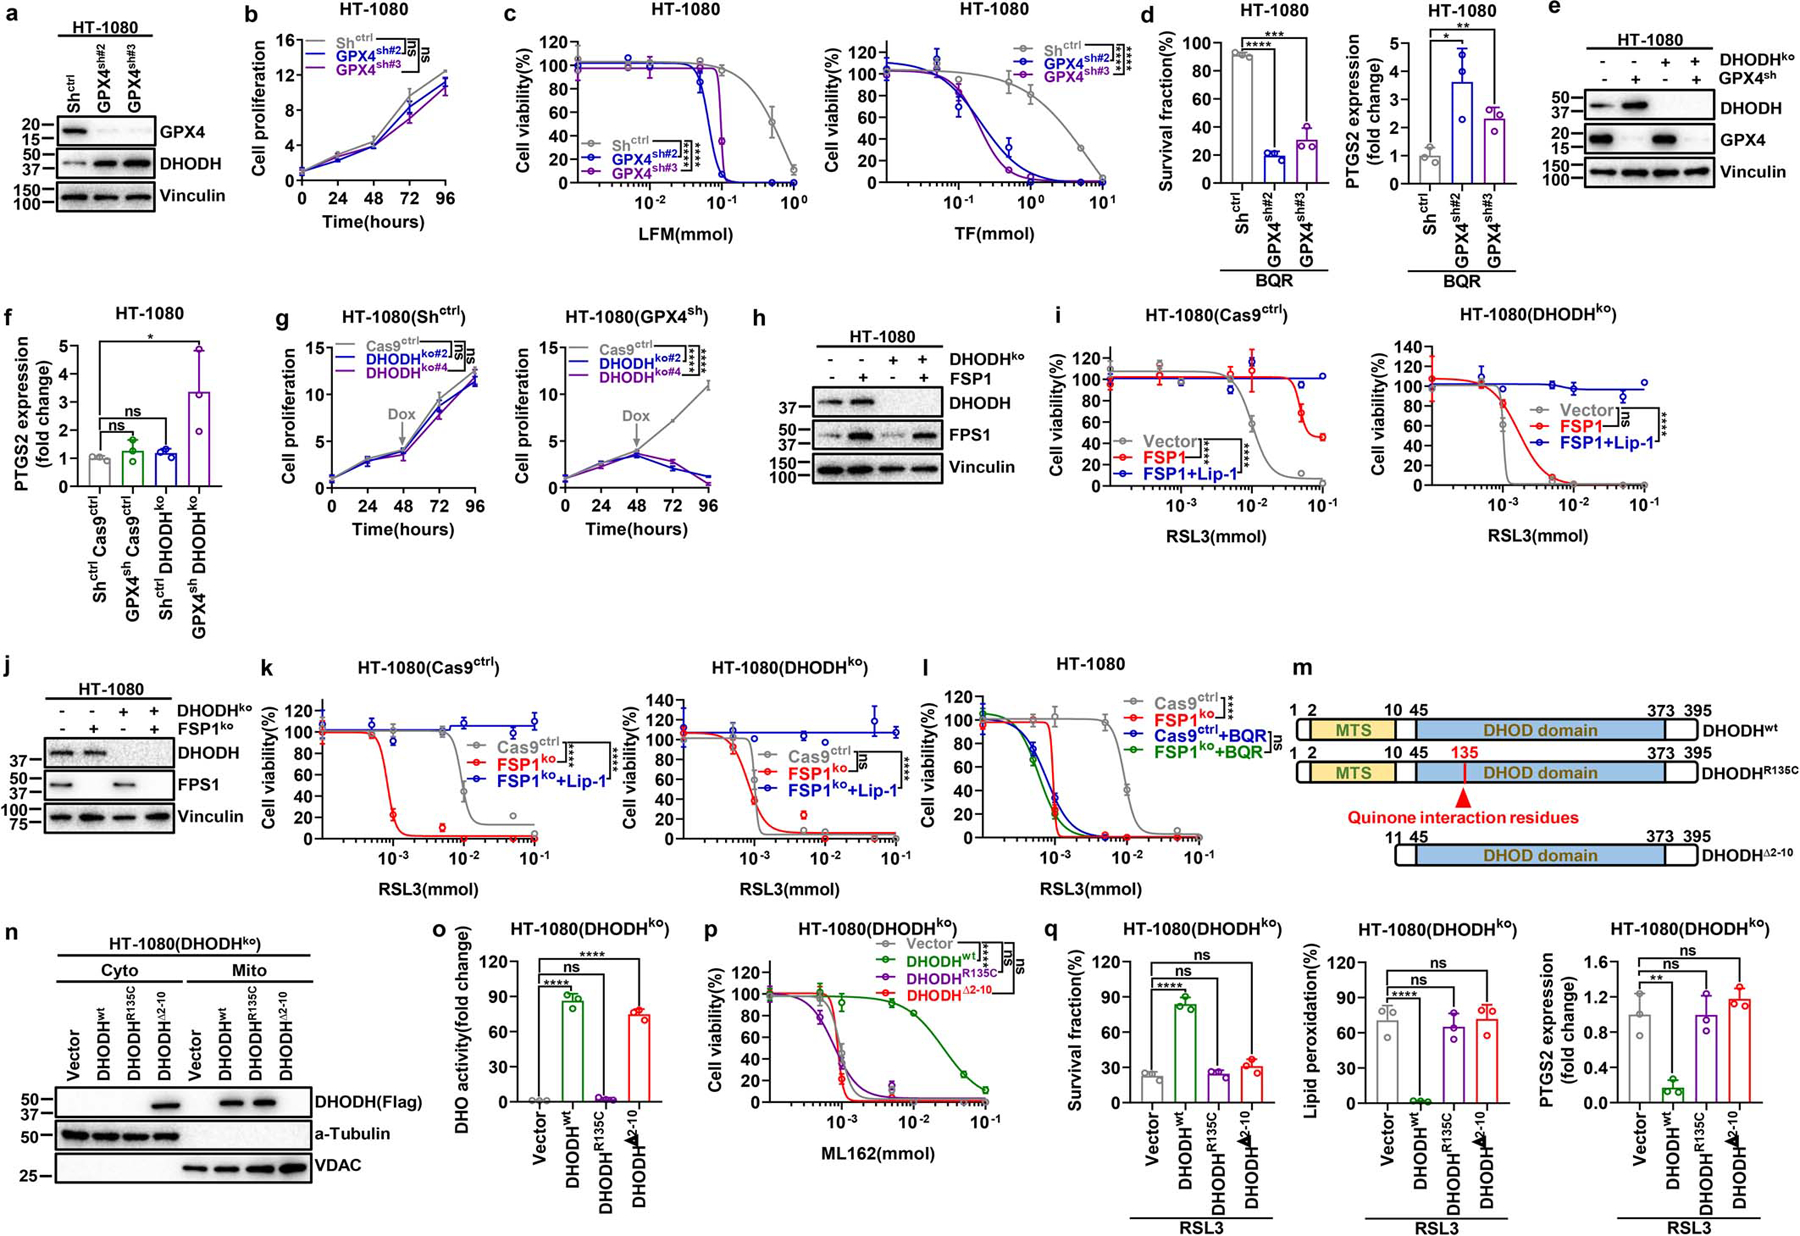
a, Western blotting analysis of GPX4 and DHODH protein levels in Shctrl and GPX4sh HT-1080 cells. b, Cell proliferation measurement of Shctrl and GPX4sh HT-1080 cells. c, Cell viability measurement of Shctrl and GPX4sh HT-1080 cells treated with different doses of LFM or TF for 4 hours. d, Measurement of cell survival fraction and PTGS2 mRNA levels in Shctrl and GPX4sh HT-1080 cells upon treatment with BQR (500 μM) for 4 hours. e, Western blot analysis of GPX4 and DHODH protein levels in HT-1080 cells with indicated genotypes. f, Measurement of PTGS2 mRNA levels in HT-1080 cells with indicated genotypes. g, Cell proliferation measurement of DHODHko in Shctrl or GPX4sh HT-1080 cells. h, Western blot analysis of DHODH and FSP1 protein levels in HT-1080 cells with indicated genotypes. i, Cell viability measurement in Cas9ctrl or DHODHko HT-1080 cells with indicated genotypes treated with different doses of RSL3 for 4 hours, following pretreatment with vehicle or Lip-1 (10 μM) for 24 hours. j, Western blot analysis of DHODH and FSP1 protein levels in HT-1080 cells with indicated genotypes. k, Cell viability measurement in Cas9ctrl or DHODHko HT-1080 cells with indicated genotypes treated with different doses of RSL3 for 4 hours, following pretreatment with vehicle or Lip-1 (10 μM) for 24 hours. l, Cell viability measurement in Cas9ctrl or FSP1ko HT-1080 cells treated with vehicle or BQR (500 μM), and different doses of RSL3 for 4 hours. m, Simplified schematic of DHODH protein and its mutants as indicated. n, Western blotting showing DHODH protein levels in cytosolic and mitochondrial fractions from DHODHko HT-1080 cells that express the indicated DHODH constructs. o, DHO activity measurement in DHODHko HT-1080 cells that express the indicated DHODH constructs. p, Cell viability measurement in DHODHko HT-1080 cells that express the indicated DHODH constructs treated with different doses of ML162 for 4 hours. q, Measurement of cell survival fraction, lipid peroxidation and PTGS2 mRNA levels in DHODHko HT-1080 cells that express the indicated DHODH constructs upon treatment with RSL3 (1 μM). Cells were grown in medium supplemented with uridine (50 μM) (e-l, n-q). Data are presented as mean values +/− SD, n = 3 independent repeats (b-d, f, g, i, k, l, o-q). Statistical analysis was performed using unpaired, two-tailed t-test. Western blot is representative of two biological replicates (a, e, h, j, n). *P < 0.05, **P < 0.01, ***P < 0.001, ****P < 0.0001. LFM, leflunomide; TF, teriflunomide; BQR, brequinar; Lip-1, liproxstatin-1; MTS, mitochondrial targeting sequence; DHOD domain, dihydroorotate dehydrogenase domain; Cyto, cytosolic; Mito, mitochondrial.
Extended Data Fig. 5. DHODH cooperates with mitochondrial GPX4 to suppress ferroptosis.
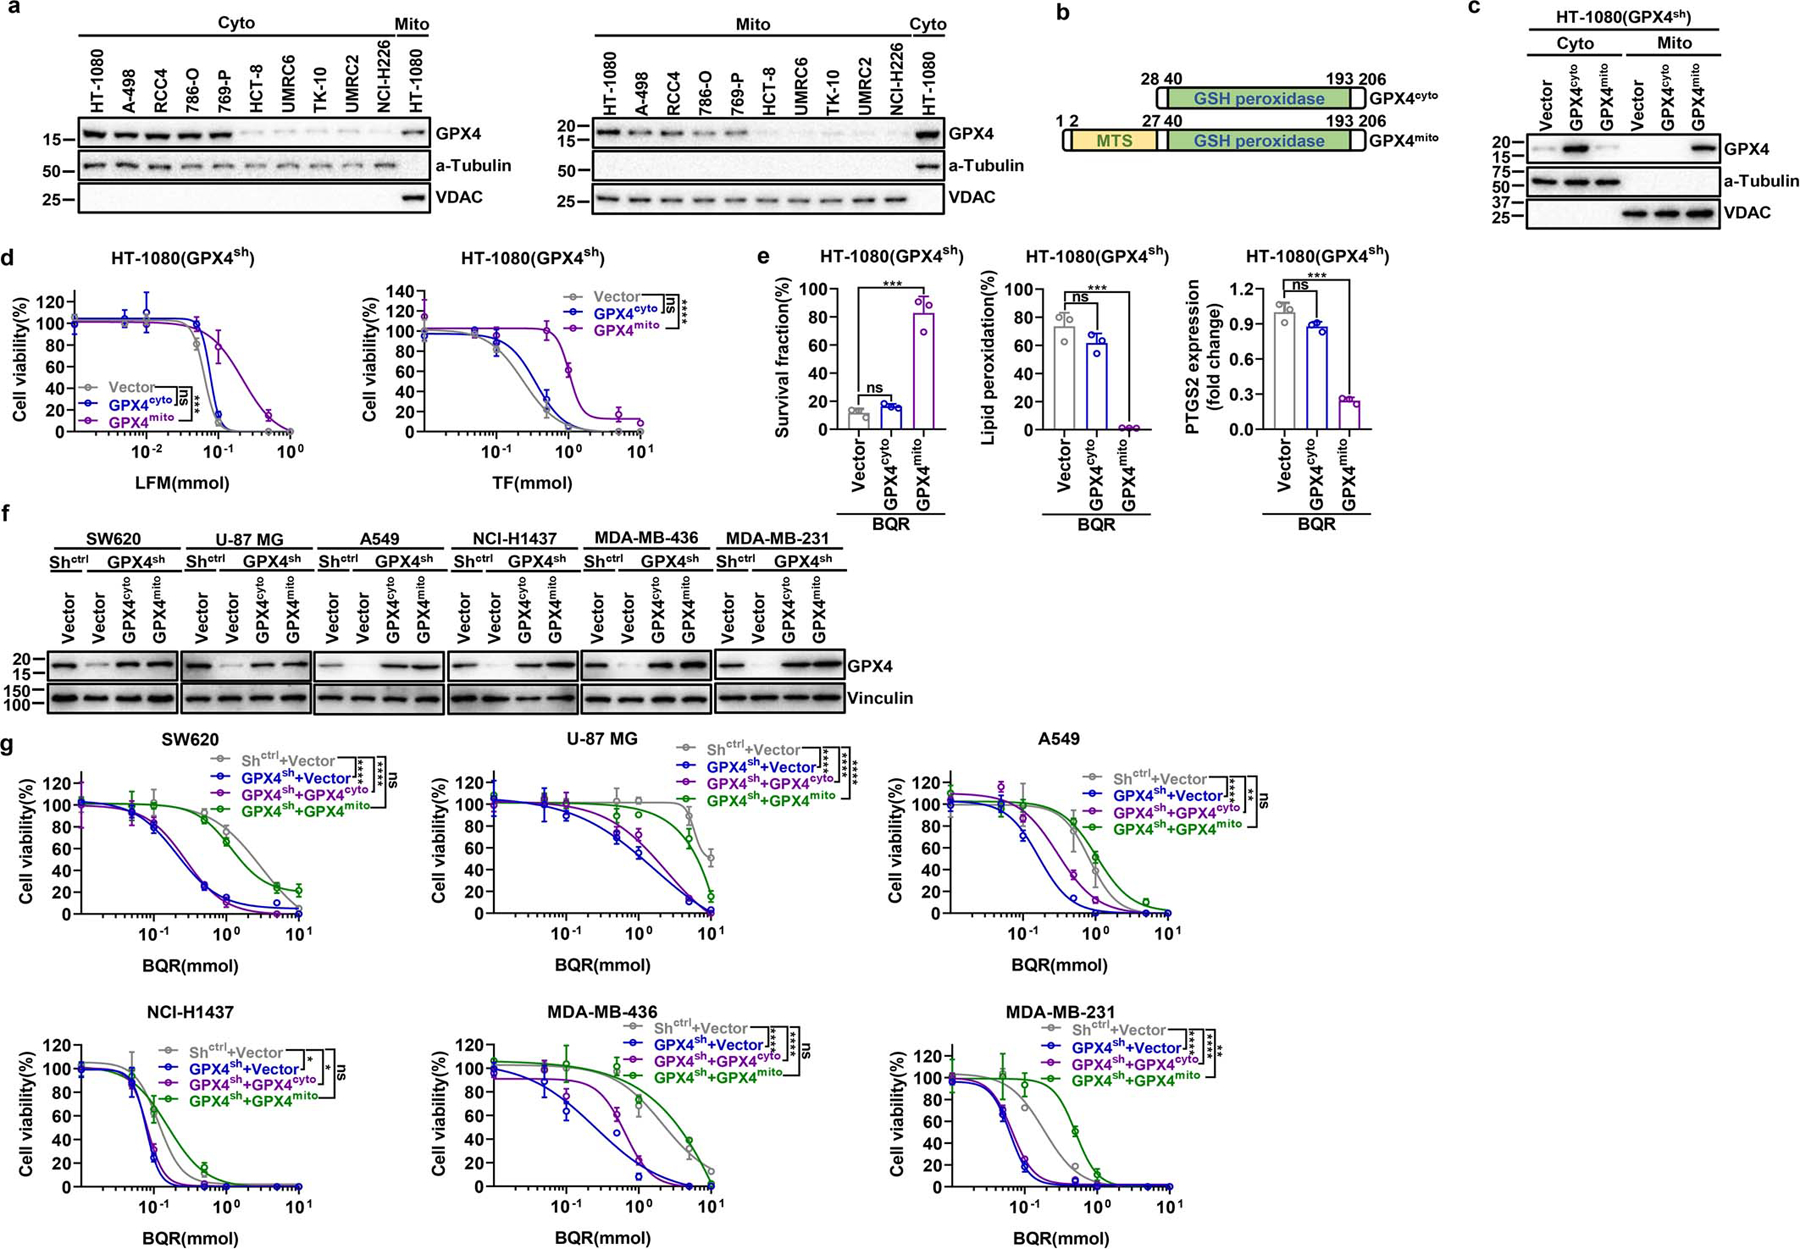
a, Western blotting analyzing GPX4 levels in cytosolic and mitochondrial fractions in a panel of cancer cell lines. b, Simplified schematic of cytosolic and mitochondrial GPX4 protein constructs. c, Western blotting showing GPX4 protein levels in cytosolic and mitochondrial fractions from GPX4sh HT-1080 cells that express the indicated GPX4 constructs. d, Cell viability measurement in GPX4sh HT-1080 cells that express the indicated GPX4 constructs treated with different doses of LFM or TF for 4 hours. e, Measurement of cell survival fraction, lipid peroxidation and PTGS2 mRNA levels in GPX4sh HT-1080 cells that express the indicated GPX4 constructs upon treatment with BQR (500 μM). f, Western blotting showing GPX4 protein levels in GPX4sh cells that express the indicated GPX4 constructs in a variety of cell lines. g, Cell viability measurement in various GPX4sh cells that express the indicated GPX4 constructs treated with different doses of BQR for 4 hours. Data are presented as mean values +/− SD, n = 3 independent repeats (d, e, g). Statistical analysis was performed using unpaired, two-tailed t-test. Western blot is representative of two biological replicates (a, c, f). *P < 0.05, **P < 0.01, ***P < 0.001, ****P < 0.0001. Cyto, cytosolic; Mito, mitochondrial; MTS, mitochondrial targeting sequence; GSH peroxidase, glutathione peroxidase; LFM, leflunomide; TF, teriflunomide; BQR, brequinar.
Extended Data Fig. 6. Inactivation of DHODH and GPX4 induces mitochondrial lipid peroxidation.
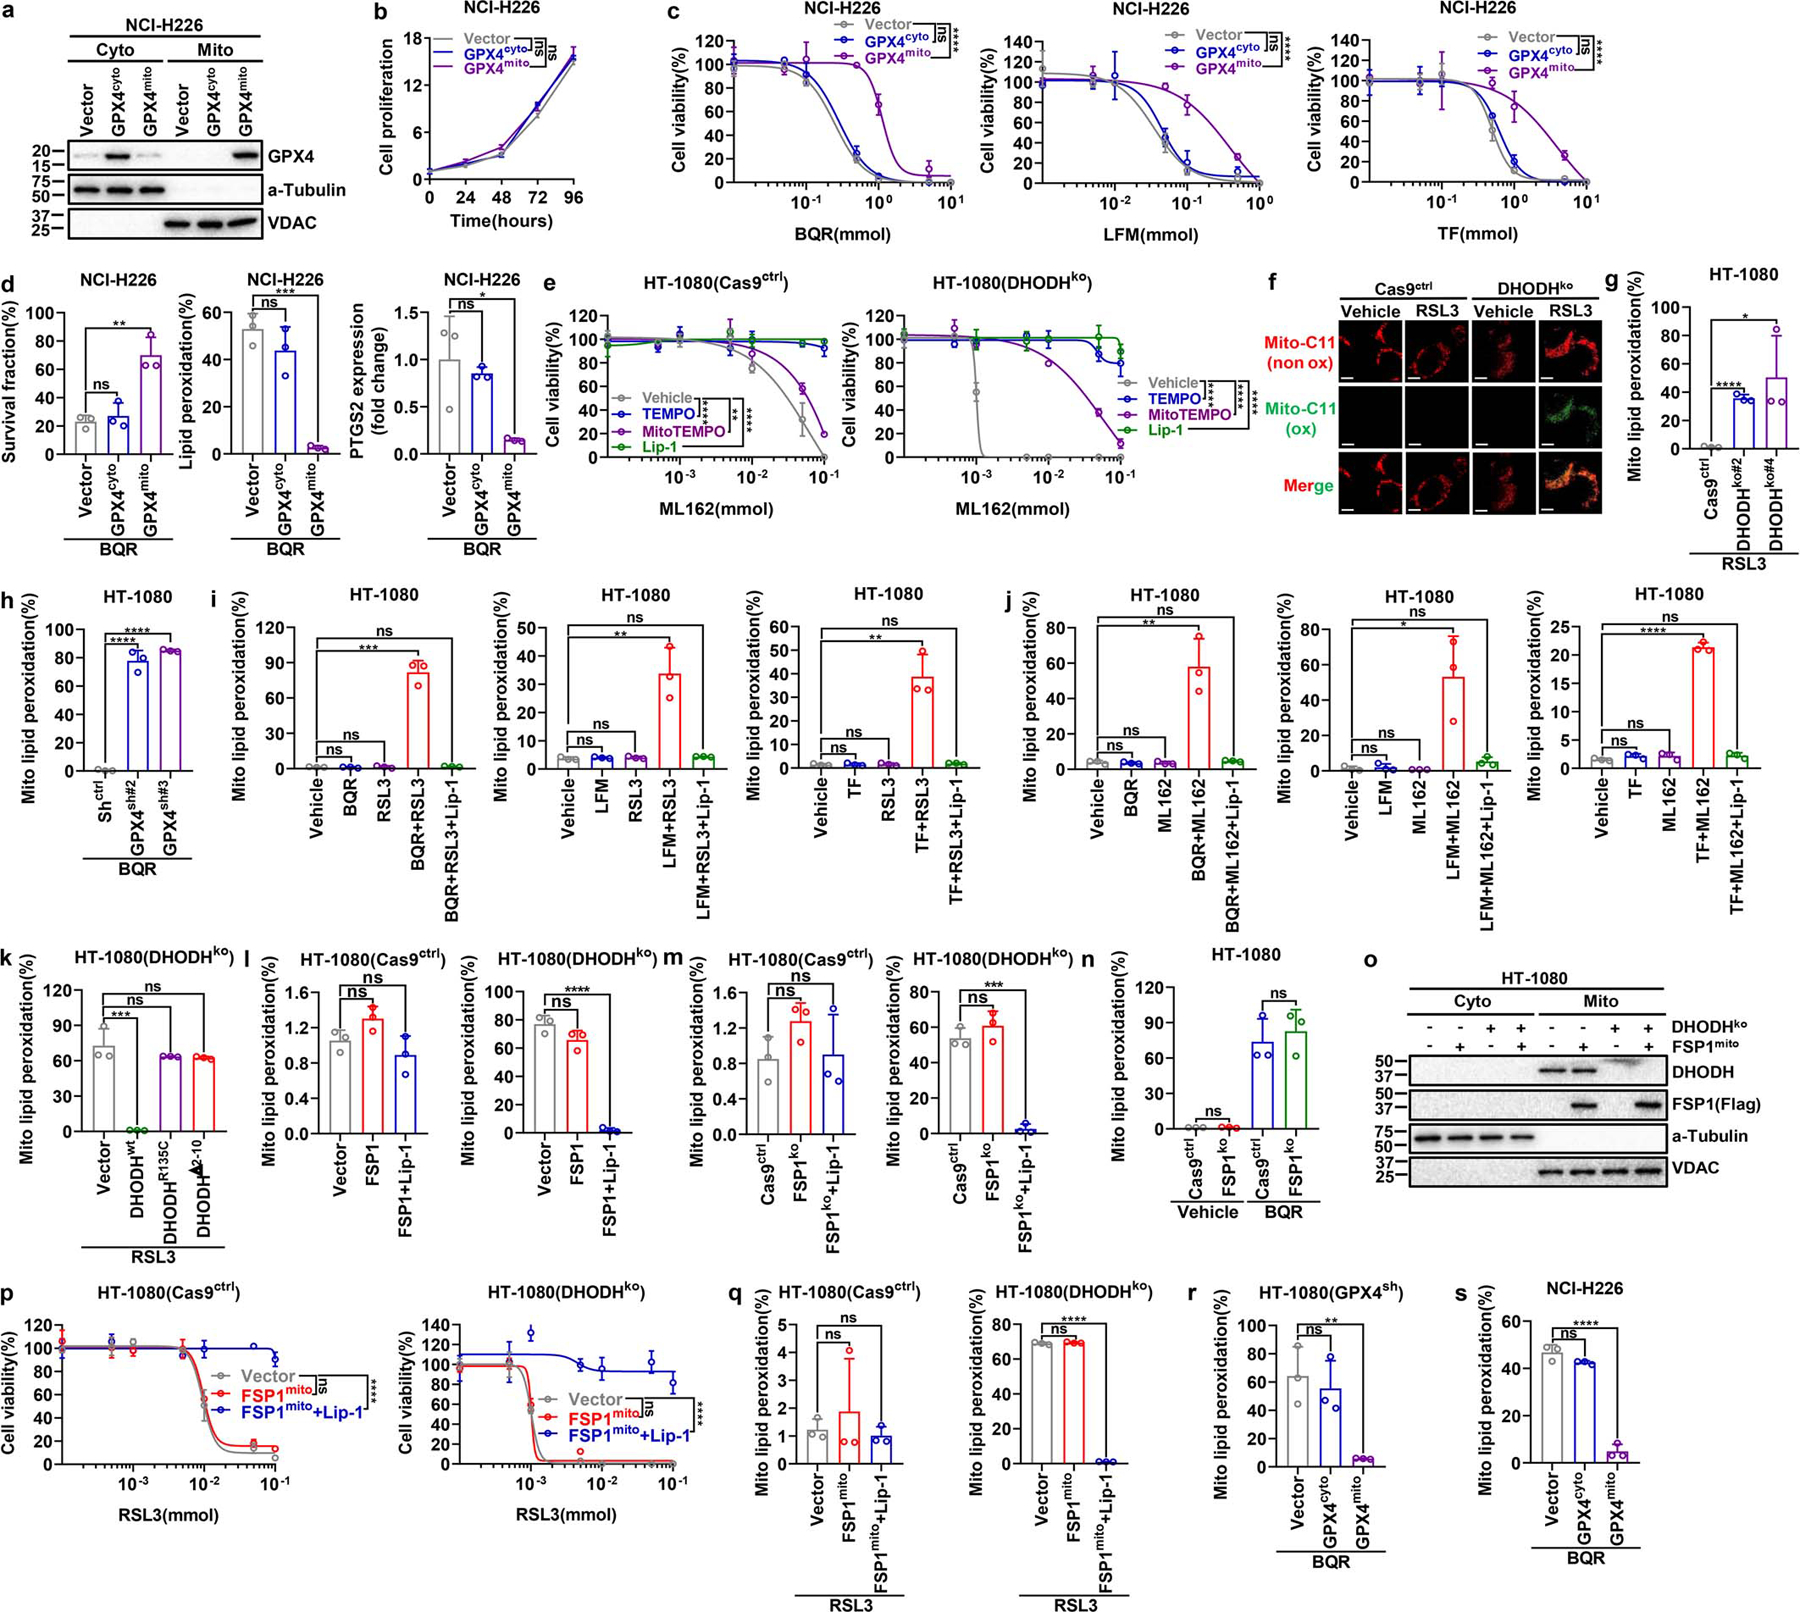
a, Western blot showing GPX4 protein levels in cytosolic and mitochondrial fractions from NCI-H226 cells that express the indicated GPX4 constructs. b, Cell proliferation measurement of NCI-H226 cells that express the indicated GPX4 constructs. c, Cell viability measurement in NCI-H226 cells that express the indicated GPX4 constructs treated with different doses of BQR, LFM or TF for 4 hours. d, Measurement of cell survival fraction, lipid peroxidation and PTGS2 mRNA levels in NCI-H226 cells that express the indicated GPX4 constructs upon treatment with BQR (500 μM). e, Cell viability measurement in Cas9ctrl or DHODHko HT-1080 cells treated with different doses of ML162 for 4 hours, following pretreatment with vehicle, TEMPO (10 μM), MitoTEMPO (10 μM), or Lip-1 (10 μM) for 24 hours. f, Cas9ctrl or DHODHko HT-1080 cells were treated with RSL3 (1 μM) for 2 hours, then stained with mito-BODIPY. Oxidized mito-BODIPY (Green) indicates mitochondrial lipid peroxidation (Scale bar = 5 μM). g, Mitochondrial lipid peroxidation measurement in Cas9ctrl or DHODHko HT-1080 cells upon treatment with RSL3 (1 μM) for 2 hours. h, Mitochondrial lipid peroxidation measurement in Shctrl or GPX4sh HT-1080 cells upon treatment with BQR (500 μM) for 2 hours. i, Mitochondrial lipid peroxidation measurement of HT-1080 cells upon treatment with RSL3 (1 μM) and/or BQR (500 μM), LFM (100 μM), or TF (500 μM) for 2 hours, following pretreatment with vehicle or Lip-1 (10 μM) for 24 hours. j, Mitochondrial lipid peroxidation measurement of HT-1080 cells upon treatment with ML162 (1 μM) and/or BQR (500 μM), LFM (100 μM), or TF (500 μM) for 2 hours, following pretreatment with vehicle or Lip-1 (10 μM) for 24 hours. k, Mitochondrial lipid peroxidation measurement of DHODHko HT-1080 cells that express the indicated DHODH constructs upon treatment with RSL3 (1 μM) for 2 hours. l, m, Mitochondrial lipid peroxidation measurement in Cas9ctrl or DHODHko HT-1080 cells with indicated genotypes upon treatment with RSL3 (1 μM) for 2 hours, following pretreatment with vehicle or Lip-1 (10 μM) for 24 hours. n, Mitochondrial lipid peroxidation measurement in Cas9ctrl or FSP1ko HT-1080 cells upon treatment with RSL3 (1 μM) and/or BQR (500 μM) for 2 hours. o, Western blot analysis of DHODH and FSP1 protein levels in cytosolic (cyto) and mitochondrial (mito) fractions of HT-1080 cells with indicated genotypes. p, Cell viability measurement in Cas9ctrl or DHODHko HT-1080 cells with indicated genotypes treated with different doses of RSL3 for 4 hours, following pretreatment with vehicle or Lip-1 (10 μM) for 24 hours. q, Mitochondrial lipid peroxidation measurement in Cas9ctrl or DHODHko HT-1080 cells with indicated genotypes upon treatment with RSL3 (1 μM) for 2 hours, following pretreatment with vehicle or Lip-1 (10 μM) for 24 hours. r, Mitochondrial lipid peroxidation measurement of GPX4sh HT-1080 cells that express the indicated GPX4 constructs upon treatment with BQR (500 μM) for 2 hours. s, Mitochondrial lipid peroxidation measurement of NCI-H226 cells that express the indicated GPX4 constructs upon treatment with BQR (500 μM) for 2 hours. Cells were grown in medium supplemented with uridine (50 μM) (e-g, k-q). Data are presented as mean values +/− SD, n = 3 independent repeats (b-e, g-n, p-s). Statistical analysis was performed using unpaired, two-tailed t-test. Western blot is representative of two biological replicates (a, o). Images are representative of at least n = 5 imaged cells (f). *P < 0.05, **P < 0.01, ***P < 0.001, ****P < 0.0001. Cyto, cytosolic; Mito, mitochondrial; BQR, brequinar; LFM, leflunomide; TF, teriflunomide; BQR, brequinar; TEMPO, 2,2,6,6-tetramethyl-1-piperidinyloxy; MitoTEMPO, 2-(2,2,6,6-tetramethylpiperidin-1-oxyl-4-ylamino)-2-oxoethyl) triphenylphosphonium chloride; Lip-1, liproxstatin-1; Mito-C11, fluorescent mitochondria-targeted lipid peroxidation probe.
Extended Data Fig. 7. DHODH regulation of ferroptosis relates to its function to reduce CoQ to CoQH2 in mitochondria.
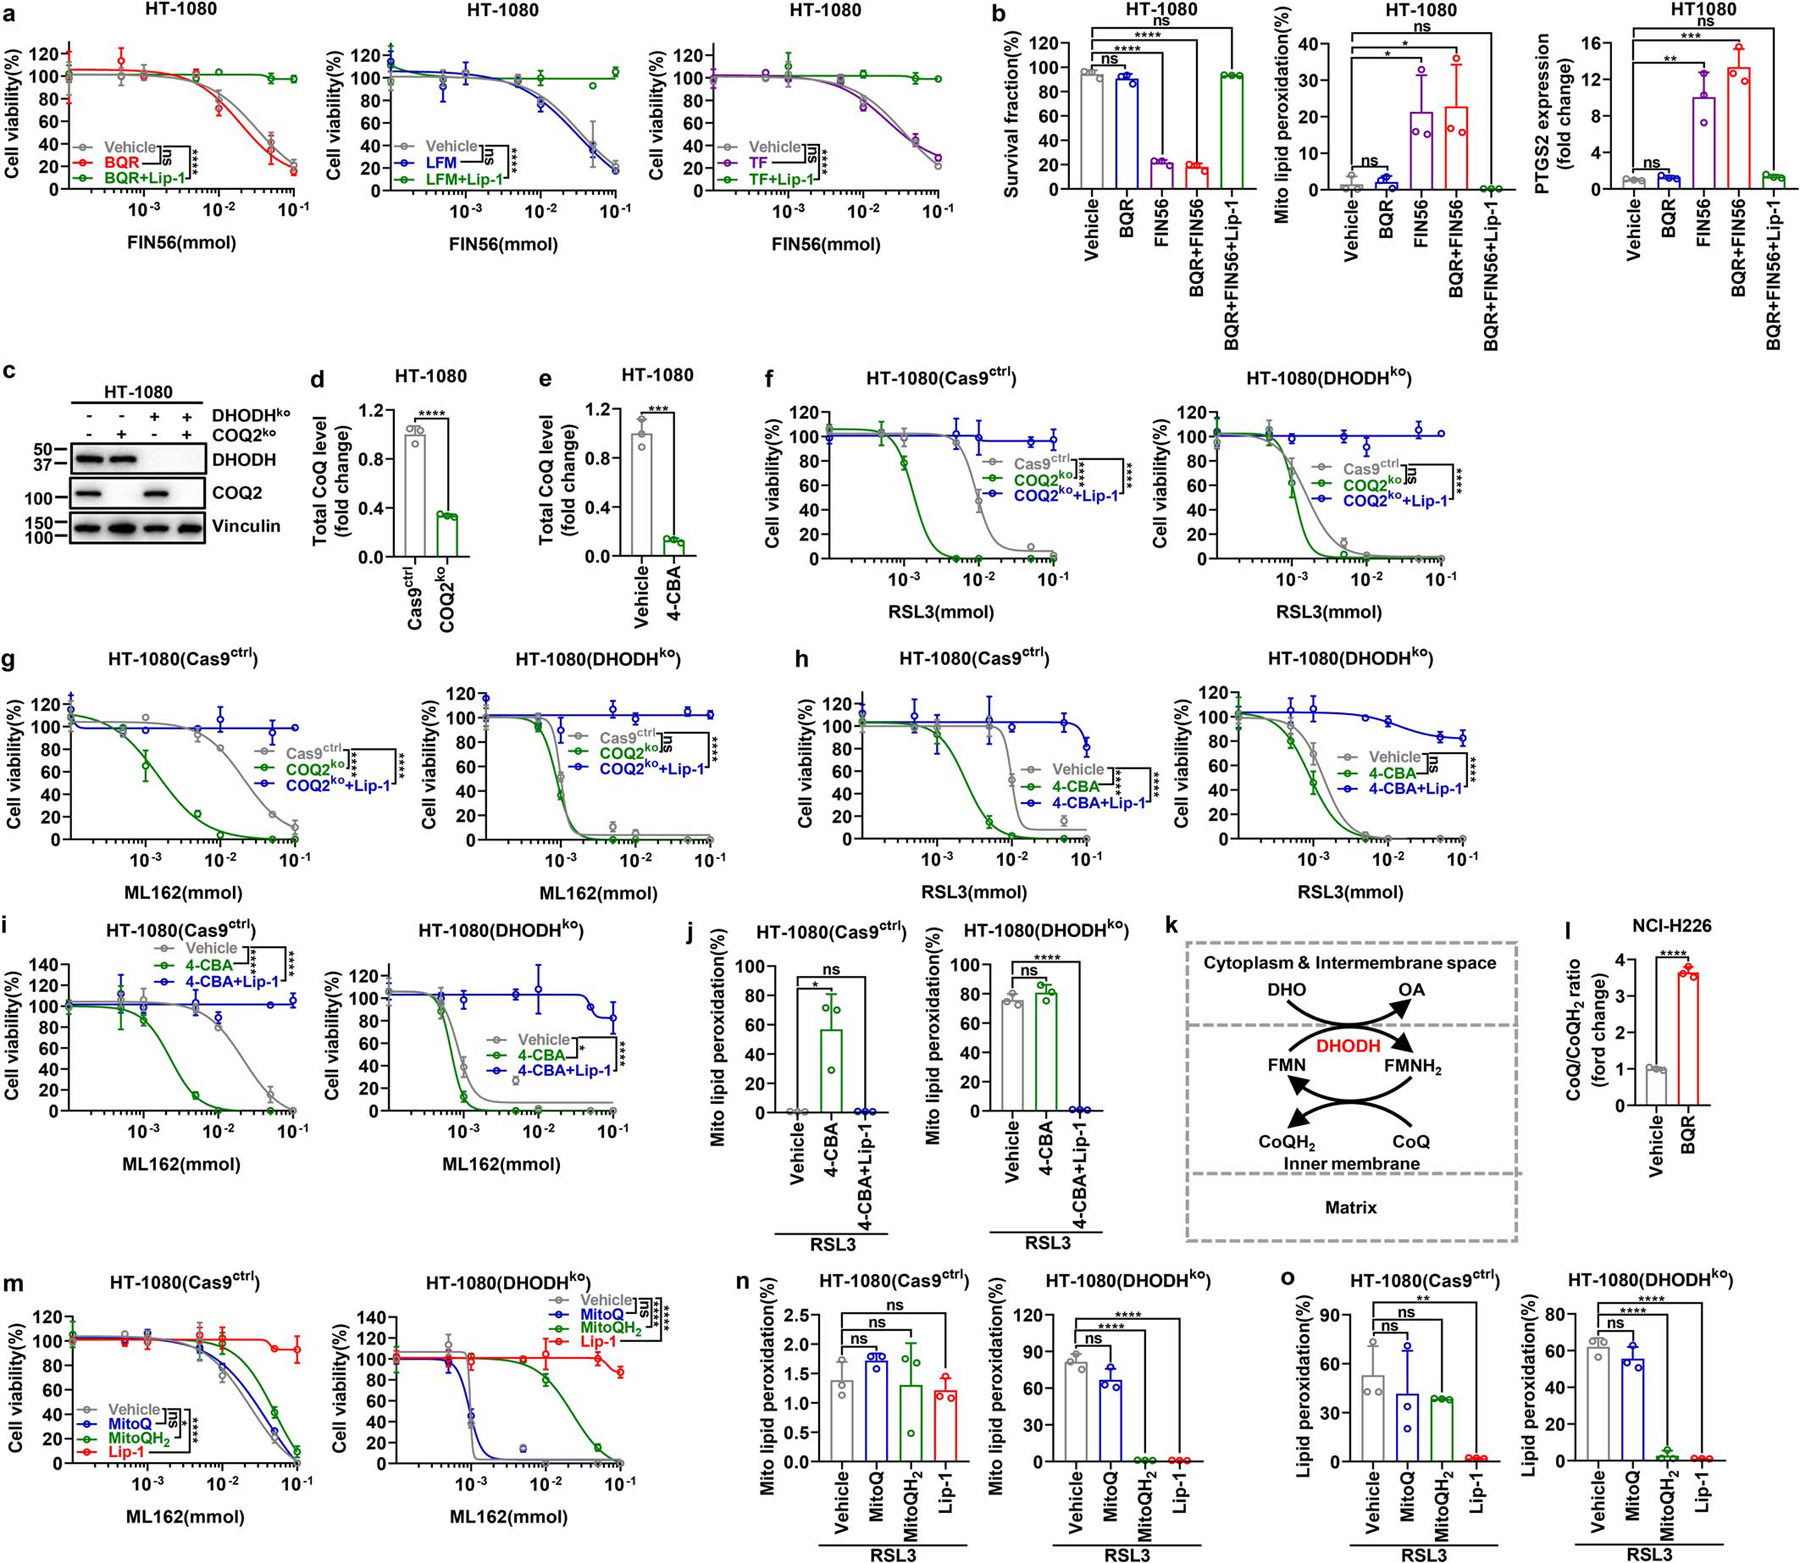
a, Cell viability measurement in HT-1080 cells treated with different doses of FIN56 and co-treatment with BQR (500 μM), LFM (100 μM) or TF (500 μM) for 4 hours, following pretreatment with vehicle or Lip-1 (10 μM) for 24 hours. b, Measurement of cell survival fraction, mitochondrial lipid peroxidation and PTGS2 mRNA levels in HT-1080 cells upon treatment with vehicle, FIN56 (50 μM) and/or BQR (500 μM), following pretreatment with vehicle or Lip-1 (10 μM) for 24 hours. c, Western blot analysis of COQ2 and DHODH protein levels in HT-1080 cells with indicated genotypes. d, Total CoQ measurement in Cas9ctrl or COQ2ko HT-1080 cells. e, Total CoQ measurement in HT-1080 cells that were treated with vehicle or 4-CBA (5 mM) for 24 hours. f, Cell viability measurement in Cas9ctrl or DHODHko HT-1080 cells with indicated genotypes treated with different doses of RSL3 for 4 hours, following pretreatment with vehicle or Lip-1 (10 μM) for 24 hours. g, Cell viability measurement in Cas9ctrl and DHODHko HT-1080 cells with indicated genotypes treated with different doses of ML162 for 4 hours, following pretreatment with vehicle or Lip-1 (10 μM) for 24 hours. h, Cell viability measurement in Cas9ctrl or DHODHko HT-1080 cells treated with different doses of RSL3 for 4 hours, following pretreatment with vehicle, 4-CBA (5 mM), or 4-CBA (5 mM) + Lip-1 (10 μM) for 24 hours. i, Cell viability measurement in Cas9ctrl and DHODHko HT-1080 cells treated with different doses of ML162 for 4 hours, following pretreatment with vehicle, 4-CBA (5 mM) and Lip-1 (10 μM) for 24 hours. j, Mitochondrial lipid peroxidation measurement in Cas9ctrl or DHODHko HT-1080 cells upon treatment with RSL3 (1 μM), following pretreatment with vehicle, 4-CBA (5 mM), or 4-CBA (5 mM) + Lip-1 (10 μM) for 24 hours. k, Simplified schematic showing how DHODH couples the oxidation of DHO to OA to the reduction of CoQ to CoQH2 in the mitochondrial inner membrane. l, CoQ/CoQH2 ratio measurement in NCI-H226 cells that were treated with BQR (1 mM) for 2 hours. m, Cell viability measurement in Cas9ctrl and DHODHko HT-1080 cells treated with different doses of ML162 for 4 hours, following pretreatment with vehicle, MitoQ (10 μM), MitoQH2 (10 μM), or Lip-1 (10 μM) for 24 hours. n, Mitochondrial lipid peroxidation measurement of Cas9ctrl or DHODHko HT-1080 cells upon treatment with RSL3 (1 μM) for 2 hours, following pretreatment with vehicle, MitoQ (10 μM), MitoQH2 (10 μM), or Lip-1 (10 μM) for 24 hours. o, Lipid peroxidation measurement of Cas9ctrl and DHODHko HT-1080 cells upon treatment with RSL3 (1 μM) for 2 hours, following pretreatment with vehicle, MitoQ (10 μM), MitoQH2 (10 μM), or Lip-1 (10 μM) for 24 hours. Cells were grown in medium supplemented with uridine (50 μM) (c, d, f-j, m-o). Data are presented as mean values +/− SD, n = 3 independent repeats (a, b, d-j, l-o). Statistical analysis was performed using unpaired, two-tailed t-test. Western blot is representative of two biological replicates (c). *P < 0.05, **P < 0.01, ***P < 0.001, ****P < 0.0001. BQR, brequinar; LFM, leflunomide; TF, teriflunomide; 4-CBA, 4-Carboxybenzaldehyde; DHO, dihydroorotate; OA, orotate; FMN, oxidized flavin mononucleotide; FMNH2, reduced flavin mononucleotide; CoQH2, reduced coenzyme Q; CoQ, oxidized coenzyme Q; OCR, oxygen consumption rate; MitoQ, [10-(4,5-dimethoxy-2-methyl-3,6-dioxo-1,4-cyclohexadien-1-yl)decyl] triphenyl-phosphonium, monomethanesulfonate; MitoQH2, [10-(2,5-dihydroxy-3,4-dimethoxy-6-methylphenyl)decyl] triphenyl-phosphonium, monomethanesulfonate; Lip-1, liproxstatin-1.
Extended Data Fig. 8. The effect of mitoQ and mitoQH2 on RSL3- and BQR-induced ferroptosis in a variety of cell lines.
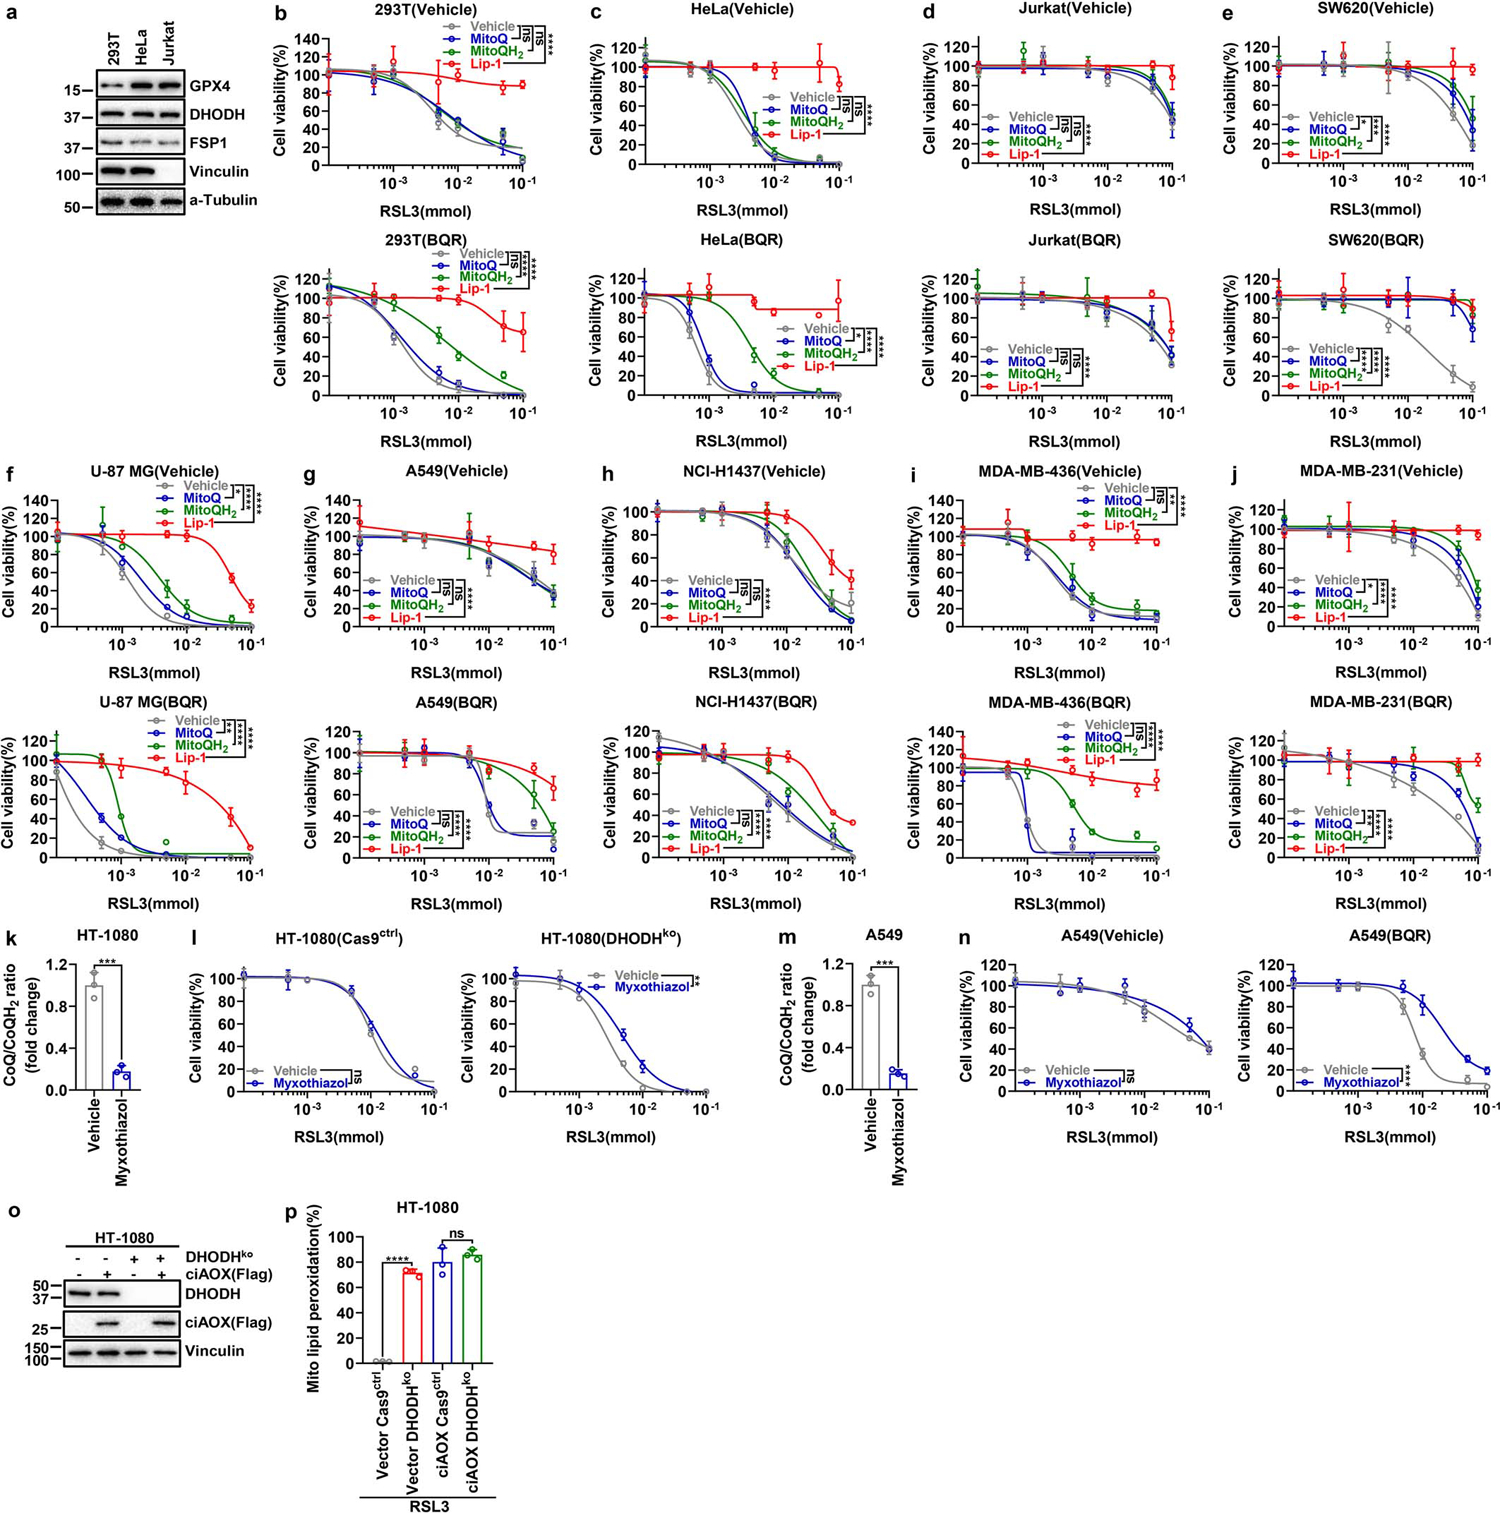
a, GPX4, DHODH and FSP1 protein levels in indicated cell lines were determined by western blotting. b-j, Cell viability measurement in 293T (b), Hela (c), Jurkat (d), SW620 (e), U-87 MG (f), A549 (g), NCI-H1437 (h), MDA-MB-436 (i), and MDA-MB-231 (j) cells treated with different doses of RSL3 with vehicle or BQR (500 μM) for 4 hours, following pretreatment with vehicle, MitoQ (10 μM), MitoQH2 (10 μM), or Lip-1 (10 μM) for 24 hours. k, CoQ/CoQH2 ratio measurement in HT-1080 cells that were treated with myxothiazol (10 μM) for 2 hours. l, Cell viability measurement in Cas9ctrl and DHODHko HT-1080 cells treated with different doses of RSL3 for 4 hours, following pretreatment with vehicle or myxothiazol (1 μM) for 24 hours. m, CoQ/CoQH2 ratio measurement in A549 cells that were treated with myxothiazol (10 μM) for 2 hours. n, Cell viability measurement in A549 cells treated with different doses of RSL3 with or without BQR (500 μM) for 4 hours, following pretreatment with vehicle or myxothiazol (1 μM) for 24 hours. o, Western blot analysis of DHODH and ciAOX protein levels in HT-1080 cells with indicated genotypes. p, Mitochondrial lipid peroxidation measurement of HT-1080 cells with indicated genotypes upon treatment with RSL3 (1 μM) for 2 hours. Cells were grown in medium supplemented with uridine (50 μM) (l, o, p). Data are presented as mean values +/− SD, n = 3 independent repeats (b-n, p). Statistical analysis was performed using unpaired, two-tailed t-test. Western blot is representative of two biological replicates (a, o). *P < 0.05, **P < 0.01, ***P < 0.001, ****P < 0.0001. MitoQ, [10-(4,5-dimethoxy-2-methyl-3,6-dioxo-1,4-cyclohexadien-1-yl)decyl] triphenyl-phosphonium, monomethanesulfonate; MitoQH2, [10-(2,5-dihydroxy-3,4-dimethoxy-6-methylphenyl)decyl] triphenyl-phosphonium, monomethanesulfonate; Lip-1, liproxstatin-1.
Extended Data Fig. 9. DHODH inhibitor selectively suppresses GPX4low tumor growth.
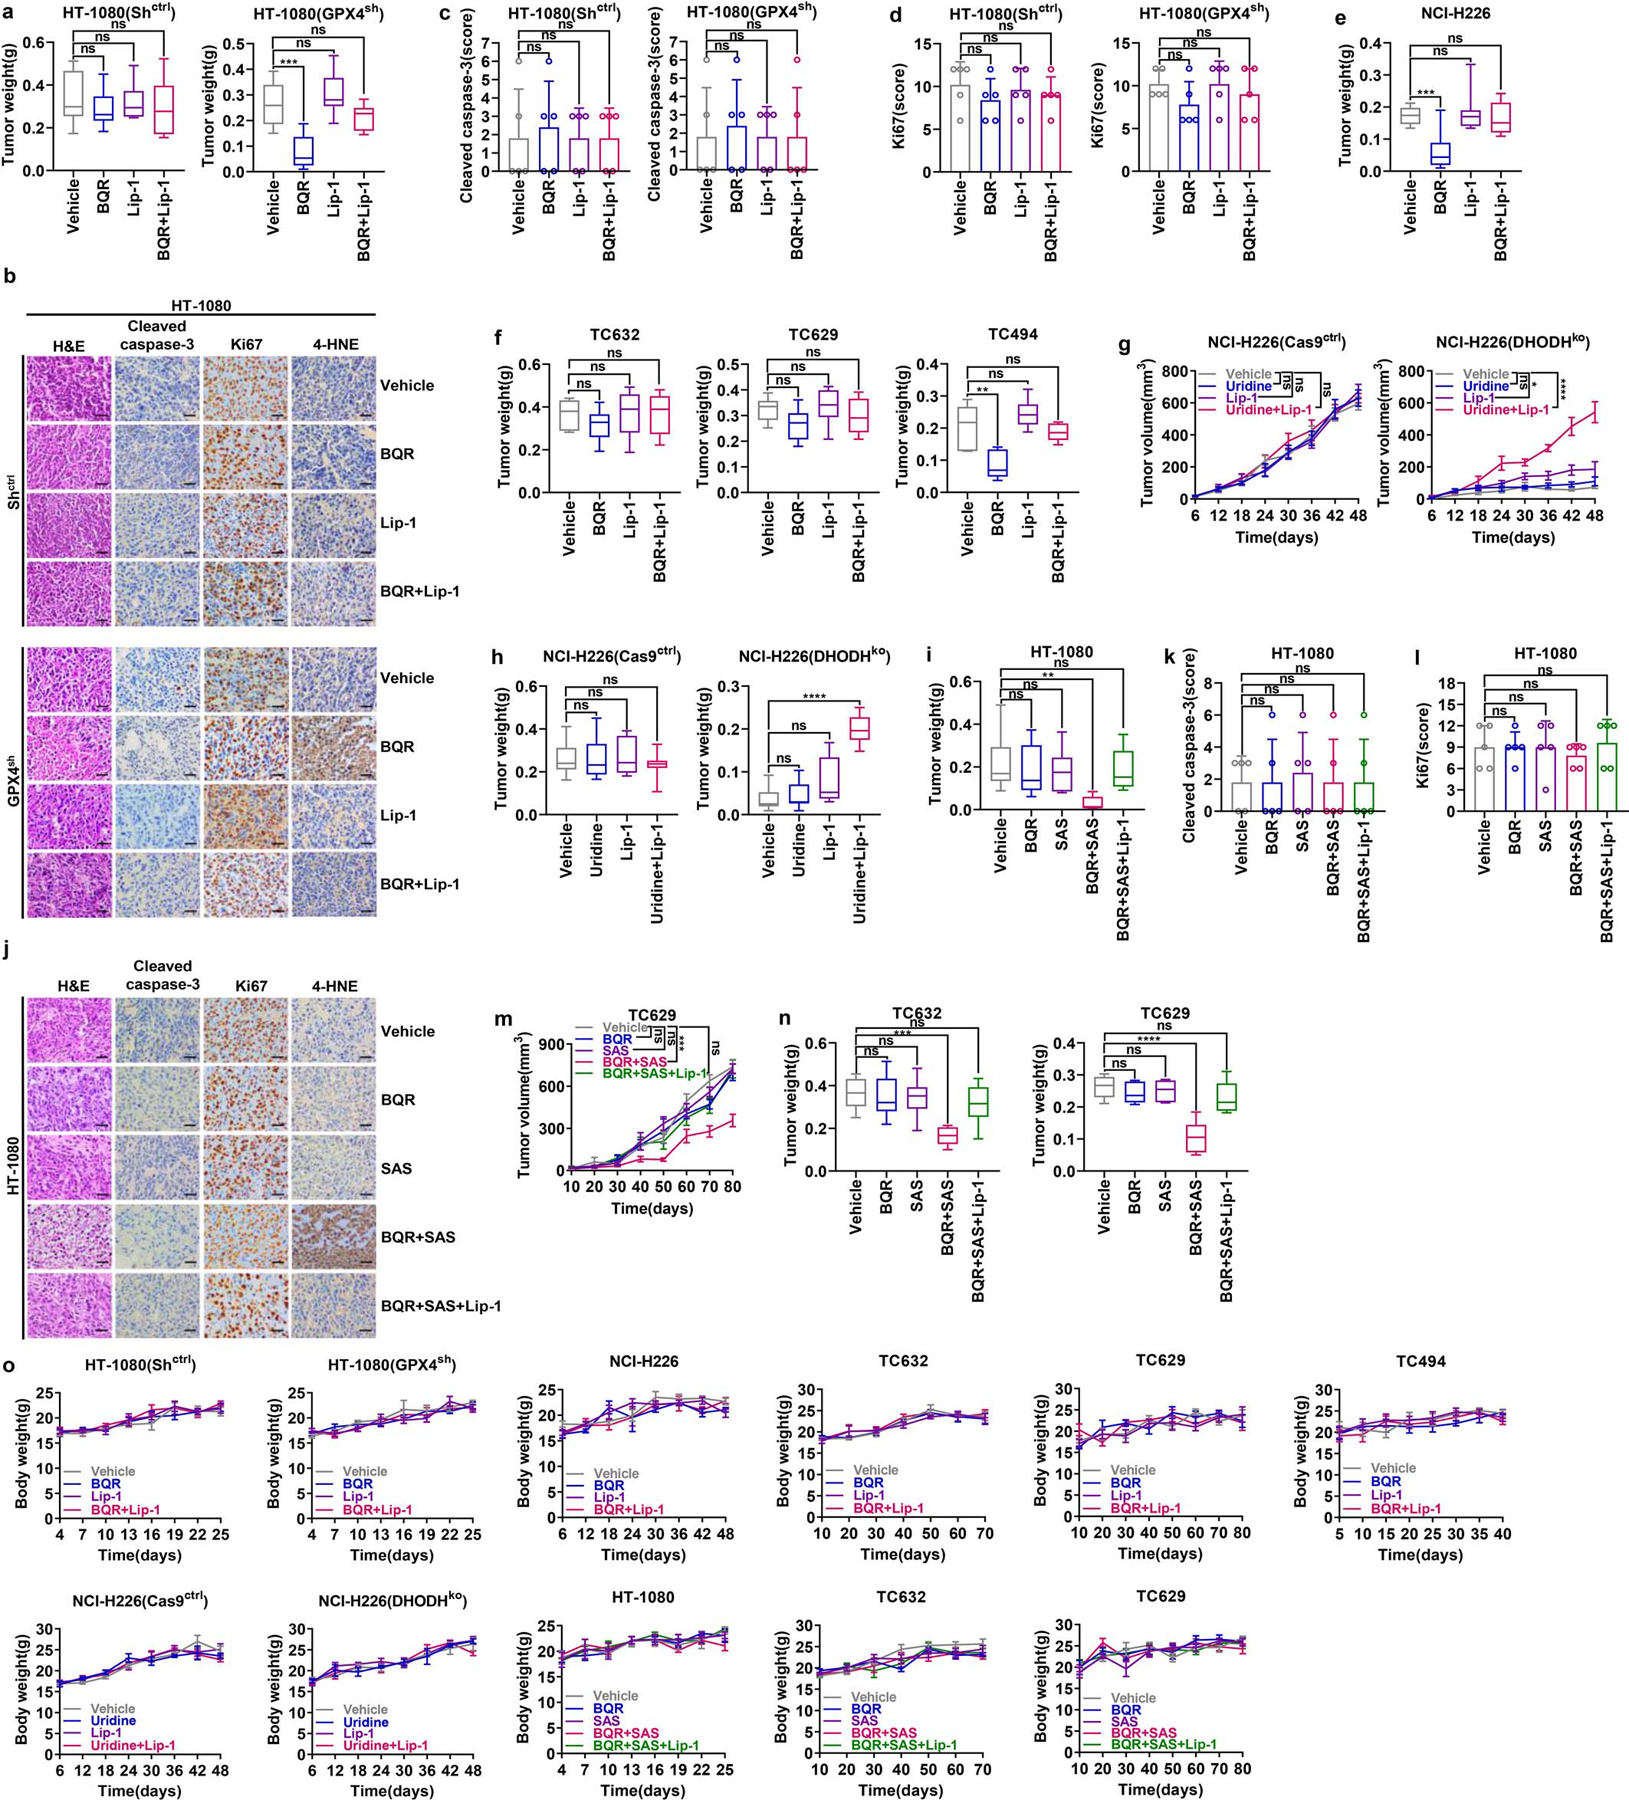
a, Weight measurement of Shctrl and GPX4sh HT-1080 xenograft tumors with the indicated treatments. b-d, Representative immunochemical images from Shctrl and GPX4sh HT-1080 xenograft tumors with the indicated treatments (Scale bar = 20 μM) (b); staining scores of cleaved - caspase 3 (c) and ki67 (d) are also shown. e, Weight measurement of NCI-H226 xenograft tumors with the indicated treatments. f, Weight measurement of TC632, TC629, or TC494 PDXs tumors with the indicated treatments. g, Volumes of Cas9ctrl and DHODHko NCI-H226 xenograft tumors with the indicated treatments at different time points (days). h, Weight measurement of Cas9ctrl and DHODHko NCI-H226 xenograft tumors with the indicated treatments. i, Weight measurement of HT-1080 xenograft tumors with the indicated treatments. j-l, Representative immunochemistry images of HT-1080 xenograft tumors with the indicated treatments (Scale bar = 20 μM) (j); staining scores of cleaved - caspase 3 (k) and ki67 (l) are also shown. m, Volumes of TC629 PDXs tumors with the indicated treatments at different time points (days). n, Weight measurement of TC632 and TC629 PDX tumors with the indicated treatments. o, Mice weight measurement of all cell line xenografts or PDXs with different treatments at different time points (days) as indicated. Box plots indicate median, minima and maxima of the distributions (a, e, f, h, i, n). Data are presented as mean values +/− SD, n = 8 (a, e, g-i), n = 5 (c, d, k, l) or n = 6 independent tumors (f, m, n). n = 4 for nude mice weight and n = 8 for NSG mice weight (o). Statistical analysis was performed using unpaired, two-tailed t-test. Images are representative of n = 5 images (b, j). *P < 0.05, **P < 0.01, ***P < 0.001, ****P < 0.0001. BQR, brequinar; Lip-1, liproxstatin-1; H&E, hematoxylin and eosin; 4-HNE, 4-Hydroxynonenal; SAS, sulfasalazine; PDX, patient-derived xenograft.
Extended Data Fig. 10. The working model depicting how GPX4, FSP1, and DHODH suppress ferroptosis at different subcellular compartments.
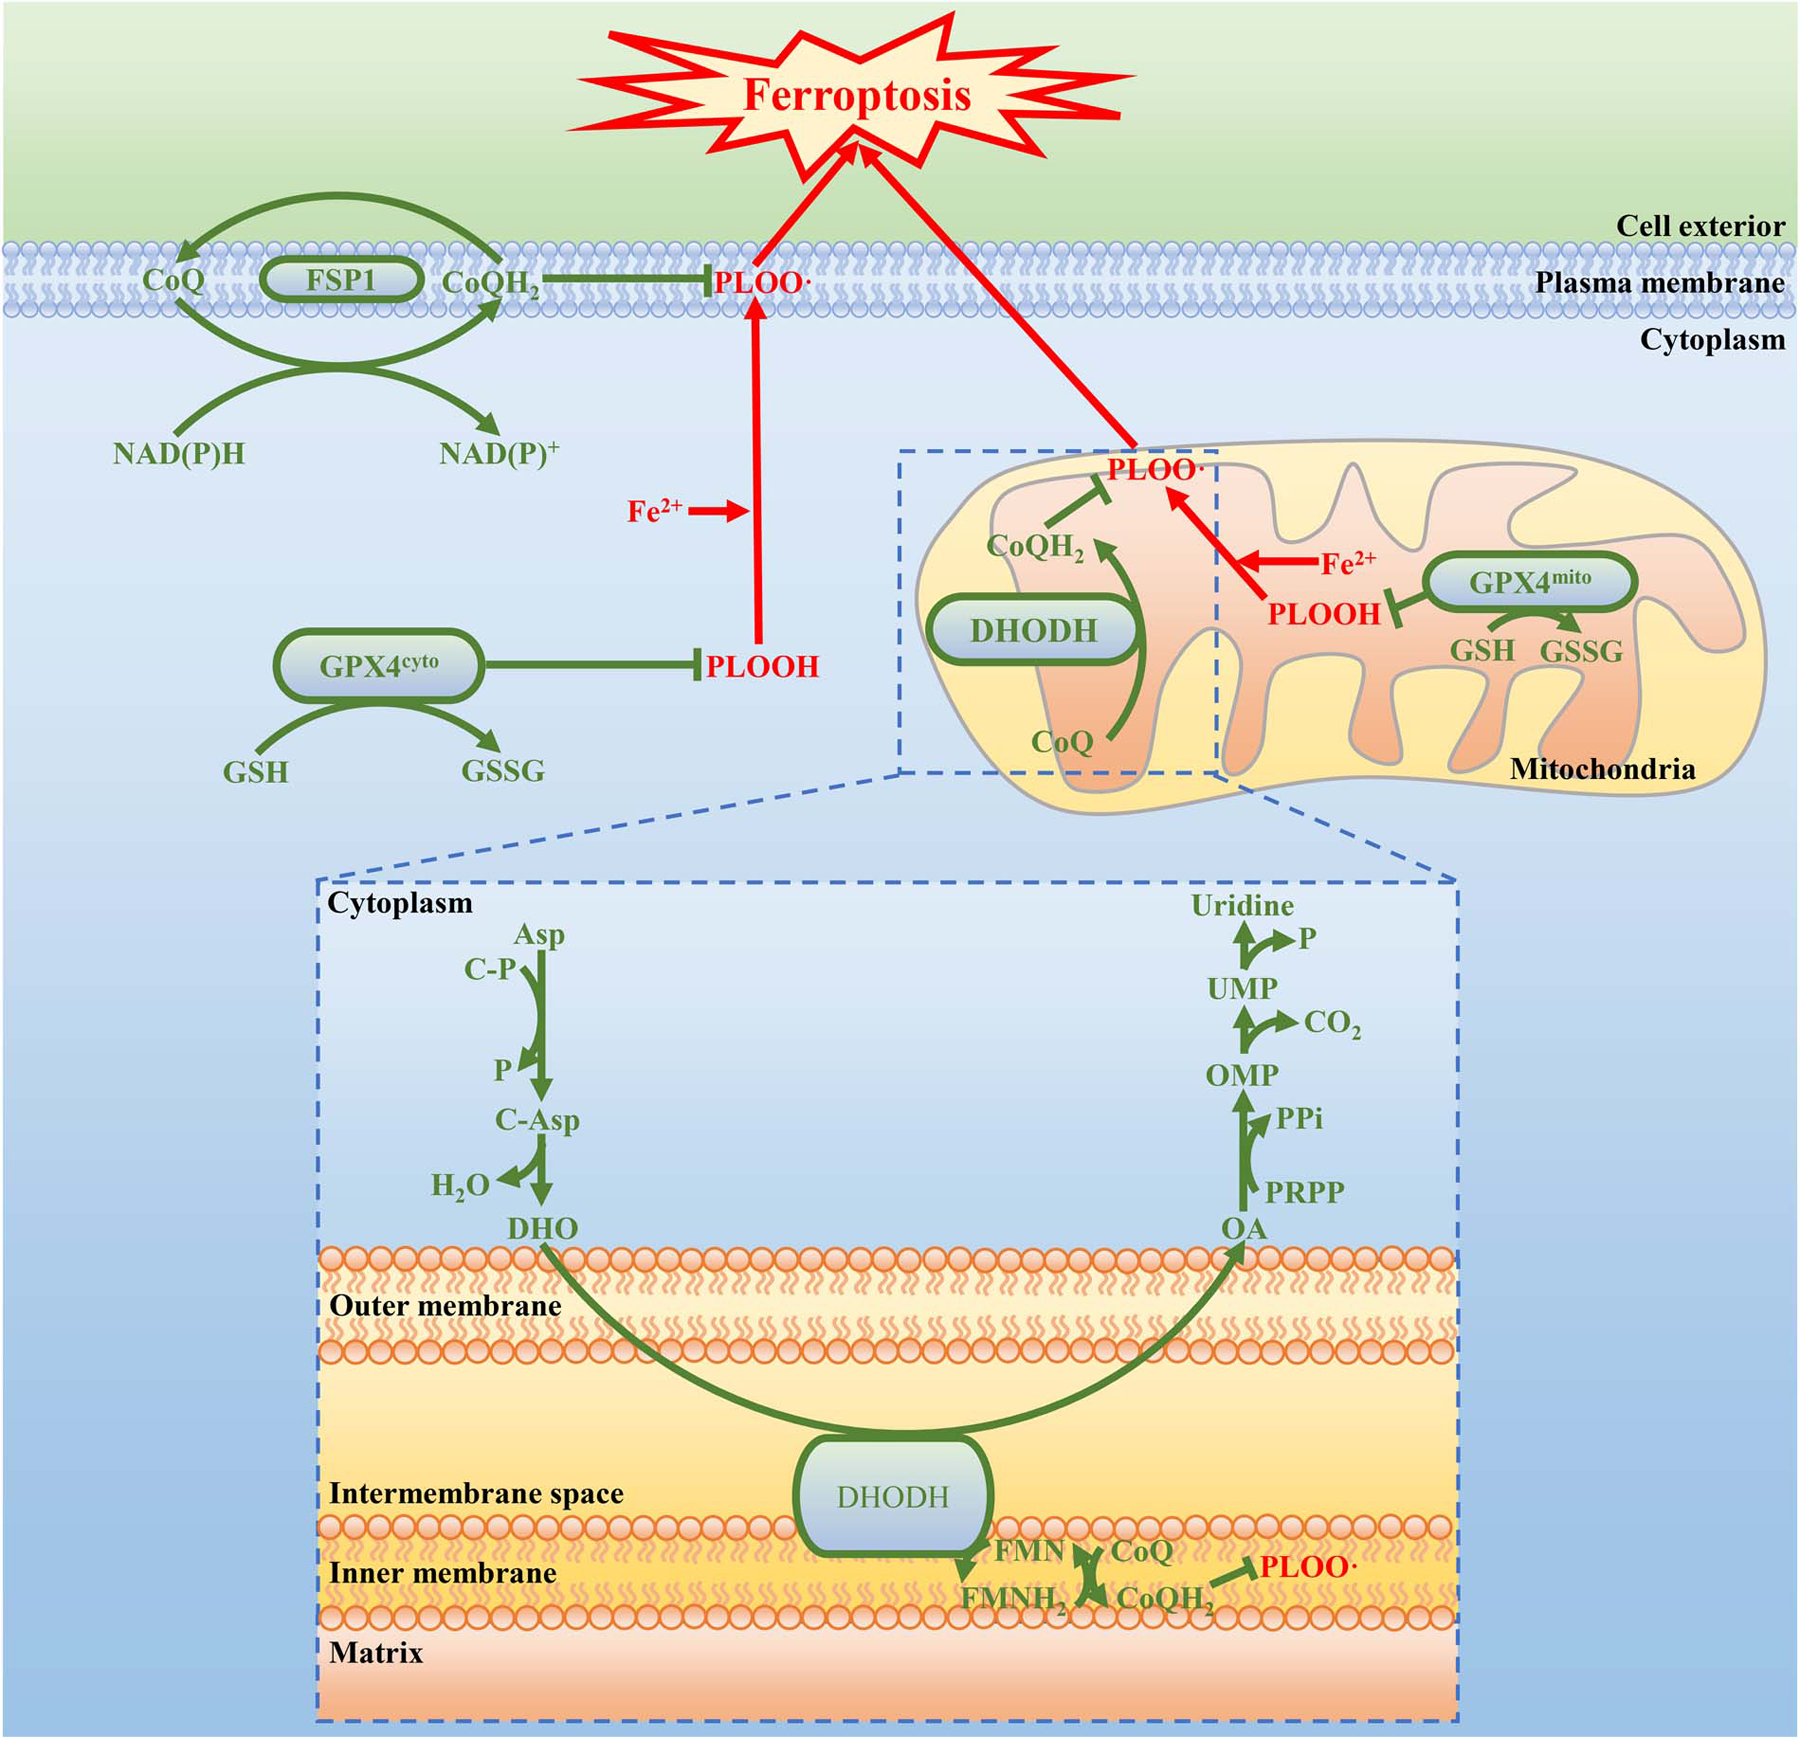
See discussion in main text for detailed description. PLOOH, phospholipid hydroperoxide; PLOO ·, phospholipid hydroperoxyl radical; GSH, reduced glutathione; GSSH, oxidized glutathione; NAD(P)H, reduced nicotinamide adenine dinucleotide (phosphate); NAD(P)+, oxidized nicotinamide adenine dinucleotide (phosphate); CoQ, oxidized coenzyme Q; CoQH2, reduced coenzyme Q; FMNH2, reduced flavin mononucleotide; FMN, oxidized flavin mononucleotide; Asp, aspartate; C-P, carbamoyl phosphate; P, phosphate; C-Asp, N-Carbamoyl-L-aspartate; DHO, dihydroorotate; OA, orotate; PRPP, phosphoribosyl pyrophosphate; PPi, inorganic pyrophosphate; OMP, orotidine 5’-monophosphate; CO2, carbon dioxide; UMP, uridine 5’-monophosphate..
Supplementary Material
Acknowledgements
We apologize to the colleagues whose relevant work cannot be cited here due to space limitations. This research has been supported by Institutional Research Fund from The University of Texas MD Anderson Cancer Center, and R01CA181196, R01CA190370, R01CA244144, R01CA247992 from the National Institutes of Health (to B.G.). PDX generation and annotation were supported by the University of Texas MD Anderson Cancer Center Moon Shots Program, Specialized Program of Research Excellence (SPORE) grant CA070907, and University of Texas PDX Development and Trial Center grant U54CA224065. This research has also been supported by the National Institutes of Health Cancer Center Support Grant P30CA016672 to The University of Texas MD Anderson Cancer Center.
Footnotes
Competing interests K.O. and M.V.P. are full-time employees of Kadmon Corporation, LLC. B.G, K.O., and M.C. have filed a patent application relating to the use of DHODH inhibitors to target ferroptosis in cancer therapy. Other authors declare no competing financial interests.
Data availability
All data that support the conclusions in this manuscript are available from the corresponding author upon reasonable request. The source data of immunoblot are provided. The raw data used for generating Figs. 1–4 and Extended Data Figs. 1–9 are included in Source Data files.
References
- 1.Dixon SJ et al. Ferroptosis: an iron-dependent form of nonapoptotic cell death. Cell 149, 1060–1072 (2012). [DOI] [PMC free article] [PubMed] [Google Scholar]
- 2.Stockwell BR et al. Ferroptosis: A Regulated Cell Death Nexus Linking Metabolism, Redox Biology, and Disease. Cell 171, 273–285 (2017). [DOI] [PMC free article] [PubMed] [Google Scholar]
- 3.Jiang L et al. Ferroptosis as a p53-mediated activity during tumour suppression. Nature 520, 57–62 (2015). [DOI] [PMC free article] [PubMed] [Google Scholar]
- 4.Zhang Y et al. BAP1 links metabolic regulation of ferroptosis to tumour suppression. Nat Cell Biol 20, 1181–1192 (2018). [DOI] [PMC free article] [PubMed] [Google Scholar]
- 5.Yang WS et al. Regulation of ferroptotic cancer cell death by GPX4. Cell 156, 317–331 (2014). [DOI] [PMC free article] [PubMed] [Google Scholar]
- 6.Friedmann Angeli JP et al. Inactivation of the ferroptosis regulator Gpx4 triggers acute renal failure in mice. Nat Cell Biol 16, 1180–1191 (2014). [DOI] [PMC free article] [PubMed] [Google Scholar]
- 7.Bersuker K et al. The CoQ oxidoreductase FSP1 acts parallel to GPX4 to inhibit ferroptosis. Nature 575, 688–692 (2019). [DOI] [PMC free article] [PubMed] [Google Scholar]
- 8.Doll S et al. FSP1 is a glutathione-independent ferroptosis suppressor. Nature 575, 693–698 (2019). [DOI] [PubMed] [Google Scholar]
- 9.Koppula P, Zhuang L & Gan B Cystine transporter SLC7A11/xCT in cancer: ferroptosis, nutrient dependency, and cancer therapy. Protein Cell 10.1007/s13238-020-00789-5 (2020). [DOI] [PMC free article] [PubMed] [Google Scholar]
- 10.Doll S et al. ACSL4 dictates ferroptosis sensitivity by shaping cellular lipid composition. Nature chemical biology 13, 91–98 (2017). [DOI] [PMC free article] [PubMed] [Google Scholar]
- 11.Basu A et al. An interactive resource to identify cancer genetic and lineage dependencies targeted by small molecules. Cell 154, 1151–1161 (2013). [DOI] [PMC free article] [PubMed] [Google Scholar]
- 12.Vasan K, Werner M & Chandel NS Mitochondrial Metabolism as a Target for Cancer Therapy. Cell Metab 32, 341–352 (2020). [DOI] [PMC free article] [PubMed] [Google Scholar]
- 13.Arai M et al. Import into mitochondria of phospholipid hydroperoxide glutathione peroxidase requires a leader sequence. Biochem Biophys Res Commun 227, 433–439 (1996). [DOI] [PubMed] [Google Scholar]
- 14.Trnka J, Blaikie FH, Smith RA & Murphy MP A mitochondria-targeted nitroxide is reduced to its hydroxylamine by ubiquinol in mitochondria. Free Radic Biol Med 44, 1406–1419 (2008). [DOI] [PubMed] [Google Scholar]
- 15.Prime TA et al. A ratiometric fluorescent probe for assessing mitochondrial phospholipid peroxidation within living cells. Free Radic Biol Med 53, 544–553 (2012). [DOI] [PubMed] [Google Scholar]
- 16.Shimada K et al. Global survey of cell death mechanisms reveals metabolic regulation of ferroptosis. Nature chemical biology 12, 497–503 (2016). [DOI] [PMC free article] [PubMed] [Google Scholar]
- 17.Hakkaart GA, Dassa EP, Jacobs HT & Rustin P Allotopic expression of a mitochondrial alternative oxidase confers cyanide resistance to human cell respiration. EMBO Rep 7, 341–345 (2006). [DOI] [PMC free article] [PubMed] [Google Scholar]
- 18.Peters GJ et al. In vivo inhibition of the pyrimidine de novo enzyme dihydroorotic acid dehydrogenase by brequinar sodium (DUP-785; NSC 368390) in mice and patients. Cancer Res 50, 4644–4649 (1990). [PubMed] [Google Scholar]
- 19.Natale R et al. Multicenter phase II trial of brequinar sodium in patients with advanced melanoma. Ann Oncol 3, 659–660 (1992). [DOI] [PubMed] [Google Scholar]
- 20.Urba S et al. Multicenter phase II trial of brequinar sodium in patients with advanced squamous-cell carcinoma of the head and neck. Cancer Chemother Pharmacol 31, 167–169 (1992). [DOI] [PubMed] [Google Scholar]
- 21.Maroun J et al. Multicenter phase II study of brequinar sodium in patients with advanced lung cancer. Cancer Chemother Pharmacol 32, 64–66 (1993). [DOI] [PubMed] [Google Scholar]
- 22.Lei G et al. The role of ferroptosis in ionizing radiation-induced cell death and tumor suppression. Cell research 30, 146–162 (2020). [DOI] [PMC free article] [PubMed] [Google Scholar]
- 23.Gout PW, Buckley AR, Simms CR & Bruchovsky N Sulfasalazine, a potent suppressor of lymphoma growth by inhibition of the x(c)- cystine transporter: a new action for an old drug. Leukemia 15, 1633–1640 (2001). [DOI] [PubMed] [Google Scholar]
- 24.Zou Y et al. A GPX4-dependent cancer cell state underlies the clear-cell morphology and confers sensitivity to ferroptosis. Nature communications 10, 1617 (2019). [DOI] [PMC free article] [PubMed] [Google Scholar]
- 25.Soula M et al. Metabolic determinants of cancer cell sensitivity to canonical ferroptosis inducers. Nat Chem Biol 16, 1351–1360 (2020). [DOI] [PMC free article] [PubMed] [Google Scholar]
- 26.Gao M et al. Role of Mitochondria in Ferroptosis. Mol Cell 73, 354–363 e353 (2019). [DOI] [PMC free article] [PubMed] [Google Scholar]
- 27.Lee H et al. Energy-stress-mediated AMPK activation inhibits ferroptosis. Nature cell biology 22, 225–234 (2020). [DOI] [PMC free article] [PubMed] [Google Scholar]
- 28.Wang W et al. CD8(+) T cells regulate tumour ferroptosis during cancer immunotherapy. Nature 569, 270–274 (2019). [DOI] [PMC free article] [PubMed] [Google Scholar]
- 29.Lang X et al. Radiotherapy and immunotherapy promote tumoral lipid oxidation and ferroptosis via synergistic repression of SLC7A11. Cancer Discov (2019). [DOI] [PMC free article] [PubMed] [Google Scholar]
- 30.Ye LF et al. Radiation-Induced Lipid Peroxidation Triggers Ferroptosis and Synergizes with Ferroptosis Inducers. ACS Chem Biol 15, 469–484 (2020). [DOI] [PMC free article] [PubMed] [Google Scholar]
- 31.Zhang Y, Koppula P & Gan B Regulation of H2A ubiquitination and SLC7A11 expression by BAP1 and PRC1. Cell Cycle 18, 773–783 (2019). [DOI] [PMC free article] [PubMed] [Google Scholar]
- 32.Chauhan AS et al. STIM2 interacts with AMPK and regulates calcium-induced AMPK activation. FASEB J 33, 2957–2970 (2019). [DOI] [PMC free article] [PubMed] [Google Scholar]
- 33.Liu X et al. Cystine transporter regulation of pentose phosphate pathway dependency and disulfide stress exposes a targetable metabolic vulnerability in cancer. Nat Cell Biol 22, 476–486 (2020). [DOI] [PMC free article] [PubMed] [Google Scholar]
- 34.Heinrich P et al. Correcting for natural isotope abundance and tracer impurity in MS-, MS/MS- and high-resolution-multiple-tracer-data from stable isotope labeling experiments with IsoCorrectoR. Sci Rep 8, 17910 (2018). [DOI] [PMC free article] [PubMed] [Google Scholar]
- 35.Koppula P, Zhang Y, Shi J, Li W & Gan B The glutamate/cystine antiporter SLC7A11/xCT enhances cancer cell dependency on glucose by exporting glutamate. J Biol Chem 292, 14240–14249 (2017). [DOI] [PMC free article] [PubMed] [Google Scholar]
- 36.Liu X & Gan B lncRNA NBR2 modulates cancer cell sensitivity to phenformin through GLUT1. Cell Cycle 15, 3471–3481 (2016). [DOI] [PMC free article] [PubMed] [Google Scholar]
- 37.Dai F et al. BAP1 inhibits the ER stress gene regulatory network and modulates metabolic stress response. Proc Natl Acad Sci U S A 114, 3192–3197 (2017). [DOI] [PMC free article] [PubMed] [Google Scholar]
- 38.Zhang Y et al. H2A Monoubiquitination Links Glucose Availability to Epigenetic Regulation of the Endoplasmic Reticulum Stress Response and Cancer Cell Death. Cancer Res 80, 2243–2256 (2020). [DOI] [PMC free article] [PubMed] [Google Scholar]
- 39.Fang J et al. Dihydro-orotate dehydrogenase is physically associated with the respiratory complex and its loss leads to mitochondrial dysfunction. Biosci Rep 33, e00021 (2013). [DOI] [PMC free article] [PubMed] [Google Scholar]
- 40.Nagase M, Yamamoto Y, Mitsui J & Tsuji S Simultaneous detection of reduced and oxidized forms of coenzyme Q10 in human cerebral spinal fluid as a potential marker of oxidative stress. J Clin Biochem Nutr 63, 205–210 (2018). [DOI] [PMC free article] [PubMed] [Google Scholar]
- 41.Zhang Y et al. Imidazole Ketone Erastin Induces Ferroptosis and Slows Tumor Growth in a Mouse Lymphoma Model. Cell Chem Biol (2019). [DOI] [PMC free article] [PubMed] [Google Scholar]
- 42.Liu X et al. LncRNA NBR2 engages a metabolic checkpoint by regulating AMPK under energy stress. Nat Cell Biol 18, 431–442 (2016). [DOI] [PMC free article] [PubMed] [Google Scholar]
- 43.Lee H et al. BAF180 regulates cellular senescence and hematopoietic stem cell homeostasis through p21. Oncotarget 7, 19134–19146 (2016). [DOI] [PMC free article] [PubMed] [Google Scholar]
- 44.Lin A et al. The FoxO-BNIP3 axis exerts a unique regulation of mTORC1 and cell survival under energy stress. Oncogene 33, 3183–3194 (2014). [DOI] [PMC free article] [PubMed] [Google Scholar]
- 45.Lin A et al. FoxO transcription factors promote AKT Ser473 phosphorylation and renal tumor growth in response to pharmacologic inhibition of the PI3K-AKT pathway. Cancer Res 74, 1682–1693 (2014). [DOI] [PMC free article] [PubMed] [Google Scholar]
- 46.Gan B et al. FoxOs enforce a progression checkpoint to constrain mTORC1-activated renal tumorigenesis. Cancer Cell 18, 472–484 (2010). [DOI] [PMC free article] [PubMed] [Google Scholar]
- 47.Gan B et al. Role of FIP200 in cardiac and liver development and its regulation of TNFalpha and TSC-mTOR signaling pathways. J Cell Biol 175, 121–133 (2006). [DOI] [PMC free article] [PubMed] [Google Scholar]
Associated Data
This section collects any data citations, data availability statements, or supplementary materials included in this article.
Supplementary Materials
Data Availability Statement
All data that support the conclusions in this manuscript are available from the corresponding author upon reasonable request. The source data of immunoblot are provided. The raw data used for generating Figs. 1–4 and Extended Data Figs. 1–9 are included in Source Data files.