

Abstract
Objective:
Patients undergoing frontal lobectomy demonstrate lower seizure-freedom rates than patients undergoing temporal lobectomy and several other resective interventions. We attempted to utilize automated preoperative quantitative analysis of focal and global cortical volume loss to develop predictive volumetric indicators of seizure outcome after frontal lobectomy.
Methods:
Ninety patients who underwent frontal lobectomy were stratified based on seizure freedom at a mean follow-up time of 3.5 (standard deviation [SD] 2.5) years. Automated quantitative analysis of cortical volume loss organized by distinct brain region and laterality was performed on preoperative T1-weighted magnetic resonance imaging (MRI) studies. Univariate statistical analysis was used to select potential predictors of seizure freedom. Backward variable selection and multivariate logistical regression were used to develop models to predict seizure freedom.
Results:
Forty-eight of 90 (53.3%) patients were seizure-free at the last follow-up. Several frontal and extrafrontal brain regions demonstrated statistically significant differences in both volumetric cortical volume loss and volumetric asymmetry between the left and right sides in the seizure-free and non–seizure-free cohorts. A final multivariate logistic model utilizing only preoperative quantitative MRI data to predict seizure outcome was developed with a c-statistic of 0.846. Using both preoperative quantitative MRI data and previously validated clinical predictors of seizure outcomes, we developed a model with a c-statistic of 0.897.
Significance:
This study demonstrates that preoperative cortical volume loss in both frontal and extrafrontal regions can be predictive of seizure outcome after frontal lobectomy, and models can be developed with excellent predictive capabilities using preoperative MRI data. Automated quantitative MRI analysis can be quickly and reliably performed in patients with frontal lobe epilepsy, and further studies may be developed for integration into preoperative risk stratification.
Keywords: epilepsy surgery, frontal lobe epilepsy, frontal lobectomy, outcomes, volumetric analysis
1 |. INTRODUCTION
Frontal lobectomy can be a successful surgical intervention for patients with medically refractory frontal epilepsy,1–4 albeit with lower seizure freedom rates than with temporal lobectomy and several other resective interventions.5,6 Widespread, progressive cortical volume loss exceeding that found in normal aging has been demonstrated in frontal epilepsy; however, its utility as a prognostic indicator in frontal lobe epilepsy surgery is still limited.7 We hypothesized that extrafrontal or global brain volume loss could be a structural correlate for a more widespread epilepsy network or epilepsy mislocalized to the frontal lobe, and thus could be a negative prognostic indicator for seizure freedom. One of the main limitations in analyzing cortical volume loss throughout the brain is the time-intensive, non-standardized nature of data collection and analysis using traditional imaging research methodologies. Although these tools are excellent for research purposes, they are difficult to integrate into routine clinical practice and therefore have limited translational potential. NeuroQuant (CorTech Labs) is an US Food and Drug Administration (FDA)–approved software developed originally to monitor neurodegenerative disorders, which can quickly provide automated segmentation and volumetric analysis of cortical volume loss on magnetic resonance imaging (MRI).8,9 In this study, we used NeuroQuant volumetric analysis of preoperative MRI of patients who underwent frontal lobectomy to determine potential radiographic prognostic indicators of seizure freedom based on preoperative cortical volume loss. We then utilized multivariate logistic regression to develop a model to predict individualized seizure outcomes based on preoperative cortical volume loss.
2 |. METHODS
2.1 |. Study design and preoperative evaluation
We reviewed all patients who underwent frontal lobectomy for medically refractory epilepsy at our institution between February 2010 and June 2018. We excluded those with prior surgery, incomplete follow-up, or additional resection involving other lobes of the brain (Figure S1). We collected data regarding demographic information, surgical variables, preoperative imaging findings, pathology results, and seizure outcomes. All patients met the International League Against Epilepsy (ILAE) definition of drug-resistant epilepsy.10 Patients underwent testing, including videoelectroencepha-lography monitoring, thin-cut MRI, magnetoencephalography, positron emission tomography, neuropsychiatric analysis, and, if deemed necessary, invasive electrophysiological monitoring. Preoperative MRI was reviewed by a dedicated neuroradiologist and reported as lesional, with abnormal findings, or nonlesional, without convincing evidence of abnormality. Patients were then evaluated by a multidisciplinary epilepsy team and ultimately recommended to undergo frontal lobectomy. Postoperatively, seizure outcome was evaluated at 6 months, 1 year, and yearly thereafter for all seizure-free patients. Patients with recurrent or residual seizures were seen as frequently as clinically indicated. Patients were evaluated postoperatively based on Engel classification and time to recurrence of seizures.11 A specialized epilepsy neuropathologist blinded to the surgical outcomes reviewed and reported on abnormal findings from surgical resections, which were subsequently categorized as cortical dysplasia, tumor, cryptogenic (normal variants), or other (cavernoma, stroke, posttraumatic sequelae). Postoperative imaging was reviewed by a neurosurgeon blinded to the surgical outcomes, and the type of the surgery was categorized as a complete premotor lobectomy, subtotal lobectomy (greater than two gyri or anatomic regions but less than a complete premotor resection), or partial lobectomy (less than two gyri or anatomic regions). The proximity of the epileptogenic zone to eloquent cortex was defined as resections that included the following regions: pars opercularis, pars orbitalis, or pars triangularis on the language dominant side or the premotor area in either hemisphere. Language dominance was defined by the Wada test (n = 4), functional fMRI (fMRI) (n = 16), and handedness (n = 68). We excluded two cases from the analysis because we were not able to define language dominance. Electroencephalography (EEG) ictal and interictal findings were evaluated based on the concordance with the area resected. EEG was considered strictly regional if the EEG finding was restricted to the ipsilateral frontal lobe resected.
This study was conducted with approval from the Cleveland Clinical Foundation Institutional Review Board. Informed consent was waived due to the retrospective nature of the data collection.
2.2 |. Volumetric analysis
NeuroQuant (CorTech Labs) is an FDA-approved software that provides automated segmentation and volumetric analysis of T1-weighted MRI data sets. Volumetric data are compared to age, sex, and cranial volume-matched controls, validated against manual methods.9 NeuroQuanťs normative database was built on a population-based sample data set collected from several thousand subjects from 3 to 100 years of age with an equivalence of gender.12 NeuroQuant can process most 1.5 T and 3 T T1-weighted MR images and create comprehensive volumetric reports in about 10 min-utes.13 NeuroQuant segments T1-weighted MRI data sets into 71 distinct brain regions, which are further delineated by laterality, and calculates volume percentiles compared to brain volumes of a normative database. Percentile data for each region of the brain is provided in a succinct report (Figure 1). Left and right region asymmetry indices are calculated using the percentage of intracranial volume difference between left and right volumes divided by the mean. This value is then compared to the normative database, and results are provided in percentiles. When interpreting asymmetry values as percentiles, the closer the value is to 50, the smaller the difference between left and right volumes. If the asymmetry value measured in percentile is between 51 and 100, the right side is smaller than the left, and if the value is between 1 and 50, the left side is smaller. Patients who underwent frontal lobectomy during the study time frame with appropriate preoperative imaging of sufficient quality underwent automated volumetric analysis with NeuroQuant. The 3D T1-weighted images were acquired with slightly different protocols across a number of 1.5 T (n = 35) and 3 T (n = 55) scanners. 1.5 and 3 T images comprised a maximum voxel size of 0.8 × 0.8 × 1.25 and 1 × 1 × 1, respectively. The slice thickness varied between 0.94 and 1.25 mm. Volumetric data were processed and collated for each patient. Data involving the cerebellum, choroid plexus, brainstem, and ventricles were omitted from the analysis. Patients were excluded if they lacked preoperative MRI or if preoperative MRI was of insufficient quality for automated analysis due to motion artifact or slice thickness.
FIGURE 1.
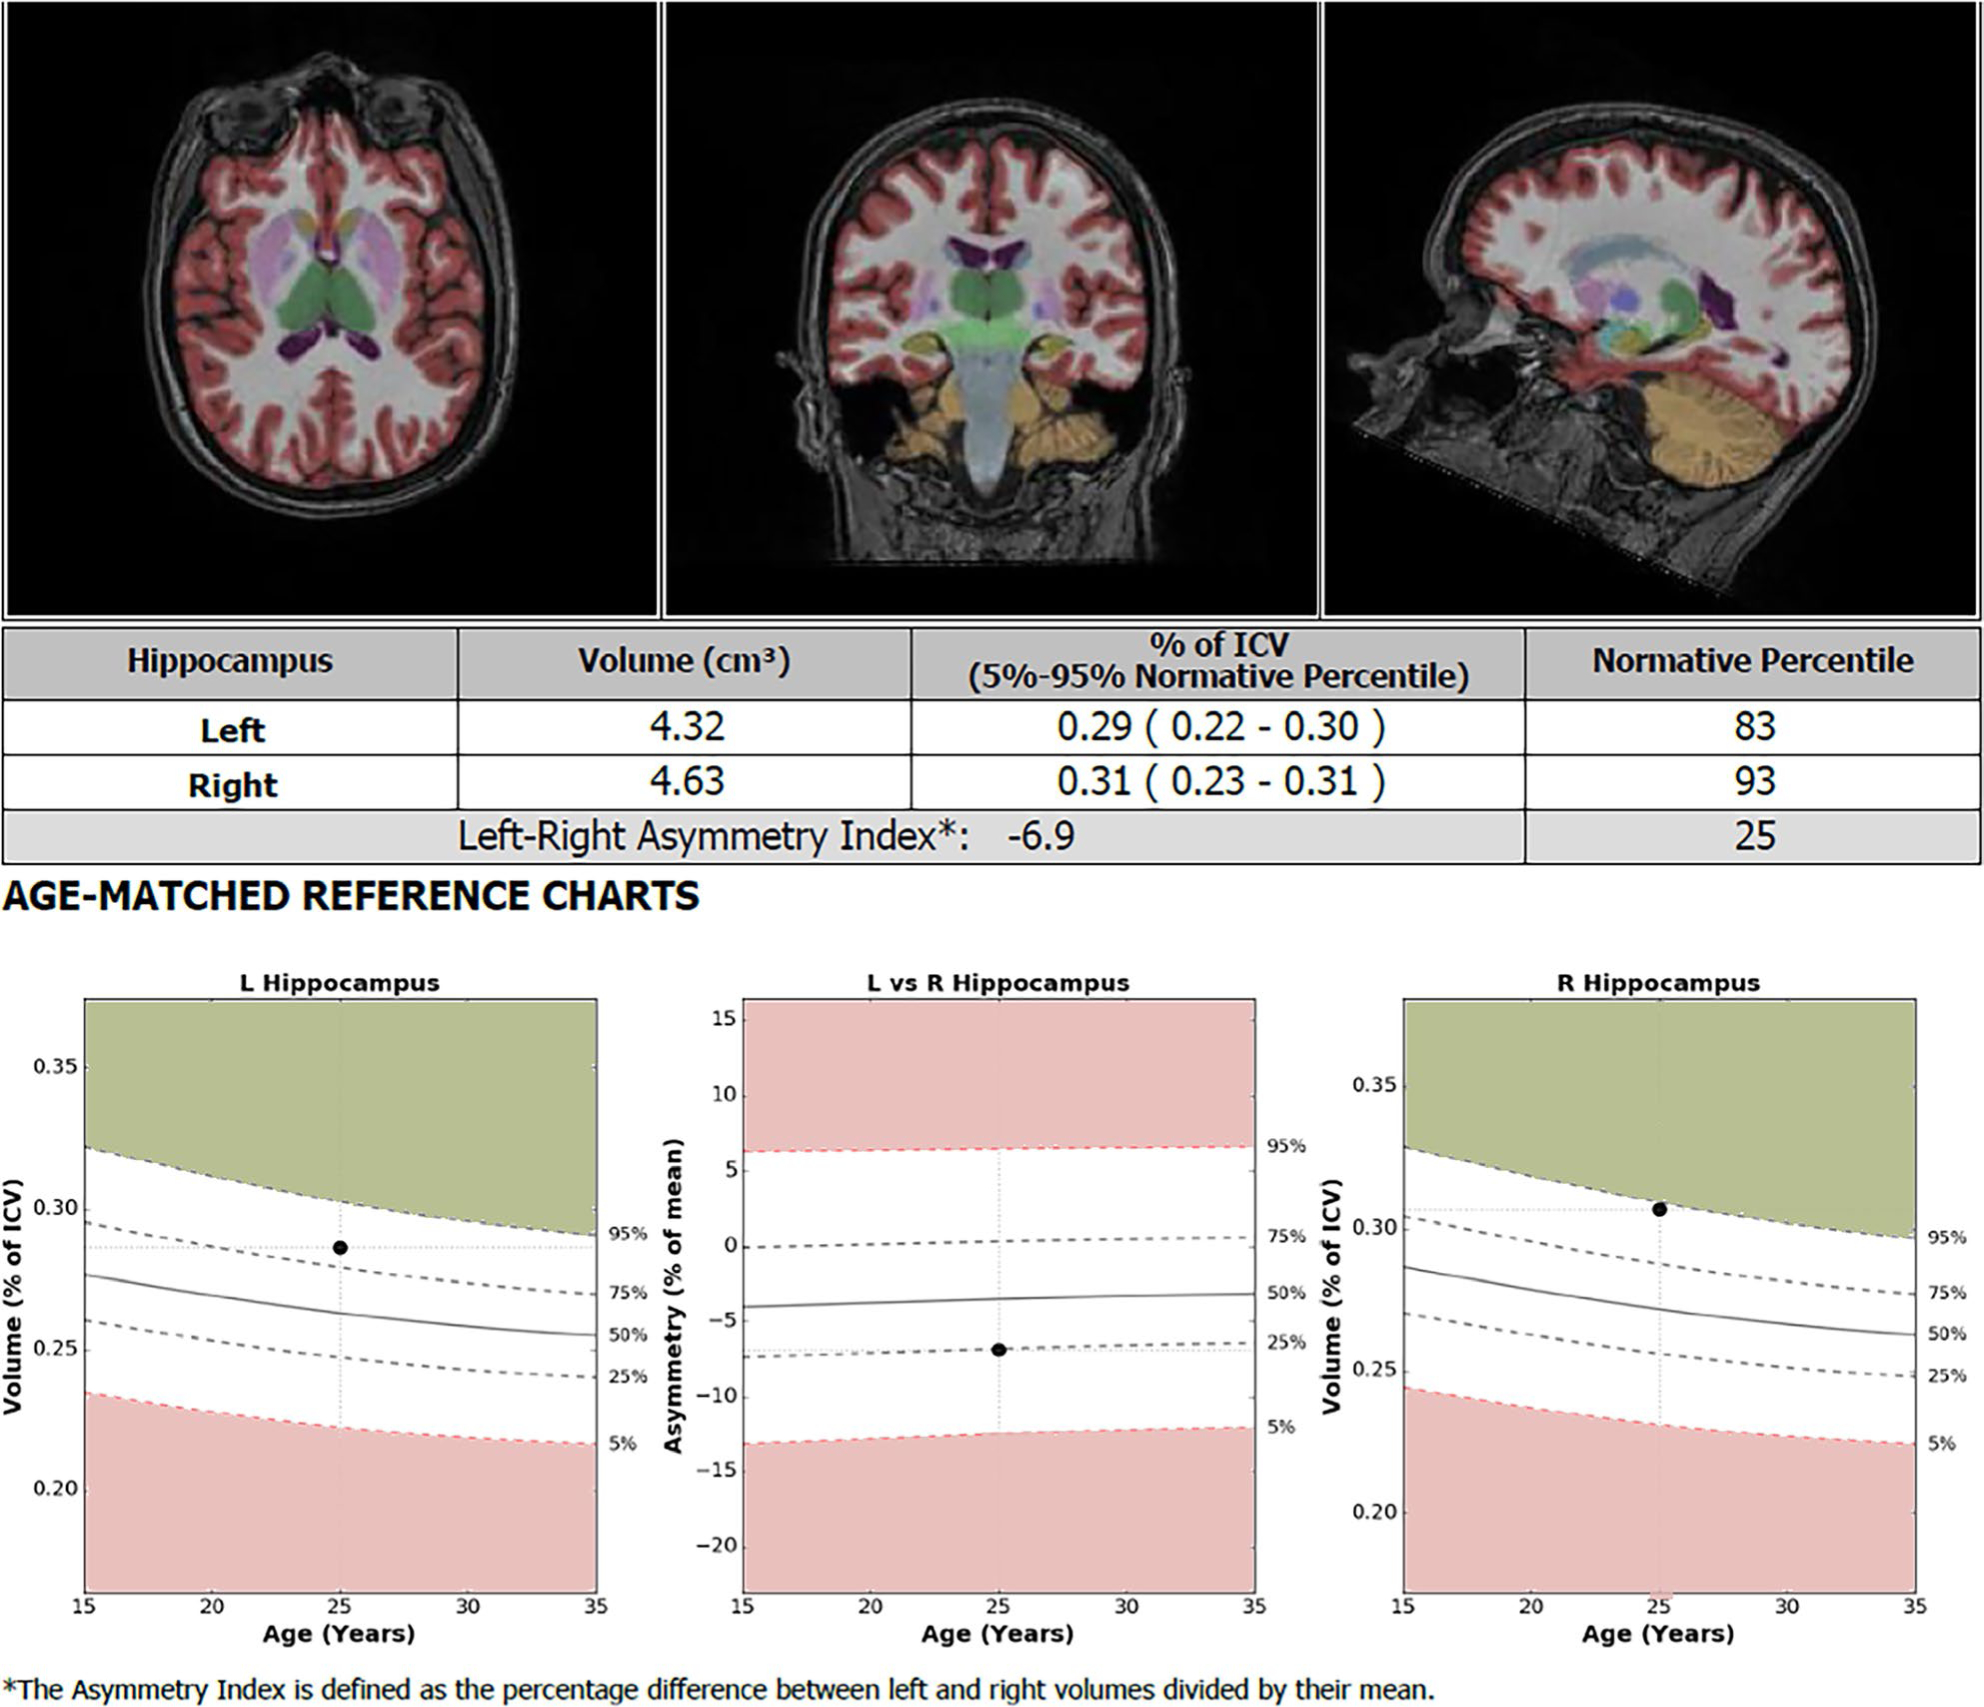
An example NeuroQuant anatomic volume analysis report of the hippocampus of a patient included in the study. Percentile data for selected regions of the brain are provided in a succinct report for clinical purposes, with 71 different brain regions analyzed
2.3 |. Statistical analysis
Statistical analysis was performed for both the whole cohort and right and left sides of surgery separately, with seizure freedom used as the main outcome measure. The study variables were summarized using the sample mean with standard deviation (SD) for continuous variables and count with proportion for categorical variables. A two-sample independent t test was applied to compare continuous variables, whereas Pearson chi-square test or Fisher exact test was used to compare categorical variables. Quantitative MRI variables significant at P < .05 on a two-sample t test were identified as potential predictor variables and entered into a multivariable regression model analysis. Correlation analysis of the predictors was conducted to avoid multi-collinearity in a regression model. A backward variable selection using the Akaike information criterion was performed to select a subset of predictors and obtain the final model. Using the Akaike information criterion, relative goodness of fit was used to perform model comparisons. All analyses were performed using SAS (version 9.4, SAS Institute Inc.) and using R software (version 3.6.3; R Foundation for Statistical Computing). The level of statistical significance was set at P < .05 (two-tailed).
3 |. RESULTS
3.1 |. Patient characteristics
Ninety patients (37 female, 53 male) were included in the study and underwent automated volumetric analysis. The mean age at the time of surgery was 26.1 (SD 16.4) years with a mean epilepsy duration of 13.3 (SD 11.3) years. Patients ages ranged from 3 years to 69 years, with 33 of 90 (36.7%) patients younger than 18 years of age. Table 1 demonstrates demographics, surgical variables, and seizure outcomes for patients included in the study, stratified by seizure outcome. Patients with at least 6 months of follow-up were included in the study. Patients had a mean last follow-up time of 3.5 (SD 2.5) years, with 48 of 90 (53.3%) patients demonstrating seizure freedom at last follow-up. Seventy-six patients had at least 1 year of follow-up. Of patients with left-sided surgery, 18 of 36 (50.0%) were seizure-free at the last follow-up. Of patients with right-sided surgery, 30 of 54 (55.6%) were seizure-free at the last follow-up. Five patients stopped anti-seizure medication (ASM) after surgery.
TABLE 1.
Summary demographic and surgical variables for patients included for volumetric analysis, stratified by seizure freedom
| Overall (N = 90) |
Not seizure-free (N = 42) |
Seizure-free (N = 48) |
p-Value | ||||
|---|---|---|---|---|---|---|---|
| Variable | N | Statistics | n | Statistics | n | Statistics | |
| Pre-operative seizure frequency | 87 | 56.5 ± 81.1 | 41 | 46.3 ± 70.9 | 46 | 65.6 ± 89.1 | .27a |
| Age at epilepsy onset | 90 | 12.8 ± 13.7 | 42 | 11.1 ± 11.1 | 48 | 14.3 ± 15.7 | .27a |
| Age at surgery | 90 | 26.1 ± 16.4 | 42 | 23.7 ± 14.3 | 48 | 28.3 ± 17.8 | .19a |
| Epilepsy duration | 90 | 13.3 ± 11.3 | 42 | 12.6 ± 10.2 | 48 | 13.9 ± 12.3 | .57a |
| Sex | |||||||
| Female | 90 | 37 (41.1) | 42 | 16 (38.1) | 48 | 21 (43.8) | .59c |
| Male | 53 (58.9) | 26 (61.9) | 27 (56.3) | ||||
| Pathology | |||||||
| Cryptogenic | 88 | 24 (27.3) | 42 | 10 (23.8) | 46 | 14 (30.4) | .89c |
| MCD | 41 (46.6) | 20 (47.6) | 21 (45.7) | ||||
| Tumor | 9 (10.2) | 5 (11.9) | 4 (8.7) | ||||
| Other | 14 (15.9) | 7 (16.7) | 7 (15.2) | ||||
| MRI | |||||||
| Abnormal | 90 | 65 (72.2) | 42 | 30 (71.4) | 48 | 35 (72.9) | .88c |
| Normal | 25 (27.8) | 12 (28.6) | 13 (27.1) | ||||
| Presence of GTCS | |||||||
| No | 85 | 13 (15.3) | 41 | 5 (12.2) | 44 | 8 (18.2) | .44c |
| Yes | 72 (84.7) | 36 (87.8) | 36 (81.8) | ||||
| Invasive monitoring | |||||||
| No | 90 | 42 (46.7) | 42 | 20 (47.6) | 48 | 22 (45.8) | .87c |
| Yes | 48 (53.3) | 22 (52.4) | 26 (54.2) | ||||
| Surgery side | |||||||
| Left | 90 | 36 (40.0) | 42 | 18 (42.9) | 48 | 18 (37.5) | .60c |
| Right | 54 (60.0) | 24 (57.1) | 30 (62.5) | ||||
| Surgical category | |||||||
| Partial lobectomy | 90 | 27 (30.0) | 42 | 12 (28.6) | 48 | 15 (31.3) | .90c |
| Subtotal lobectomy | 47 (52.2) | 23 (54.8) | 24 (50.0) | ||||
| Complete premotor lobectomy | 16 (17.8) | 7 (16.7) | 9 (18.8) | ||||
| Time at last follow-up (months) | 90 | 41.72 ± 29.72 | 42 | 45.14 ± 31.16 | 48 | 38.73 ± 28.39 | .31 |
| Proximity to eloquent areas | |||||||
| No | 88 | 47 (53.41) | 41 | 23 (56.10) | 47 | 24 (51.06) | .64c |
| Yes | 41 (46.59) | 18 (43.90) | 23 (48.94) | ||||
| Interictal EEG strictly focal | |||||||
| No | 90 | 70 (77.78) | 42 | 32 (76.19) | 48 | 38 (79.17) | .73c |
| Yes | 20 (22.22) | 10 (20.83) | 10 (20.83) | ||||
| Ictal EEG strictly focal | |||||||
| No | 87 | 50 (57.47) | 42 | 22 (52.38) | 45 | 28 (62.22) | .86c |
| Yes | 37 (42.53) | 20 (47.62) | 17 (37.78) | ||||
| Use of VPA prior to surgery (lifetime) | |||||||
| No | 90 | 45 (50) | 42 | 19 (45.24) | 48 | 26 (54.78) | .40c |
| Yes | 45 (50) | 23 (54.76) | 22 (45.83) | ||||
| Use of VPA when surgery was performed | |||||||
| No | 90 | 83 (92.22) | 42 | 38 (90.48) | 48 | 45 (93.75) | .56c |
| Yes | 7 (7.78) | 4 (9.52) | 3 (6.25) | ||||
| First-degree family member with epilepsy | |||||||
| No | 89 | 79 (88.76) | 42 | 35 (83.33) | 47 | 44 (93.62) | .13c |
| Yes | 10 (6.38) | 7 (16.67) | 3 (6.38) | ||||
Note: Statistics presented as mean ± SD or N (column %). P-values: a = two-sample t test; c = Pearson chi-square test.
Abbreviations: GTCS, generalized tonic-clonic seizure; MCD, malformation of cortical development; VPA, valproic acid.
Univariate statistical analysis of variables including preoperative seizure frequency, age at epilepsy onset, age at surgery, duration of epilepsy, histopathological diagnosis, MRI findings, invasive monitoring, and surgical category demonstrated no significant predictors of seizure outcome in this cohort (P < .05). Genetic testing was not performed in the majority of cases (93%). Four patients had a positive genetic test for tuberous sclerosis, and two had negative results.
Automated volumetric analysis using NeuroQuant was performed on preoperative MRI for all 90 patients. Patients were stratified based on seizure freedom, and volumes of brain regions were averaged and statistically analyzed.
3.2 |. Model development and results
The analysis was performed comparing automated volumetric percentiles in multiple brain regions between the patients considered seizure-free and non–seizure-free. Volumetric variables were separated into two categories: volumes of individual brain regions and volume asymmetry. Cortical volumes of individual brain regions were calculated as a percentile compared to age, sex, and cranial-volume matched controls. Volume asymmetry was calculated as a volumetric percentile difference between the left and right sides in the same patienťs brain, using percentiles compared to age-, sex-, and cranial-volume–matched controls. Utilizing the entire cohort of frontal lobectomy patients, volumetric variables were selected as potential predictors of seizure freedom based on univariate statistical analysis (Table 2). The cutoff threshold for the univariate analysis was 0.05. When utilizing the whole cohort, volumetric data on several brain regions were significant predictors of seizure outcome. The volumetric asymmetry between the left and right sides was a predictor of seizure outcome in the lingual gyrus, the middle frontal gyrus, the superior frontal gyrus, the premotor region, cerebral white matter hypointensities, and the posterior superior temporal sulcus. A significant difference in cortical volumes was found in the seizure–free and non–seizure-free groups in frontal regions (middle frontal gyrus and premotor regions) and extrafrontal regions (hippocampus, entorhinal cortex, occipital lobe, and nucleus accumbens). Whole-brain volume loss was not a significant predictor of seizure outcome. Neither frontal lobe volume loss nor asymmetry, hemispheric volume loss, or asymmetry was a significant predictor of seizure outcome. The backward variable selection method was used to select from these variables for the final multivariate logistic regression model. Final univariate predictors utilized included volumetric data from the lingual gyrus, superior frontal gyrus, cerebral white matter hypointensities, posterior superior temporal sulcus, hippocampus, entorhinal cortex, and nucleus accumbens. A final multivariate logistic model using these predictors was developed with a c-statistic of 0.846. A receiver-operating characteristic (ROC) curve for this model is demonstrated in Figure 2A. The model was then bolstered with nomogram clinical predictors previously validated to predict seizure outcomes, including sex, epilepsy duration, seizure frequency, presence of generalized tonic-clonic seizures, and pathology findings.14 Using both the volumetric MRI and clinical predictors, we developed a final multivariate logistic model with a c-statistic of 0.897. An ROC curve for this model is demonstrated in Figure 2B. A heat-map visual representation was generated using the t-statistics of the final univariate predictors and is demonstrated in Figure 3. Table S1 shows the final multivariate logistical regression variables and results for the whole cohort.
TABLE 2.
Volumetric variables selected as potential predictors based on univariate statistical analysis
| Overall (N = 90) |
Not seizure free (N = 42) |
Seizure free (N = 48) |
p-Value | ||||
|---|---|---|---|---|---|---|---|
| Factor | N | Percentiles | n | Percentiles | n | Percentiles | |
| Cortical volume asymmetry between left and right sides | |||||||
| Lingual gyrus, asymmetry | 90 | 44.5 ± 33.0 | 42 | 32.4 ± 30.4 | 48 | 55.1 ± 31.7 | <.001a |
| Middle frontal gyrus, asymmetry | 90 | 56.6 ± 32.2 | 42 | 44.5 ± 32.3 | 48 | 67.1 ± 28.5 | <.001a |
| Superior frontal gyrus, Asymmetry | 90 | 67.3 ± 30.5 | 42 | 74.3 ± 26.3 | 48 | 61.2 ± 32.9 | .042a |
| Premotor region, asymmetry | 90 | 57.2 ± 33.0 | 42 | 46.8 ± 33.9 | 48 | 66.4 ± 29.6 | .004a |
| Cerebral white matter hypointensities, asymmetry | 90 | 47.7 ± 35.0 | 42 | 56.1 ± 34.8 | 48 | 40.4 ± 33.9 | .033a |
| Posterior superior temporal sulcus, asymmetry | 90 | 21.1 ± 31.1 | 42 | 13.6 ± 26.3 | 48 | 27.7 ± 33.7 | .032a |
| Cortical volume compared to normative controls | |||||||
| Hippocampus, right | 90 | 47.5 ± 32.1 | 42 | 39.5 ± 30.5 | 48 | 54.6 ± 32.2 | .025a |
| Entorhinal cortex, left | 90 | 37.7 ± 31.2 | 42 | 47.1 ± 30.8 | 48 | 29.5 ± 29.4 | .007a |
| Middle frontal gyrus, left | 90 | 61.6 ± 30.1 | 42 | 54.5 ± 31.4 | 48 | 67.8 ± 27.8 | .036a |
| Nucleus accumbens, right | 90 | 36.4 ± 29.5 | 42 | 29.2 ± 25.0 | 48 | 42.6 ± 31.9 | .031a |
| Occipital lobe, left | 90 | 44.9 ± 32.3 | 42 | 37.6 ± 31.3 | 48 | 51.2 ± 32.1 | .045a |
| Premotor region, left | 90 | 64.1 ± 29.8 | 42 | 57.0 ± 30.2 | 48 | 70.4 ± 28.2 | .032a |
Note: Statistics presented as mean ± SD. P-values: two-sample t test. (P < .05) of seizure freedom in all patients who underwent frontal lobectomy. All volumetric variables determined as percentiles compared to age-, sex-, and cranial-volume-matched controls. Volume asymmetry calculated as a volumetric percentile difference between the left and right sides, compared to controls.
FIGURE 2.
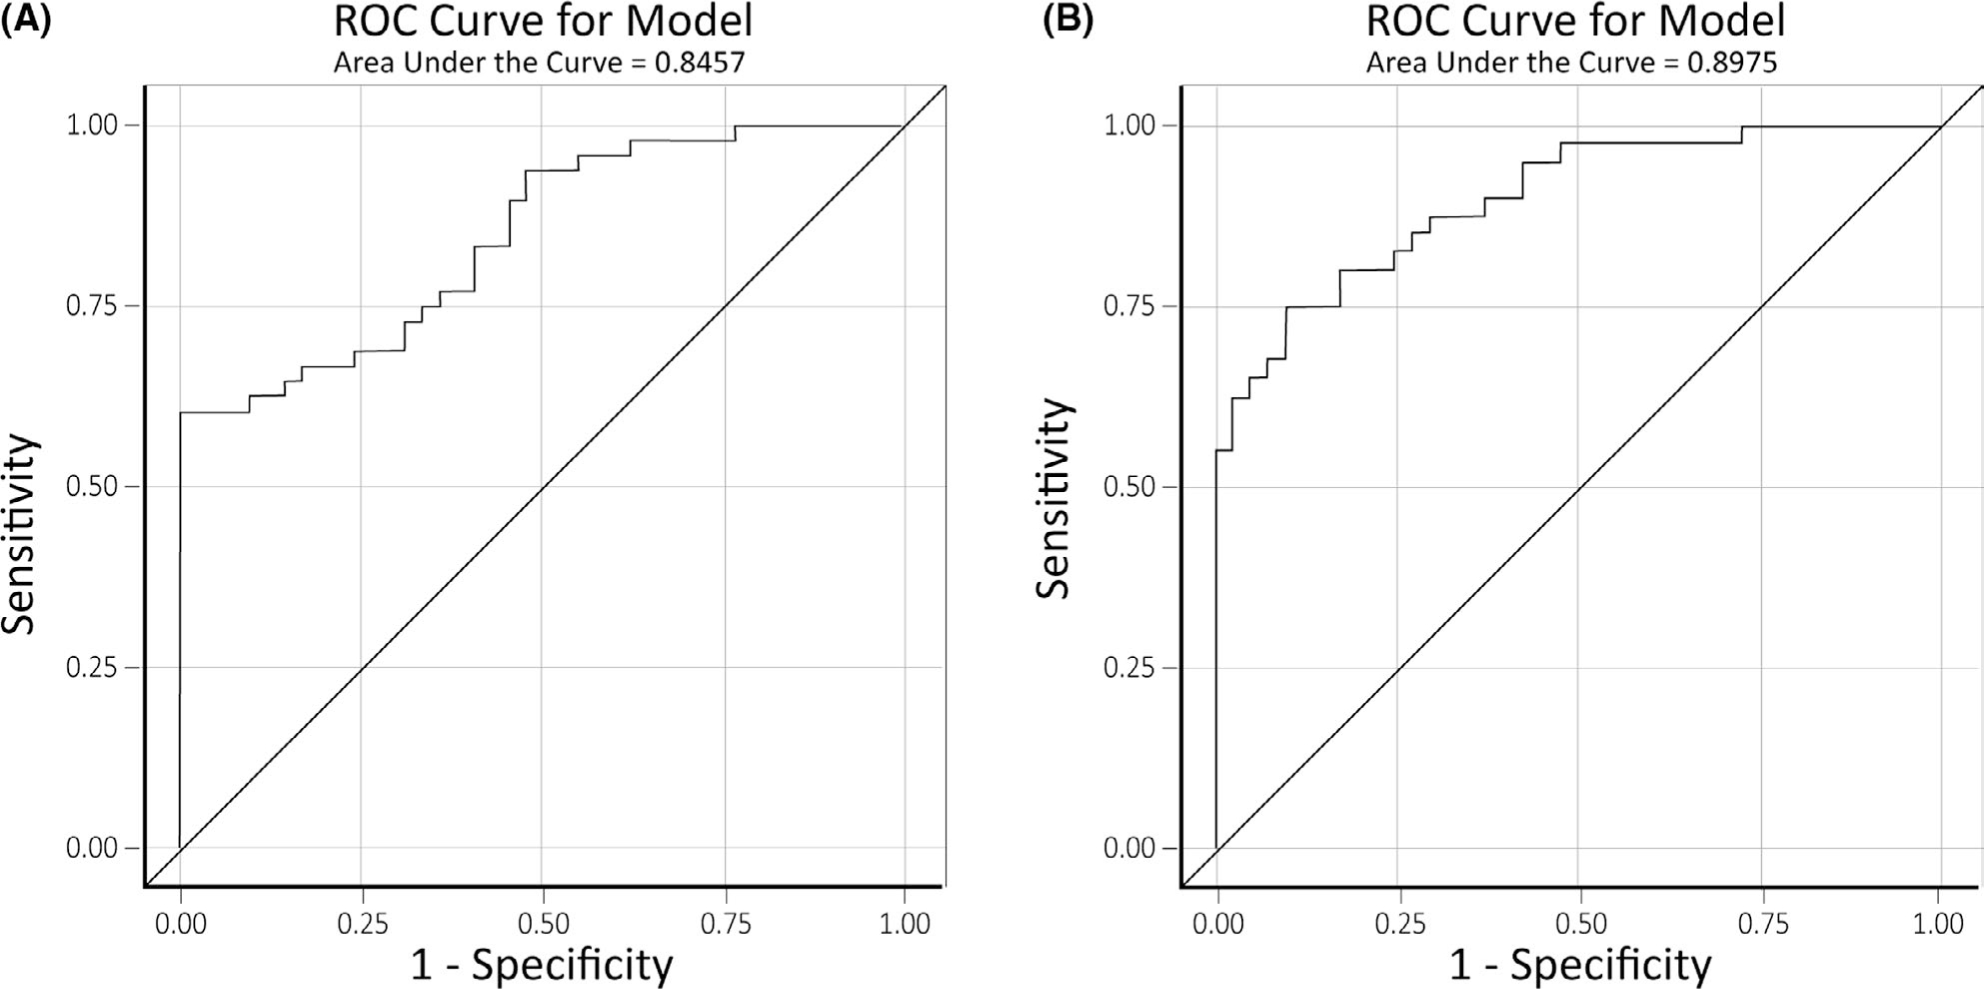
(A) Receiver-operating characteristic (ROC) curve for the model developed to predict seizure outcomes after frontal lobectomy using only quantitative magnetic resonance imaging (MRI) cortical volume data. (B) ROC curve for the model developed to predict seizure outcomes after frontal lobectomy using both quantitative MRI cortical volume data and clinical predictors
FIGURE 3.

A heat-map demonstrating the structures identified by the model as seizure outcome predictors based on univariate analysis of preoperative volume loss and volume asymmetry. T-statistics are represented as a t-score, with cool colors representing negative t-values and hot colors representing positive t-values
Model development was additionally attempted using volumetric data and seizure outcomes stratified by laterality of surgery. Because we evaluated subtle volumetric changes and given the robust evidence that left and right hemispheres are structurally and functionally different,15–20 we chose to perform separate subgroup analyses for right-sided and left-sided surgeries, rather than comparing ipsilateral and contralateral hemispheres of both groups combined, even though the latter approach would have improved power.
Using only patients who underwent right-sided frontal lobectomy or left-sided frontal lobectomy, volumetric variables were again selected as potential predictors of seizure freedom based on univariate statistical analysis (P < .05, Table 3). Volumetric variables were again separated into two categories: volumes of individual brain regions and atrophy volume. Backward variable selection was used to select from these variables for a final multivariate logistic regression model for both cohorts. The model developed for right-sided frontal lobectomies using only NeuroQuant-derived volumetric data had a c-statistic of 0.783. When bolstered with the previously listed clinical predictors, the model demonstrated a c-statistic of 0.818. The model developed for left-sided frontal lobectomies using only volumetric data had a c-statistic of 0.975. When bolstered with clinical predictors, the model demonstrated complete separation of data points, indicating the linear combination of predictors yielded a perfect prediction of the response variable.
TABLE 3.
Volumetric variables selected as potential predictors based on univariate statistical analysis
|
Right-sided surgery
|
Overall (N = 54)
|
Not seizure free (N = 24)
|
Seizure free (N = 30)
|
||||
| Factor | N | Statistics | N | Statistics | n | Statistics | p-Value |
| Cortical volume asymmetry between left and right sides | |||||||
| Middle frontal gyrus, asymmetry | 54 | 55.6 ± 31.6 | 24 | 43.9 ± 32.3 | 30 | 65.1 ± 28.0 | .013 |
| Cerebral white matter, asymmetry | 54 | 68.2 ± 34.5 | 24 | 79.5 ± 28.6 | 30 | 59.1 ± 36.5 | .029 |
| Cortical volume compared to normative controls | |||||||
| Entorhinal cortex, left | 54 | 37.0 ± 32.6 | 24 | 47.5 ± 34.3 | 30 | 28.6 ± 29.1 | .033 |
|
| |||||||
|
Left-sided surgery
|
Overall (N = 36)
|
Not seizure free (N = 18)
|
Seizure free (N = 18)
|
||||
| Factor | N | Statistics | n | Statistics | n | Statistics | p-Value |
| Cortical volume asymmetry between left and right sides | |||||||
| Hippocampus, asymmetry | 36 | 48.8 ± 35.6 | 18 | 60.8 ± 37.8 | 18 | 36.9 ± 29.7 | .042 |
| Lingual gyrus, asymmetry | 36 | 48.8 ± 32.6 | 18 | 32.1 ± 25.9 | 18 | 65.4 ± 30.4 | .001 |
| Middle frontal gyrus, asymmetry | 36 | 57.9 ± 33.6 | 18 | 45.4 ± 33.2 | 18 | 70.5 ± 29.8 | .023 |
| Middle temporal gyrus, asymmetry | 36 | 58.8 ± 28.2 | 18 | 48.8 ± 26.7 | 18 | 68.7 ± 26.6 | .032 |
| Premotor region, asymmetry | 36 | 59.9 ± 31.6 | 18 | 47.6 ± 31.5 | 18 | 72.3 ± 27.3 | .017 |
| Cortical volume compared to normative controls | |||||||
| Temporal pole, right | 36 | 45.8 ± 35.9 | 18 | 34.0 ± 27.4 | 18 | 57.6 ± 40.1 | .047 |
| Inferior temporal gyrus, right | 36 | 46.4 ± 33.3 | 18 | 35.3 ± 28.5 | 18 | 57.6 ± 34.7 | .043 |
| Lingual gyrus, left | 36 | 48.6 ± 30.9 | 18 | 37.9 ± 25.5 | 18 | 59.2 ± 32.8 | .036 |
| Premotor region, left | 36 | 67.4 ± 31.5 | 18 | 57.1 ± 33.5 | 18 | 77.7 ± 26.4 | .048 |
Note: Statistics presented as mean ± SD; P-values: two-sample t test. (P < .05) of seizure freedom in patients stratified by laterality of surgery. All volumetric variables determined as percentiles compared to age-, sex-, and cranial-volume-matched controls. Cortical volume asymmetry calculated as volumetric percentile difference in atrophy between the left and right sides, compared to controls.
4 |. DISCUSSION
In this study, we attempted to develop a novel preoperative prognostic tool for seizure outcome risk stratification in patients undergoing frontal lobectomy. Using only cortical volume data for individual brain regions, we developed a model that demonstrates excellent discrimination, as evidenced by a high concordance index when predicting seizure outcomes. With large, dedicated studies demonstrating long-term seizure freedom rates between 27.0% and 45.1%, medically resistant frontal lobe epilepsy has proven more difficult to successfully treat with surgical resection than temporal lobe epilepsy.1,5,6 Various explanations have been proposed, often implicating the frontal lobe's vast interlobar connectivity, the eloquent brain regions that reside in the frontal lobe, and the heterogeneous nature of resective surgical boundaries compared to the more standardized temporal lobectomy. Several studies have attempted to identify prognostic indicators to improve patient selection for potential frontal lobe surgery.1,21,22 These studies have generally focused on analyzing traditional data collected during the preoperative and intraoperative period, but recent literature on temporal lobe epilepsy surgery has analyzed global and focal brain volume loss in relation to postoperative seizure outcomes.23–2 Although many of these studies have demonstrated a relationship between extratemporal and global cortical structural abnormalities and worse seizure outcomes in temporal lobe epilepsy, no studies have analyzed quantitative MRI data and its relationship with seizure outcomes after frontal lobectomy.26 Because frontal lobe resections carry the possibility of long-term neuropsychological dysfunction, motor and speech deficits, and normal neurosurgical operative risks, improving the preoperative screening and selection of patients for frontal lobectomy is paramount.4,27 Developing new tools, such as automated analysis of local and remote cortical volume loss, could vastly improve our ability to risk-stratify patients before they undergo large resective surgeries. In the recent past, analysis of preoperative imaging data sets in a powerful, granular manner was a prohibitively time-intensive process, fraught with issues with inter-rater reliability and generalizability.26 With the increasingly widespread availability of standardized, easy-to-use tools for the processing and analysis of large imaging data sets, the opportunity exists to develop novel preoperative radiographic predictors of seizure outcomes, which could be generalized for widespread use in preoperative risk stratification in patients with medically resistant frontal lobe epilepsy. If proven valuable, it would be relatively simple to add one of the several volumetric imaging analysis tools that currently exist to the epileptologists' preoperative armamentarium.
When analyzing our results, cortical volume loss in several regions of the brain was found to be a significant predictor of seizure outcome. Of interest, these regions were found to be both frontal and extrafrontal. Several studies have demonstrated that grossly abnormal MRI findings in the frontal lobe, such as cortical dysplasia or tumor, are associated with significantly improved outcomes compared to MRI studies that are deemed nonlesional.28,29 Even when a clearly identified frontal lesion is completely resected, a subset of patients will not remain seizure-free. In these patients, it seems entirely possible that there may be other regions of the brain, less clearly identifiable with our current preoperative workup, involved in an epilepsy network that extends outside of the frontal lobe. If extrafrontal regions are involved, it could be posited that over time they may demonstrate cortical volume loss that can be identified only with meticulous quantitative imaging analysis. In this way, we may be mislocalizing a broader epilepsy network as frontal lobe epilepsy in both lesional and nonlesional patients. Our study would seem to suggest that cortical volume loss, in some cases in regions significantly distant from the frontal lobe, could be a structural correlate for a more widespread epilepsy network. Patients demonstrating these findings would seem to be less likely to be seizure-free after frontal lobectomy.
With a relatively homogenous surgical population and a more frequently performed procedure, several studies have attempted to determine a similar relationship between quantitative imaging data and surgical outcomes after temporal lobectomy. Specifically focusing on extra-hippocampal structures, volume loss in the entorhinal cortex, cingulum, fronto-occipital fasciculus, caudate, longitudinal fasciculus, bilateral posterior medial temporal lobe, and bilateral thalamus have all been associated with seizure recurrence in individual studies.24,26,30 Similarly, widespread, occasionally subtle, gray matter volume loss outside of the temporal lobe has been associated with surgical failures after temporal lobectomy.23 This would seem to indicate that cortical volume loss, especially in areas outside of the targeted surgical boundaries, may be a structural correlate for a more widespread or mislocalized epilepsy network, and thus poorer seizure outcomes. Recently, studies have utilized diffusion tensor imaging and automated fiber quantification to successfully predict seizure outcomes based on imaging findings alone in patients undergoing temporal lobectomy.33,34 These studies have demonstrated the promise and utility of using automated, intensive imaging analysis as part of the preoperative risk stratification process in patients with medically refractory epilepsy.
To the best of our knowledge, this is the first study to demonstrate a structural correlate between cortical volume loss in a proposed frontal lobe epilepsy network and seizure outcomes in patients who underwent frontal lobectomy. A recent analysis of children with frontal lobe epilepsy found marked cortical volume loss in the bilateral middle frontal gyrus, lingual gyrus, and occipitotemporal gyrus when compared with normal controls, but did not correlate these findings with surgical success rates.35 Of interest, volumetric analysis of the middle frontal gyrus, lingual gyrus, and occipital lobe were all found to be significant predictors of seizure outcomes in our study as well. The lingual gyrus and occipital lobe demonstrate robust connections to the inferior frontal gyrus through the occipitofrontal fasciculus.36 Due to the vast interlobar connectivity of the frontal lobe, all of the extrafrontal regions found to be significant volumetric predictors of seizure outcome in this study have white matter connections with the frontal lobe.36,37 It is difficult to ascertain a singular pattern or explanation that unites the various regions found to be significant. Still, each region can be explained individually based on the frontal lobe's immense structural connectivity with essentially every other major region of the brain. Fluorodeoxyglucose positron emission tomography studies have demonstrated hypometabolism in several extrafrontal regions in patients with frontal lobe epilepsy, further highlighting the highly connected nature of the frontal lobe.38 It could be hypothesized that our findings are indicators of substantial seizure spread outside of the frontal lobe, presence of a secondary seizure focus, or mislocalization of a much broader epileptogenic zone.35 In this way, significant amounts of subtle extrafrontal cortical volume loss could be the “canary in the coal mine” for a much larger or more complex epilepsy network for patients presumed to have frontal lobe epilepsy. These patients would then be presumed to have a lower likelihood of seizure freedom after frontal lobectomy. Because frontal lobectomy outcomes still lag behind several other surgical epilepsy interventions, any tools that can be developed to better risk stratify potential surgical candidates should be investigated.
Our study has several limitations. Frontal lobectomy patients are a much more heterogeneous cohort in terms of surgical boundaries than temporal lobectomy patients. We attempted to stratify our patients based on surgical size, but even these cohorts displayed varied locations and resection sizes. Because of this, our results may not be generalizable to all types of frontal lobe surgeries. As a retrospective study, it is potentially affected by both observer and interpretation bias. The sample size was an additional limitation, which may limit the immediate generalizability of our results. This limitation was especially relevant when we performed volumetric analysis stratified by laterality, as it further reduced the sample size when organized by left-and right-sided surgery. This analysis was included for completeness, but due to the small number of patients, particularly in the left-sided surgery cohort, it may not be large enough to make confident conclusions.
Another limitation is that we did not analyze the potential effect of ASMs on cortical volumes. It has been reported that valproic acid (VPA) can affect regional cortical thickness,39 but no regional cortical atrophy has been reported for other ASMs to our knowledge. Even though we did not perform a direct analysis of the effect of VPA on regional volumes in this series, the equal distribution of previous use of VPA between seizure-free and non–seizure-free groups (Table 1) is indirect evidence that any confounding effect of VPA in our results would be negligible.
We included a wide variety of ages (range 3–69 years), which may also be a limitation as it makes it difficult to determine reproducibility within specific age ranges. To try to overcome this limitation, we used the percentile value instead of the raw volume data. The percentile compares cortical volumes to age- and sex-matched controls and therefore minimizes age influence on this analysis. Because only a few patients were 55 years or older, it is difficult to make conclusions about the effect of aging and normal brain atrophy in our study. In addition, due to the limited number of frontal lobectomy patients with adequate preoperative imaging available for analysis, our study lacked a validation group.
This study utilized automated, quantitative MRI analysis of cortical volume loss to develop predictors of seizure outcomes after frontal lobectomy. Further investigation and validation studies are needed, but quantitative MRI analysis may hold promise as an additional preoperative tool in risk stratification of patients considered for frontal lobe epilepsy surgery.
Supplementary Material
Key points.
We used automated, quantitative MRI analysis of cortical volume loss to develop predictors of seizure outcomes after frontal lobectomy
Volume loss of several frontal and extrafrontal regions was a statistically significant predictor of seizure recurrence
Models were developed with excellent predictive capabilities of seizure outcomes based solely on preoperative imaging analysis
Further investigation and validation studies are needed, but quantitative MRI analysis may hold promise as an additional preoperative tool
ACKNOWLEDGMENTS
Research reported is supported by the National Institute of Neurological Disorders and Stroke of the National Institutes of Health under award number 1RO1NS097719-01A1.
Funding information
National Institute of Neurological Disorders and Stroke, Grant/Award Number: 1RO1NS097719-01A1
Footnotes
CONFLICT OF INTEREST
None of the authors has any conflict of interest to disclose. Data reported followed Strengthening the Reporting of Observational studies in Epidemiology (STROBE) guidelines. We confirm that we have read the Journal's position on issues involved in ethical publication and affirm that this report is consistent with those guidelines.
SUPPORTING INFORMATION
Additional supporting information may be found online in the Supporting Information section.
REFERENCES
- 1.Jeha LE, Najm I, Bingaman W, Dinner D, Widdess-Walsh P, Lüders H. Surgical outcome and prognostic factors of frontal lobe epilepsy surgery. Brain. 2007;130:574–84. [DOI] [PubMed] [Google Scholar]
- 2.Morace R, Casciato S, Quarato PP, Mascia A, D'Aniello A, Grammaldo LG, et al. Long-term seizure outcome in frontal lobe epilepsy surgery. Epilepsy Behav. 2019;90:93–8. [DOI] [PubMed] [Google Scholar]
- 3.Simasathien T, Vadera S, Najm I, Gupta A, Bingaman W, Jehi L. Improved outcomes with earlier surgery for intractable frontal lobe epilepsy. Ann Neurol. 2013;73:646–54. [DOI] [PubMed] [Google Scholar]
- 4.Busch RM, Floden DP, Ferguson L, Mahmoud S, Mullane A, Jones S, et al. Neuropsychological outcome following frontal lobectomy for pharmacoresistant epilepsy in adults. Neurology. 2017;88:692–700. [DOI] [PMC free article] [PubMed] [Google Scholar]
- 5.Téllez-Zenteno JF, Dhar R, Wiebe S. Long-term seizure outcomes following epilepsy surgery: a systematic review and meta-analysis. Brain. 2005;128:1188–98. [DOI] [PubMed] [Google Scholar]
- 6.Englot DJ, Wang DD, Rolston JD, Shih TT, Chang EF. Rates and predictors of long-term seizure freedom after frontal lobe epilepsy surgery: a systematic review and meta-analysis. J Neurosurg. 2012;116:1042–8. [DOI] [PubMed] [Google Scholar]
- 7.Galovic M, van Dooren VQH, Postma T, Vos SB, Caciagli L, Borzì G, et al. Progressive cortical thinning in patients with focal epilepsy. JAMA Neurol. 2019;76(10):1230. [DOI] [PMC free article] [PubMed] [Google Scholar]
- 8.Persson K, Selbæk G, Brækhus A, Beyer M, Barca M, Engedal K. Fully automated structural MRI of the brain in clinical dementia workup. Acta Radiol. 2017;58:740–7. [DOI] [PubMed] [Google Scholar]
- 9.Brewer JB. Fully-automated volumetric MRI with normative ranges: translation to clinical practice. Behav Neurol. 2009;21:21–8. [DOI] [PMC free article] [PubMed] [Google Scholar]
- 10.Kwan P, Arzimanoglou A, Berg AT, Brodie MJ, Allen Hauser W, Mathern G, et al. Definition of drug resistant epilepsy: consensus proposal by the ad hoc Task Force of the ILAE Commission on Therapeutic Strategies. Epilepsia. 2010;51:1069–77. [DOI] [PubMed] [Google Scholar]
- 11.Durnford AJ, Rodgers W, Kirkham FJ, Mullee MA, Whitney A, Prevett M, et al. Very good inter-rater reliability of Engel and ILAE epilepsy surgery outcome classifications in a series of 76 patients. Seizure. 2011;20:809–12. [DOI] [PubMed] [Google Scholar]
- 12.Luo W, Airriess C, Albright J. The NeuroQuant Normative Database: Comparing Individual Brain Structures [White Paper]. San Diego, CA: CorTech Labs, Inc.; 2015.
- 13.Louis S, Morita-Sherman M, Jones S, Vegh D, Bingaman W, Blumcke I, et al. Hippocampal sclerosis detection with NeuroQuant compared with neuroradiologists. AJNR Am J Neuroradiol. 2020;41:591–7. [DOI] [PMC free article] [PubMed] [Google Scholar]
- 14.Jehi L, Yardi R, Chagin K, Tassi L, Russo GL, Worrell G, et al. Development and validation of nomograms to provide individualised predictions of seizure outcomes after epilepsy surgery: a retrospective analysis. Lancet Neurol. 2015;14:283–90. [DOI] [PubMed] [Google Scholar]
- 15.Kong XZ, Mathias SR, Guadalupe T, Glahn DC, Franke B, Crivello F, et al. Mapping cortical brain asymmetry in 17,141 healthy individuals worldwide via the ENIGMA Consortium. Proc Natl Acad Sci USA. 2018;115(22):E5154–63. [DOI] [PMC free article] [PubMed] [Google Scholar]
- 16.Whelan CD, Altmann A, Botia JA, Jahanshad N, Hibar DP, Absil J, et al. Structural brain abnormalities in the common epilepsies assessed in a worldwide ENIGMA study. Brain. 2018;141:391–408. [DOI] [PMC free article] [PubMed] [Google Scholar]
- 17.de Campos BM, Coan AC, Lin Yasuda C, Casseb RF, Cendes F. Large-scale brain networks are distinctly affected in right and left mesial temporal lobe epilepsy. Hum Brain Mapp. 2016;37:3137–52. [DOI] [PMC free article] [PubMed] [Google Scholar]
- 18.Kemmotsu N, Girard HM, Bernhardt BC, Bonilha L, Lin JJ, Tecoma ES, et al. MRI analysis in temporal lobe epilepsy: cortical thinning and white matter disruptions are related to side of seizure onset. Epilepsia. 2011;52:2257–66. [DOI] [PMC free article] [PubMed] [Google Scholar]
- 19.Bonilha L, Rorden C, Halford JJ, Eckert M, Appenzeller S, Cendes F, et al. Asymmetrical extra-hippocampal grey matter loss related to hippocampal atrophy in patients with medial temporal lobe epilepsy. J Neurol Neurosurg Psychiatry. 2007;78:286–94. [DOI] [PMC free article] [PubMed] [Google Scholar]
- 20.Keller SS, Mackay CE, Barrick TR, Wieshmann UC, Howard MA, Roberts N. Voxel-based morphometric comparison of hippocampal and extrahippocampal abnormalities in patients with left and right hippocampal atrophy. NeuroImage. 2002;16:23–31. [DOI] [PubMed] [Google Scholar]
- 21.Lazow SP, Thadani VM, Gilbert KL, Morse RP, Bujarski KA, Kulandaivel K, et al. Outcome of frontal lobe epilepsy surgery. Epilepsia. 2012;53:1746–55. [DOI] [PubMed] [Google Scholar]
- 22.Holtkamp M, Sharan A, Sperling MR. Intracranial EEG in predicting surgical outcome in frontal lobe epilepsy. Epilepsia. 2012;53:1739–45. [DOI] [PubMed] [Google Scholar]
- 23.Yasuda CL, Valise C, Saúde AV, Pereira AR, Pereira FR, Ferreira Costa AL, et al. Dynamic changes in white and gray matter volume are associated with outcome of surgical treatment in temporal lobe epilepsy. NeuroImage 2010;49:7–9. [DOI] [PubMed] [Google Scholar]
- 24.Keller SS, Richardson MP, O'Muircheartaigh J, Schoen-Bake JC, Elger C, Weber B. Morphometric MRI alterations and postoperative seizure control in refractory temporal lobe epilepsy. Hum Brain Mapp. 2015;36:163–47. [DOI] [PMC free article] [PubMed] [Google Scholar]
- 25.Bernhardt BC, Bernasconi N, Concha L, Bernasconi A. Cortical thickness analysis in temporal lobe epilepsy: reproducibility and relation to outcome. Neurology. 2010;74:177–84. [DOI] [PubMed] [Google Scholar]
- 26.Bonilha L, Keller SS. Quantitative MRI in refractory temporal lobe epilepsy: relationship with surgical outcomes. Quant Imaging Med Surg. 2015;5:20–24. [DOI] [PMC free article] [PubMed] [Google Scholar]
- 27.Helmstaedter C, Gleibner U, Zentner J, Elger CE. Neuropsychological consequences of epilepsy surgery in frontal lobe epilepsy. Neuropsychologia. 1998;36:33–41. [DOI] [PubMed] [Google Scholar]
- 28.Cascino GD, Jack CR, Parisi JE, Marsh WR, Kelly PJ, Sharbrough FW, et al. MRI in the presurgical evaluation of patients with frontal lobe epilepsy and children with temporal lobe epilepsy: pathologic correlation and prognostic importance. Epilepsy Res. 1992;11:51–9. [DOI] [PubMed] [Google Scholar]
- 29.Lorenzo NY, Parisi JE, Cascino GD, Jack CR, Marsh WR, Hirschorn KA. Intractable frontal lobe epilepsy: pathological and MRI features. Epilepsy Res. 1995;20:171–8. [DOI] [PubMed] [Google Scholar]
- 30.Bernhardt BC, Kim H, Bernasconi N. Patterns of subregional mesiotemporal disease progression in temporal lobe epilepsy. Nuroogy 2013;81:1840–7. [DOI] [PMC free article] [PubMed] [Google Scholar]
- 31.Feis DL, Schoene-Bake JC, Elger C, Wagner J, Tittgemeyer M, Weber B. Prediction of post-surgical seizure outcome in left mesial temporal lobe epilepsy. Neuroimage Clin 2013;2:903–11. [DOI] [PMC free article] [PubMed] [Google Scholar]
- 32.Keller SS, Cresswell P, Denby C, Wieshmann U, Eldridge P, Baker G, et al. Persistent seizures following left temporal lobe surgery are associated with posterior and bilateral structural and functional brain abnormalities. Eilesys. 2007;74:131–9. [DOI] [PubMed] [Google Scholar]
- 33.Keller SS, Glenn GR, Weber B, Kreilkamp BA, Jensen JH, Helpern JA, et al. Preoperative automated fibre quantification predicts postoperative seizure outcome in temporal lobe epilpsy. Brain. 2017;140:68–82. [DOI] [PMC free article] [PubMed] [Google Scholar]
- 34.Bonilha L, Jensen JH, Baker N, Breedlove J, Nesland T, Lin JJ, et al. The brain connectome as a personalized biomarker of seizure outcomes after temporal lobectomy. Neurology. 2015;84:1846–53. [DOI] [PMC free article] [PubMed] [Google Scholar]
- 35.Rahatli FK, Sezer T, Has AC, Agildere AM. Evaluation of cortical thickness and brain volume on 3 Tesla magnetic resonance imaging in children with frontal loe e lepsy. Neurol Sci 2020;41:825–33. [DOI] [PubMed] [Google Scholar]
- 36.Briggs RG, Chakraborty AR, Anderson CD, Abraham CJ, Palejwala AH, Conner AK, et al. Anatomy and white matter connections of the inferor fontl gyrus. Clin Anat 2019;32:546–56. [DOI] [PubMed] [Google Scholar]
- 37.Kier EL, Staib LH, Davis LM, Bronen RA. MR imaging of the temporal stem: anatomic dissection tractography of the uncinate fasciculus, inferior occipitofrontal fasciculus, and Meyer's loop of the optic radition AJNR Am J Neuroradiol 2004;25:677–91. [PMC free article] [PubMed] [Google Scholar]
- 38.da Silva EA, Chugani DC, Muzik O, Chugani HT. Identification of frontal lobe epileptic foci in children using positron emision omoraphy. Epilepsia. 1997;38:1198–208. [DOI] [PubMed] [Google Scholar]
- 39.Pardoe HR, Berg AT, Jackson GD. Sodium valproate use is associated with reduced parietal lobe thickness and brain volume. Neurology. 2013;80:1895–900. [DOI] [PMC free article] [PubMed] [Google Scholar]
Associated Data
This section collects any data citations, data availability statements, or supplementary materials included in this article.