

Abstract
Background:
The E4 allele of the APOE gene is known to be associated with cognitive impairment. However, a limited number of studies have examined the association between the E2 allele and longitudinal changes of cognitive function.
Objective:
To determine whether rates of cognitive change differ in carriers of the APOE E2 allele compared to other genotypes.
Methods:
We conducted a secondary analysis of data from two ongoing longitudinal cohort studies, the Long Life Family Study (LLFS) and New England Centenarian Study (NECS). We included participants who had APOE genotyping data, data from longitudinal administrations of the Telephone Interview for Cognitive Status (TICS), and age, sex and education available. We assessed whether cognitive change as measured by rate of decline in TICS score differed among people with different APOE genotypes. We used a hierarchical mixed effect model with APOE genotypes, their interactions with age, and potential confounders.
Results:
After adjusting for sex and education, in carriers of the common E3/E3 genotype TICS score decreased by 0.15 points per year of age. In those with the E2/E2 genotype, TICS score decreased by 0.05 points per year of age, a significantly slower rate of decline (P=0.017). We observed no protective effect of the E2/E3 genotype on cognitive decline.
Conclusions:
These results suggest a protective effect of the E2/E2 genotype on a measure of global cognitive function.
Keywords: Apolipoproteins E, Cognitive Dysfunction, Genetics, Cognitive Aging
INTRODUCTION
Cognitive decline reduces the independence and quality of life of older individuals. As our population ages, it hinders productivity and adds significant costs to the health care system. Identification of genes associated with cognitive decline may improve screening and early detection, thereby providing the greatest benefit from treatment. Further, identification of protective loci may clarify the biological pathways causing cognitive decline, leading to more effective, personalized treatments [1].
An important genetic marker for cognitive decline is apolipoprotein E (APOE) [2]. The APOE protein is involved in lipid transport and may affect neurodegeneration through mediating amyloid-beta clearance [3]. APOE gene has three alleles, of which the E4 allele is well established as a major risk factor for Alzheimer’s disease [3]. Less is known about E2, which is the rarest allele in whites, but there is evidence that it may have a protective effect against neurodegeneration [4]. APOE E2 is associated with extreme human longevity [5], as well as with decreased risk of Alzheimer’s disease [6, 7]. In the area of cognition, there is evidence that the E2 allele is protective against declines in episodic memory function [8, 9]. However, much remains unknown about the protective effect of APOE E2. For instance, it is unclear how age, modifies the protective effect, as studies on middle-aged adults have frequently not found evidence of improved cognition [10] or differences in brain structure [4] among E2 carriers.
Another important knowledge gap is whether E2 homozygous and E2 heterozygous genotypes are associated with differential effects. There is evidence that this is the case for the E4 allele, with the homozygous genotype being more deleterious, and the heterozygous genotype possibly exerting an age-varying effect [11, 12]. Presumably because of rarity, longitudinal studies have included relatively few E2 carriers [8] and thus often grouped E2 homozygous and heterozygous genotypes for analysis. To address this knowledge gap, we analyzed data from two large longitudinal cohort studies of healthy aging populations with repeated cognitive testing and relatively large numbers of E2 homozygotes. We sought to separately assess whether the E2/E2, E2/E3, and E2/E4 genotypes are associated with differences in rate of cognitive decline.
MATERIALS AND METHODS
Study design and population
We conducted a longitudinal analysis of participants enrolled in two observational cohort studies of familial longevity. The Long Life Family Study (LLFS) is a multisite study of healthy aging and longevity with approximately 4,900 enrolled participants who belong to families with long-lived individuals [13, 14]. The New England Centenarian Study (NECS) is a study of longevity among centenarians and their family members, with approximately 4,000 enrolled participants [15]. For both studies, participants are followed up annually to assess vital and health status, including assessing cognitive function longitudinally. These studies seek to identify factors that contribute to longevity and healthy aging. The analysis presented here was not prespecified.
Genotype data
APOE alleles were defined from the SNPs rs7412 and rs429358 as E2: rs7412=T; rs429358=T, E3: rs7412=C; rs429358=T, E4: rs7412=C; rs429358=C that were directly genotyped in the LLFS participants and in 80% of the NECS participants, and imputed using the Michigan Imputation Server to the HRC panel (Version r1.1 2016) of ~65,000 haplotypes in 20% of NECS participants [5, 16].
Outcome of interest
Our outcome of interest was participants’ score on a modified version of the Telephone Interview for Cognitive Status (TICS) test [17, 18], and we estimated the average annual change in TICS score as a measure of cognitive decline. For NECS, the TICS test is administered every two years. For LLFS, the TICS test is administered every year for participants aged 70 and above, and every three years for participants aged less than 70. For each TICS administration, we calculated a score based on four tasks that cover the domains of episodic memory, working memory, and executive function as in [19]. Tasks included counting backwards, subtracting sevens, and immediate and delayed word list recall resulting in a score that ranged from 0 to 27. We chose these domains because previous studies have suggested that the E2 allele is protective against decline in episodic memory, while evidence for other cognitive domains is weaker [9]. We included in the analysis participants with at least one completed cognitive function assessment, APOE genotyping data, and age, sex and education available. The same version of the TICS was administered in LLFS and NECS using the same protocol.
Statistical analysis
The data from the two studies were aggregated for the main analyses. For descriptive analysis, we calculated the proportion of participants with demographic and medical history characteristics of interest for each genotype. We described age and first TICS score in terms of mean and standard deviation, and number of TICS assessments as median and interquartile range. We tested whether these characteristics differed significantly across genotypes using a chi-squared test for proportions, ANOVA for age at baseline and first TICS score, and Kruskal-Wallis test for number of TICS assessments.
Our initial model to determine whether APOE genotypes modified the association between age and TICS score used a linear mixed effect model to predict TICS score based on age, APOE genotype, and interaction terms between age and APOE genotypes. Statistical significance in the interaction term was interpreted as evidence that genotypes modify the rate of change in TICS score with age. Age was centered at the baseline mean. We chose to use age as a timescale rather than years since enrollment (while adjusting for baseline age) because the range of ages represented by the study participants was far greater than the average length of time over which individuals have TICS measurements. Thus, we assume cross-sectional and longitudinal effects to be similar. We used a random intercept to account for repeated observations of the same individuals, and assessed the need for a random slope for age using a likelihood ratio test. The E3/E3 genotype was the reference group for all analyses. The formula for the initial model is as follows:
Where
TICSij : The jth score for the ith participant
cAgeij : The age, centered at the baseline mean, of the ith participant at the time of his/her jth score
E2E2i, E2E3i, E2E4i, E3E4i, E4E4i : Indicator variables for the APOE genotype of the ith participant
: Random intercept and slope for the ith participant
: Random within-participant error term
and ϵij are assumed to be independent.
We then assessed potential confounders by separately adding to this initial model sex, education, self-reported history of medical conditions known to be associated with cognitive decline (diabetes, heart failure, heart attack, depression or anxiety, stroke, hypertension), history of smoking, and study cohort (LLFS or NECS). We identified covariates that were both significantly associated with TICS score when assessed individually in the context of the initial model, and that, when included changed the estimate for the E2/E2*age interaction term by more than 10%. Our final adjusted model was created by adding to the initial model any covariates that met these two criteria for potential confounders, after first assessing them for statistical interaction with APOE genotype.
Finally, we conducted subgroup analyses because our study population was drawn from two cohort studies with different inclusion criteria, and associations could differ between the two cohorts. The subgroup analyses applied the final adjusted model to participants from each study separately. For all analyses, p<0.05 in a two-sided test was considered statistically significant; all analyses were conducted in SAS v9.4 (SAS Institute, Cary, NC).
RESULTS
We analyzed data from 2,933 people from the LLFS and 679 people from the NECS who had APOE genotyping data, TICS data, and age, sex and education available. Of the combined analytic population, 2,019 (55.9%) were female and 3,575 (99.1%) were non-Hispanic white (Table 1; see supplemental Tables S1 and S2 for participant characteristics from the two study cohorts). The mean age at first TICS administration was 72.1 (standard deviation 13.4) years. Subjects had a median of 3 TICS assessments (interquartile range [IQR] 2, 4) and a median follow-up time of 5.0 years (IQR 2.9, 7.0). The most common genotype in this population was E3/E3, comprising 66.3% of subjects (n=2,394). The two rarest genotypes were E2/E2 (n=23, 0.6%) and E4/E4 (n=30, 0.8%).
Table 1.
Demographic characteristics of study population, by genotype (N = 3,612)
| Characteristics | Total (n=3,612a) | E2/E2 (n = 23, 0.6%) | E2/E3 (n = 540, 15.0%) | E2/E4 (n = 72, 2.0%) | E3/E3 (n = 2,394, 66.3%) | E3/E4 (n = 553, 15.3%) | E4/E4 (n = 30, 0.8%) | P value for comparison across genotypes |
|---|---|---|---|---|---|---|---|---|
| First TICS score (SD) | 14.2 (4.5) | 14.5 (4.1) | 13.8 (4.6) | 14.0 (4.6) | 14.2 (4.5) | 14.5 (4.3) | 14.1 (5.0) | 0.134 |
|
| ||||||||
| Number of TICS assessments, median (IQR) | 3 (2-4) | 3 (2-5) | 3 (2-4) | 3 (2-5) | 3 (2-4) | 3 (2-4) | 3 (2-4) | 0.152 |
|
| ||||||||
| Age at baseline, mean (SD), y | 72.1 (13.4) | 65.4 (13.2) | 73.1 (14.3) | 72.2 (12.9) | 72.5 (13.5) | 70.2 (12.1) | 67.8 (12.6) | <0.001 |
|
| ||||||||
| Female, No. (%) | 2,019 (55.9) | 16 (69.6) | 280 (51.9) | 43 (59.7) | 1,359 (56.8) | 306 (55.3) | 15 (50.0) | 0.222 |
|
| ||||||||
| Education, y | ||||||||
| 0 - 12, No. (%) | 715 (19.8) | 4 (17.4) | 123 (22.8) | 13 (18.1) | 473 (19.8) | 97 (17.5) | 5 (16.7) | 0.380 |
| 13-16, No. (%) | 1,835 (50.8) | 9 (39.1) | 260 (48.2) | 40 (55.6) | 1,213 (50.7) | 300 (54.3) | 13 (43.3) | |
| 17+, No. (%) | 1,062 (29.4) | 10 (43.5) | 157 (29.1) | 19 (26.4) | 708 (29.6) | 156 (28.2) | 12 (40.0) | |
|
| ||||||||
| White, No. (%) | 3,575 (99.1) | 22 (95.7) | 536 (99.4) | 70 (97.2) | 2,370 (99.1) | 547 (99.1) | 30 (100.0) | 0.191 |
|
| ||||||||
| Diabetes, No. (%) | 246 (6.8) | 0 (0.0) | 37 (6.9) | 5 (6.9) | 161 (6.7) | 42 (7.6) | 1 (3.3) | 0.722 |
|
| ||||||||
| Heart Failure, No. (%) | 69 (1.9) | 0 (0.0) | 9 (1.7) | 3 (4.2) | 53 (2.2) | 4 (0.7) | 0 (0.0) | 0.132 |
|
| ||||||||
| Heart Attack, No. (%) | 180 (5.0) | 0 (0.0) | 23 (4.3) | 5 (6.9) | 123 (5.2) | 27 (4.9) | 2 (6.7) | 0.746 |
|
| ||||||||
| Depression or Anxiety, No. (%) | 583 (16.2) | 10 (43.5) | 80 (14.9) | 12 (16.9) | 383 (16.0) | 94 (17.1) | 4 (13.3) | 0.016 |
|
| ||||||||
| Stroke, No. (%) | 75 (2.1) | 0 (0.0) | 15 (2.8) | 2 (2.8) | 48 (2.0) | 8 (1.5) | 2 (6.7) | 0.291 |
|
| ||||||||
| Hypertension, No. (%) | 1,374 (38.2) | 9 (39.1) | 212 (39.4) | 30 (41.7) | 912 (38.2) | 201 (36.6) | 10 (33.3) | 0.896 |
|
| ||||||||
| Ever Smoked, No. (%) | 1,645 (45.7) | 12 (52.2) | 247 (45.9) | 35 (48.6) | 1,080 (45.3) | 261 (47.5) | 10 (33.3) | 0.637 |
Percentages shown in column headers are the percent of the subjects with the indicated genotype.
Participants missing data: Race (n=5), Diabetes (n=10), Heart Failure (n=13), Heart Attack (n=10), Depression or Anxiety (n=12), Stroke (n=13), Hypertension (n=11), Ever Smoked (n=15). Percentages are taken out of those with data.
In all genotype groups, TICS score decreased with age (Figure 1). In the initial model using age, genotype, and an age–genotype interaction term to predict TICS score, the inclusion of a random slope for age did not improve the fit (P=0.061), therefore we included only a random intercept. The E2/E2 genotype was associated with a significantly slower rate of decline with age in TICS score than the E3/E3 genotype (P=0.049), but none of the other genotypes differed significantly from E3/E3 (Table 2). In this model the E3/E3 genotype was associated with an annual change in TICS score of −0.17 (95% confidence interval [CI] −0.18, −0.16) points per year of age (Table 3). In contrast, the E2/E2 genotype was associated with a change in TICS score of −0.08 points per year of age which was not significantly different from 0 (95% CI −0.17, 0.01). The E4/E4 genotype was associated with a change in TICS score of −0.23 (95% −0.32, −0.14) points per year of age, but this was not significantly different from E3/E3 since the interaction between the E4/E4 genotype and age was not significant (P=0.170).
Figure 1.
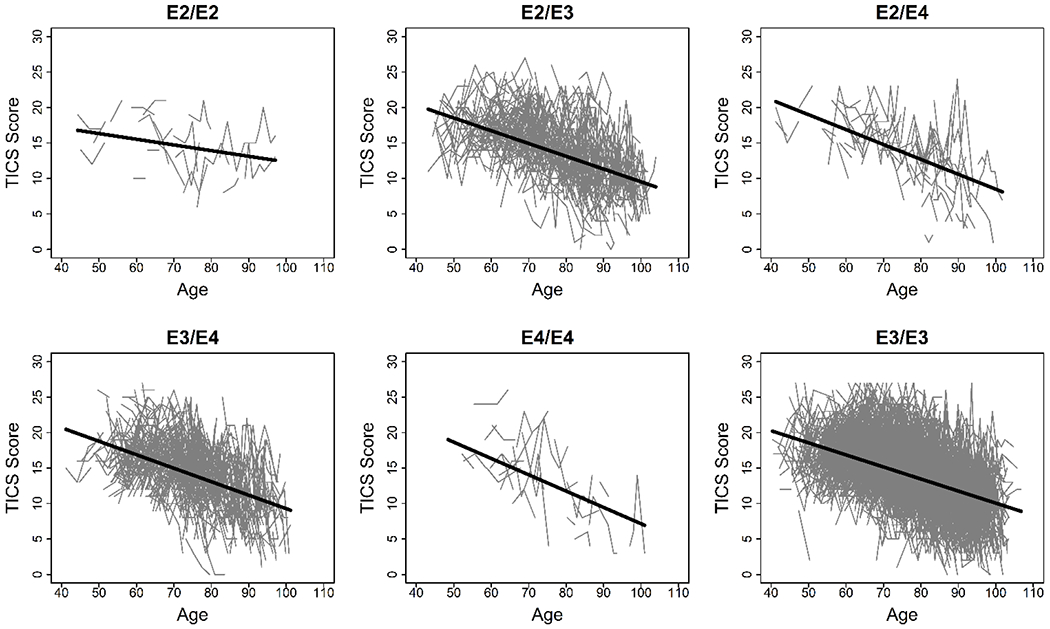
Observed and predicted TICS scores by age and genotype. Connected points represent observed TICS scores for an individual. The solid line shows the predicted TICS score based on a model using age, genotype, and an age–genotype interaction term as predictors.
Table 2.
Initial model for TICS score based on age and genotype
| Effect | Estimate | 95% Confidence Interval | P value |
|---|---|---|---|
| Intercept | 13.97 | (13.84, 14.10) | <0.001 |
| Agea | −0.17 | (−0.18, −0.16) | <0.001 |
| E2/E2*Age | 0.09 | (0.00, 0.18) | 0.049 |
| E2/E3*Age | −0.01 | (−0.03, 0.01) | 0.389 |
| E2/E4*Age | −0.04 | (−0.10, 0.01) | 0.144 |
| E3/E4*Age | −0.02 | (−0.04, 0.00) | 0.097 |
| E4/E4*Age | −0.06 | (−0.15, 0.03) | 0.170 |
| E2/E2 | 0.20 | (−1.31, 1.70) | 0.797 |
| E2/E3 | −0.30 | (−0.60, 0.01) | 0.058 |
| E2/E4 | −0.66 | (−1.43, 0.11) | 0.094 |
| E3/E4 | −0.32 | (−0.63, 0.00) | 0.047 |
| E4/E4 | −1.53 | (−2.83, −0.24) | 0.020 |
| E3/E3 | Ref |
Age was centered at the baseline mean of 72
Table 3.
Estimated change in TICS score per year of age, by genotype, based on initial and final adjusted models
| Initial model |
Final adjusted modela |
|||
|---|---|---|---|---|
| Genotype | Estimate | 95% Confidence Interval | Estimate | 95% Confidence Interval |
| E2/E2 | −0.08 | (−0.17, 0.01) | −0.05 | (−0.14, 0.04) |
| E2/E3 | −0.18 | (−0.20, −0.16) | −0.16 | (−0.18, −0.14) |
| E2/E4 | −0.21 | (−0.27, −0.16) | −0.20 | (−0.25, −0.14) |
| E3/E3 | −0.17 | (−0.18, −0.16) | −0.15 | (−0.16, −0.15) |
| E3/E4 | −0.19 | (−0.21, −0.17) | −0.17 | (−0.19, −0.15) |
| E4/E4 | −0.23 | (−0.32, −0.14) | −0.20 | (−0.29, −0.12) |
In our assessment of potential confounders, sex, education, diabetes, heart failure, heart attack, and stroke were significantly associated with TICS score when separately added to the individual model (Table 4). However, of these, only sex and education also changed the estimate for the E2/E2*age interaction term by more than 10% (Table 5). No significant statistical interaction was detected between genotype and either sex or education. When we assessed interaction terms between each potential covariate and age, none changed the E2/E2*age interaction estimate by more than 10%.
Table 4.
Bivariate associations between potential confounders and TICS score when added to initial model containing age and genotype
| Characteristic | Estimate | 95% Confidence Interval | P value |
|---|---|---|---|
| Female | 1.17 | (0.96, 1.38) | <0.001 |
| Education | |||
| 17+ | 2.19 | (1.88, 2.50) | <0.001 |
| 13-16 | 1.47 | (1.19, 1.76) | |
| 0 - 12 | Ref | ||
| Diabetes | −0.52 | (−0.94, −0.10) | 0.016 |
| Heart Failure | −1.05 | (−1.86, −0.25) | 0.010 |
| Heart Attack | −1.00 | (−1.50, −0.51) | <0.001 |
| Depression or Anxiety | −0.27 | (−0.56, 0.03) | 0.078 |
| Stroke | −1.47 | (−2.24, −0.70) | <0.001 |
| Hypertension | −0.22 | (−0.45, 0.00) | 0.052 |
| Ever Smoked | −0.12 | (−0.33, 0.10) | 0.291 |
| Study cohort (NECS) | 0.08 | (−0.19, 0.35) | 0.543 |
Race was not assessed because of lack of non-white patients
Table 5.
Final adjusted models for TICS score based on age and genotype, adjusted for sex and education
| Effect | Estimate | 95% Confidence Interval | P value |
|---|---|---|---|
| Intercept | 11.69 | (11.41, 11.98) | <0.001 |
| Agea | −0.15 | (−0.16, −0.15) | <0.001 |
| E2/E2*Age | 0.11 | (0.02, 0.19) | 0.017 |
| E2/E3*Age | −0.01 | (−0.03, 0.01) | 0.444 |
| E2/E4*Age | −0.04 | (−0.10, 0.01) | 0.115 |
| E3/E4*Age | −0.02 | (−0.04, 0.00) | 0.081 |
| E4/E4*Age | −0.05 | (−0.14, 0.04) | 0.252 |
| E2/E2 | 0.11 | (−1.32, 1.55) | 0.877 |
| E2/E3 | −0.18 | (−0.47, 0.11) | 0.230 |
| E2/E4 | −0.68 | (−1.42, 0.05) | 0.069 |
| E3/E4 | −0.29 | (−0.59, 0.01) | 0.062 |
| E4/E4 | −1.45 | (−2.70, −0.21) | 0.022 |
| E3/E3 | Ref | ||
| Female | 1.37 | (1.17, 1.58) | <0.001 |
| Education: 17+ years | 2.44 | (2.13, 2.75) | <0.001 |
| Education: 13-16 years | 1.59 | (1.31, 1.87) | <0.001 |
| Education: 0-12 years | Ref |
Age was centered at the baseline mean of 72
In the final adjusted model, E2/E2 was again the only genotype associated with a difference in rate of TICS score decline with age compared to E3/E3 (P=0.017, Table 5). In this model, the E3/E3 genotype was associated with an annual change in TICS score of −0.15 (95% confidence interval [CI] −0.16, −0.15) points per year of age (Table 3). The E2/E2 genotype was associated with a change in TICS score of −0.05 that was not significantly different from 0 (95% CI −0.14, 0.04). The E4/E4 genotype was associated with a change in TICS score of −0.20 (95% −0.29, −0.12) points per year of age, but this was not significantly different from E3/E3 (P=0.252).In subgroup analyses, the magnitude of the interaction term between E2/E2 and age was comparable in the LLFS and NECS study cohorts, although the interaction did not achieve statistical significance in the NECS cohort (Table S3).
DISCUSSION
We analyzed the association between APOE genotypes and rate of decline of TICS scores with age in a large set of older individuals enrolled in two longitudinal studies of healthy aging and longevity. The analysis showed that TICS score was positively correlated with education and female sex and, in carriers of the common E3/E3 genotype, TICS score was estimated to decrease on average by 0.15 points per year of age, which represents a change of 0.5% of the maximum score. The E2/E2 genotype was associated with a significantly slower rate of TICS decline with age while, in contrast, we observed no protective effect of the E2/E3 genotype that had previously been found to be associated with decreased risk of Alzheimer’s disease [2, 6]. Moreover, our analysis confirmed a significant negative effect of the E3/E4 and E4/E4 genotypes on TICS score, but no significantly increased rate of decline. Taken together, these results are consistent with a protective effect of the E2/E2 genotype on episodic memory, working memory, and executive function domains of cognitive function.
Our findings add to the growing evidence for a protective effect of the E2 allele, while potentially adding information to distinguish homozygous from heterozygous effects. Previous longitudinal studies of cognitive decline have shown that people with either the E2/E2 or E2/E3 genotype experience less decline in tests of episodic memory over time than people with E3 and E4 alleles [9, 20–22]. However, these studies grouped the E2/E2 homozygous and E2/E3 “carrier” genotypes, and excluded the E2/E4 genotype from analysis. Our study separately assessed all the possible genotypes and found that only the E2/E2 homozygous genotype was associated with slower decline with age of TICS scores. Despite having over 400 people with the E2/E3 genotype in our analysis, we found no evidence for a protective effect of this genotype, as our model predicted indistinguishable rates of cognitive decline for the E2/E3 and E3/E3 genotypes. While previous studies have found that the E2/E3 is protective against Alzheimer’s disease [6], it is possible that the outcome of TICS score decline measures cognitive processes whose mechanistic relationship with APOE is distinct from that by which APOE mediates Alzheimer’s disease. Our analysis suggests that molecular mechanisms that are associated with homozygosity of the E2 allele may provide better targets for the discovery of therapeutics that can preserve cognitive functions. We recently discovered a serum protein signature that is associated with APOE genotypes and indeed showed that the distribution of some of these proteins such as APOB and BIRC2 is drastically different in carriers of the E2/E2 genotype [23]. It is notable that we did not see any association between the E4 allele and rate of cognitive decline with age. In previous longitudinal studies, the E4/E4 genotype has been found to be associated with faster cognitive decline by various measures [8, 24], including as measured by TICS [25]. While the estimated rate of cognitive decline in our study was faster for the E4/E4 genotype in our study population, it is possible that the small number of people with this genotype (n=30) may have prevented us from detecting a statistically significant association. Our analysis confirmed a significant effect of sex on TICS, with females on average scoring 1.37 points higher than males. The sex difference did not change with age, or APOE genotype. A strength of our analysis is that we had repeated assessments of TICS over time, thus making the results more robust. Our study has also limitations related to the population of the LLFS and NECS studies. First, the populations of participants enrolled in the LLFS and NECS studies differ from the general population in ways that could affect the association between genetics and cognition. In particular, both participant populations were selected because they are likely to have genetic factors promoting longevity, and both cohorts have high levels of education compared to the national age cohort [13]. Given that some of the genetic factors associated with longevity may also protect against cognitive decline, and that education is known to have a protective association with delayed onset of cognitive decline [26, 27], the results should be replicated in less selected populations. Moreover, the numbers of participants with the E2/E2, E2/E4, and E4/E4 genotypes were relatively small, and some of these groups differed in key demographic characteristics from the study population as a whole. We attempted to control for these differences by adjusting for age, sex, and education, and we assessed various comorbidities as well as study cohort as potential confounders. However, we lacked information about other factors that have been shown to be associated with cognitive decline, such as exercise and social engagement [28].
Our study also has limitations related to our ability to assess cognitive decline. While changes in TICS score have been used as a measure of cognitive decline by other studies [28], TICS is known to have reduced sensitivity for detecting mild cognitive impairment as opposed to dementia [29]. Because the length of follow-up time for individual participants was limited, we may have had insufficient outcome data to accurately detect cognitive decline in many cases. Moreover, because we used age rather than time since enrollment as a timescale, we were unable to distinguish individual-level effects (i.e. longitudinal associations with the TICS scores of individual participants) from age cohort effects (i.e. associations with population-level differences in TICS scores among participants of different ages) in our analysis.
In conclusion, our analysis confirms the protective effect of the E2 allele of APOE on cognitive decline and the deleterious effect of the E4 allele of APOE on level of cognitive function. The contribution of our work is in the detection of a protective effect of the homozygous genotype E2/E2 that could be helpful to target more specific molecular biomarkers of cognitive function and to develop therapeutic interventions.
Supplementary Material
ACKNOWLEDGEMENTS
This work is submitted on behalf of the Long Life Family Study. This work was supported by the NIH: T32 GM74905 to BS; K01 AG057798 to SA; R01 AG061844 to PS, TP; U19 AG063893 to PS, TP, NS, SC; and the Boston University Digital Health Initiative Research Incubation Award to PS, TP, SA.
Footnotes
CONFLICT OF INTEREST/DISCLOSURE STATEMENT: The authors have no conflict of interest to report.
REFERENCES
- [1].Floris M, Olla S, Schlessinger D, Cucca F (2018) Genetic-Driven Druggable Target Identification and Validation. Trends Genet 34, 558–570. [DOI] [PMC free article] [PubMed] [Google Scholar]
- [2].Belloy ME, Napolioni V, Greicius MD (2019) A Quarter Century of APOE and Alzheimer’s Disease: Progress to Date and the Path Forward. Neuron 101, 820–838. [DOI] [PMC free article] [PubMed] [Google Scholar]
- [3].Yamazaki Y, Zhao N, Caulfield TR, Liu C-C, Bu G (2019) Apolipoprotein E and Alzheimer disease: pathobiology and targeting strategies. Nature Reviews Neurology 15, 501–518. [DOI] [PMC free article] [PubMed] [Google Scholar]
- [4].Suri S, Heise V, Trachtenberg AJ, Mackay CE (2013) The forgotten APOE allele: A review of the evidence and suggested mechanisms for the protective effect of APOE ɛ2. Neuroscience & Biobehavioral Reviews 37, 2878–2886. [DOI] [PubMed] [Google Scholar]
- [5].Sebastiani P, Gurinovich A, Nygaard M, Sasaki T, Sweigart B, Bae H, Andersen SL, Villa F, Atzmon G, Christensen K, Arai Y, Barzilai N, Puca A, Christiansen L, Hirose N, Perls TT (2019) APOE Alleles and Extreme Human Longevity. J Gerontol A Biol Sci Med Sci 74, 44–51. [DOI] [PMC free article] [PubMed] [Google Scholar]
- [6].Farrer LA, Cupples LA, Haines JL, Hyman B, Kukull WA, Mayeux R, Myers RH, Pericak-Vance MA, Risch N, van Duijn CM (1997) Effects of age, sex, and ethnicity on the association between apolipoprotein E genotype and Alzheimer disease. A meta-analysis. APOE and Alzheimer Disease Meta Analysis Consortium. Jama 278, 1349–1356. [PubMed] [Google Scholar]
- [7].Reiman EM, Arboleda-Velasquez JF, Quiroz YT, Huentelman MJ, Beach TG, Caselli RJ, Chen Y, Su Y, Myers AJ, Hardy J, Paul Vonsattel J, Younkin SG, Bennett DA, De Jager PL, Larson EB, Crane PK, Keene CD, Kamboh MI, Kofler JK, Duque L, Gilbert JR, Gwirtsman HE, Buxbaum JD, Dickson DW, Frosch MP, Ghetti BF, Lunetta KL, Wang LS, Hyman BT, Kukull WA, Foroud T, Haines JL, Mayeux RP, Pericak-Vance MA, Schneider JA, Trojanowski JQ, Farrer LA, Schellenberg GD, Beecham GW, Montine TJ, Jun GR, Alzheimer’s Disease Genetics C (2020) Exceptionally low likelihood of Alzheimer’s dementia in APOE2 homozygotes from a 5,000-person neuropathological study. Nat Commun 11, 667. [DOI] [PMC free article] [PubMed] [Google Scholar]
- [8].O’Donoghue MC, Murphy SE, Zamboni G, Nobre AC, Mackay CE (2018) APOE genotype and cognition in healthy individuals at risk of Alzheimer’s disease: A review. Cortex 104, 103–123. [DOI] [PubMed] [Google Scholar]
- [9].Wilson RS, Bienias JL, Berry-Kravis E, Evans DA, Bennett DA (2002) The apolipoprotein E epsilon 2 allele and decline in episodic memory. J Neurol Neurosurg Psychiatry 73, 672–677. [DOI] [PMC free article] [PubMed] [Google Scholar]
- [10].Li Z, Shue F, Zhao N, Shinohara M, Bu G (2020) APOE2: protective mechanism and therapeutic implications for Alzheimer’s disease. Mol Neurodegener 15, 63. [DOI] [PMC free article] [PubMed] [Google Scholar]
- [11].Caselli RJ, Dueck AC, Osborne D, Sabbagh MN, Connor DJ, Ahern GL, Baxter LC, Rapcsak SZ, Shi J, Woodruff BK, Locke DE, Snyder CH, Alexander GE, Rademakers R, Reiman EM (2009) Longitudinal modeling of age-related memory decline and the APOE epsilon4 effect. N Engl J Med 361, 255–263. [DOI] [PMC free article] [PubMed] [Google Scholar]
- [12].Gharbi-Meliani A, Dugravot A, Sabia S, Regy M, Fayosse A, Schnitzler A, Kivimaki M, Singh-Manoux A, Dumurgier J (2021) The association of APOE epsilon4 with cognitive function over the adult life course and incidence of dementia: 20 years follow-up of the Whitehall II study. Alzheimers Res Ther 13, 5. [DOI] [PMC free article] [PubMed] [Google Scholar]
- [13].Newman AB, Glynn NW, Taylor CA, Sebastiani P, Perls TT, Mayeux R, Christensen K, Zmuda JM, Barral S, Lee JH, Simonsick EM, Walston JD, Yashin AI, Hadley E (2011) Health and function of participants in the Long Life Family Study: a comparison with other cohorts. Aging (Albany NY) 3, 63–76. [DOI] [PMC free article] [PubMed] [Google Scholar]
- [14].Sebastiani P, Hadley EC, Province M, Christensen K, Rossi W, Perls TT, Ash AS (2009) A family longevity selection score: ranking sibships by their longevity, size, and availability for study. Am J Epidemiol 170, 1555–1562. [DOI] [PMC free article] [PubMed] [Google Scholar]
- [15].Sebastiani P, Perls TT (2012) The genetics of extreme longevity: lessons from the New England Centenarian Study. Front Genet 3, 277. [DOI] [PMC free article] [PubMed] [Google Scholar]
- [16].Das S, Forer L, Schonherr S, Sidore C, Locke AE, Kwong A, Vrieze SI, Chew EY, Levy S, McGue M, Schlessinger D, Stambolian D, Loh PR, Iacono WG, Swaroop A, Scott LJ, Cucca F, Kronenberg F, Boehnke M, Abecasis GR, Fuchsberger C (2016) Next-generation genotype imputation service and methods. Nat Genet 48, 1284–1287. [DOI] [PMC free article] [PubMed] [Google Scholar]
- [17].Brandt J, Spencer M, & Folstein M (1988) The telephone interview for cognitive status. [Google Scholar]
- [18].Welsh KA, Breitner JCS, Magruderhabib KM (1993) Detection of Dementia in the Elderly Using Telephone Screening of Cognitive Status. Neuropsychiatry Neuropsychology and Behavioral Neurology 6, 103–110. [Google Scholar]
- [19].Andersen SL, Sweigart B, Sebastiani P, Drury J, Sidlowski S, Perls TT (2018) Reduced Prevalence and Incidence of Cognitive Impairment Among Centenarian Offspring. J Gerontol A Biol Sci Med Sci. [DOI] [PMC free article] [PubMed] [Google Scholar]
- [20].Helkala EL, Koivisto K, Hanninen T, Vanhanen M, Kervinen K, Kuusisto J, Mykkanen L, Kesaniemi YA, Laakso M, Riekkinen P Sr. (1996) Memory functions in human subjects with different apolipoprotein E phenotypes during a 3-year population-based follow-up study. Neurosci Lett 204, 177–180. [DOI] [PubMed] [Google Scholar]
- [21].McFall GP, Wiebe SA, Vergote D, Westaway D, Jhamandas J, Backman L, Dixon RA (2015) ApoE and pulse pressure interactively influence level and change in the aging of episodic memory: Protective effects among epsilon2 carriers. Neuropsychology 29, 388–401. [DOI] [PMC free article] [PubMed] [Google Scholar]
- [22].Kim YJ, Seo SW, Park SB, Yang JJ, Lee JS, Lee J, Jang YK, Kim ST, Lee KH, Lee JM, Lee JH, Kim JS, Na DL, Kim HJ (2017) Protective effects of APOE e2 against disease progression in subcortical vascular mild cognitive impairment patients: A three-year longitudinal study. Sci Rep 7, 1910. [DOI] [PMC free article] [PubMed] [Google Scholar]
- [23].Sebastiani P, Monti S, Morris M, Gurinovich A, Toshiko T, Andersen SL, Sweigart B, Ferrucci L, Jennings LL, Glass DJ, Perls TT (2019) A serum protein signature of APOE genotypes in centenarians. Aging Cell, e13023. [DOI] [PMC free article] [PubMed] [Google Scholar]
- [24].Small BJ, Rosnick CB, Fratiglioni L, Backman L (2004) Apolipoprotein E and cognitive performance: a meta-analysis. Psychol Aging 19, 592–600. [DOI] [PubMed] [Google Scholar]
- [25].Hayden KM, Lutz MW, Kuchibhatla M, Germain C, Plassman BL (2015) Effect of APOE and CD33 on Cognitive Decline. PLoS One 10, e0130419. [DOI] [PMC free article] [PubMed] [Google Scholar]
- [26].Clouston SAP, Smith DM, Mukherjee S, Zhang Y, Hou W, Link BG, Richards M (2019) Education and Cognitive Decline: An Integrative Analysis of Global Longitudinal Studies of Cognitive Aging. The Journals of Gerontology: Series B. [DOI] [PMC free article] [PubMed] [Google Scholar]
- [27].Wilson RS, Hebert LE, Scherr PA, Barnes LL, Mendes de Leon CF, Evans DA (2009) Educational attainment and cognitive decline in old age. Neurology 72, 460–465. [DOI] [PMC free article] [PubMed] [Google Scholar]
- [28].Wu Z, Phyo AZZ, Al-Harbi T, Woods RL, Ryan J (2020) Distinct Cognitive Trajectories in Late Life and Associated Predictors and Outcomes: A Systematic Review. J Alzheimers Dis Rep 4, 459–478. [DOI] [PMC free article] [PubMed] [Google Scholar]
- [29].Elliott E, Green C, Llewellyn DJ, Quinn TJ (2020) Accuracy of Telephone-Based Cognitive Screening Tests: Systematic Review and Meta-Analysis. Curr Alzheimer Res 17, 460–471. [DOI] [PubMed] [Google Scholar]
Associated Data
This section collects any data citations, data availability statements, or supplementary materials included in this article.