Abstract
Studies on intracranial electroencephalography (icEEG) recordings of patients with drug resistant epilepsy (DRE) show that epilepsy biomarkers propagate in time across brain areas. Here, we propose a novel method that estimates critical features of these propagations for different epilepsy biomarkers (spikes, ripples, and fast ripples), and assess their common onset as a reliable biomarker of the epileptogenic zone (EZ). For each biomarker, an automatic algorithm ranked the icEEG electrodes according to their timing occurrence in propagations and finally dichotomized them as onset or spread. We validated our algorithm on icEEG recordings of 8 children with DRE having a good surgical outcome (Engel score = 1). We estimated the overlap of the onset, spread, and entire zone of propagation with the resection (RZ) and the seizure onset zone (SOZ). Spike and ripple propagations were seen in all patients, whereas fast ripple propagations were seen in 6 patients. Spike, ripple, and fast ripple propagations had a mean duration of 28.3 ± 24.3 ms, 38.7 ± 37 ms, and 25 ± 14 ms respectively. Onset electrodes predicted the RZ and SOZ with higher specificity compared to the entire zone for all three biomarkers (p<0.05). Overlap of spike and ripple onsets presented a higher specificity than each separate biomarker onset: for the SOZ, the onsets overlap was more specific (97.89 ± 2.36) than the ripple onset (p=0.031); for the RZ, the onsets overlap was more specific (98.48 ± 1.5) than the spike onset (p=0.016). Yet, the entire zone for spike and ripple propagations predicted the RZ with higher sensitivity compared to each biomarker’s onset (or spread) (p<0.05). We present, for the first time, preliminary evidence from icEEG data that fast ripples propagate in time across large areas of the brain. The onsets overlap of spike and ripple propagations constitutes an extremely specific (but not sensitive) biomarker of the EZ, compared to areas of spread (and entire areas) in propagation.
Clinical Relevance
Our novel method can identify propagation events of epilepsy biomarkers, quantify their features, and delineate their overlapping onset, which constitutes an extremely specific biomarker of the EZ and may benefit children with DRE undergoing epilepsy neurosurgery.
I. INTRODUCTION
Epilepsy is a common neurological condition characterized by hypersynchronous electrical discharges in the human brain, which causes seizures in both children and adults. Up to one-third of children with epilepsy are medically intractable and may need neurosurgery to become seizure free and avoid a life of disability. The epilepsy surgery aims to delineate and resect the epileptogenic zone (EZ), the brain area that is indispensable for the generation of seizures [1]. The precise definition of the EZ is a crucial step in the presurgical evaluation of patients with epilepsy. However, due to lack of methods and tools which can assess the EZ in a direct way, the delineation of the EZ is performed indirectly through multiple presurgical tests. Yet, the results of these tests are often insufficiently concordant or inconclusive [2].
Several epilepsy biomarkers, such as interictal spikes and high frequency oscillations (HFOs), have been proposed to delineate the EZ [3]-[5]. Spikes are sensitive but not specific biomarkers of the EZ since they can also occur in eloquent areas, which should not be resected during surgery. HFOs, which are regarded as promising epilepsy biomarkers, are classified into ripples (80-250 Hz) and fast ripples (250-500 Hz). Fast ripples are more focal and closely linked to the EZ but are highly restricted both spatially and temporally and thus may not be sampled with conventional intracranial EEG (icEEG) macroelectrodes. Moreover, they do not occur in all patients. On the other hand, ripples can be observed with macroelectrodes in most patients with higher rate than fast ripples, but they can be seen also in physiological areas of the brain which are not needed to be resected. Thus, there is an urgent need for a reliable biomarker of epilepsy that can delineate the EZ with high precision. Previous intracranial EEG (icEEG) studies have shown that interictal spikes and ripples propagate in time in epilepsy patients across large areas of the brain [3], [6]. The onset of this propagating activity has been regarded as a more reliable biomarker of the EZ than the areas of spread and thus constitutes a promising biomarker of epilepsy, which is potentially more robust than existing biomarkers. However, the literature in this field is sparse and only propagation of spikes and ripples have been examined.
Here, we develop a novel algorithm that (i) detects these propagation events for spikes, ripples, and fast ripples in icEEG recordings, (ii) ranks the involved active electrodes based on their temporal participation in the propagation event, (iii) identifies the active electrodes involved in the onset and spread, and (iv) maps the electrodes where the onset overlaps across the three different biomarkers. We validated the performance of this algorithm by estimating the overlap of the onset, spread, and entire propagation zone for each biomarker with the resection and the clinically defined seizure onset zone (SOZ) for patients with good outcome (Engel score = 1). We also estimated the overlap of common electrodes in the onsets of spike and ripple propagations with the SOZ and resection.
II. Methodology
C. Patients’ cohort
We analyzed icEEG data from 8 patients with DRE who had a resective surgery at the Epilepsy Center of Boston Children’s Hospital (BCH) between July 2012 and May 2016. The patients were selected according to the following inclusion criteria: (i) good surgical outcome at least one year after resection (Engel score = 1); (ii) long term monitoring using electrocorticography (ECoG) and/or stereotactic electroencephalography (sEEG); (iii) availability of high resolution pre-surgical MRI and post-implantation computerized tomography (CT); (iv) precise information on resected zone and SOZ. Patients’ demographics are presented in Table 1. Institutional Review Board of BCH approved this study (IRB117 P00022114), without requiring informed consents from the patients due to the study’s retrospective nature.
Table 1.
Demographics
| # | Age [y] |
Sex | # SP |
# RP |
# FP |
Electrode type (# Number) |
|---|---|---|---|---|---|---|
| 1 | 10 | M | 241 | 125 | 81 | ECoG (80) |
| 2 | 7 | F | 94 | 6 | 0 | sEEG (90) |
| 3 | 8 | F | 208 | 89 | 89 | ECoG+sEEG (80+20) |
| 4 | 14 | F | 149 | 46 | 0 | ECoG (72) |
| 5 | 3 | M | 212 | 8 | 10 | ECoG (96) |
| 6 | 17 | M | 148 | 22 | 9 | ECoG+sEEG (64+30) |
| 7 | 4 | M | 303 | 299 | 37 | ECoG+sEEG (128+10) |
| 8 | 6 | F | 463 | 313 | 136 | sEEG (198) |
SP: Spike Propagations; RP: Ripple Propagations, FP: Fast ripple Propagations
D. Data acquisition and long-term monitoring
The pre-surgical evaluation of patients was performed by a multidisciplinary team of clinicians to decide about the type, number, and location of electrodes to be implanted for each patient. Subsequently, the long-term monitoring of patients was performed for several days using ECoG electrodes (Ad Tech., USA, with an exposure diameter of 2.3 mm and interdistance of 3-5 mm) and/or sEEG electrodes (Ad Tech., USA, with a diameter of 1.1 mm and interdistance of 3-5mm). The data was recorded using XLTEK NeuroWorks (Natus Inc., USA) with a sampling frequency of 2 kHz.
E. Detection of spikes, ripples, and fast ripples
We selected 5 minutes of interictal icEEG data with evident spike activity for each patient. We initially pre-processed the data by removing the DC offset and applying a notch filter for removing the powerline interference (i.e., 60 Hz and harmonics). The signals were then bandpass filtered into three different frequency bands ranging from 1-70 Hz, 80-250 Hz, and 250-500 Hz for the detection of spikes, ripples, and fast ripples, respectively. Spikes were detected and marked visually by an experienced reader (C.P.) using Brainstorm [7]. Ripples and fast-ripples were initially detected automatically using RippleLab [8] and their time-frequency analysis planes were then estimated. Each ripple or fast ripple was then visually inspected to ensure that it does not represent a false positive HFO. A ripple or fast ripple was regarded as true if showing an isolated peak (“island”) in the time-frequency plane [3]. The start time and duration of ripples and fast ripples were also estimated with RippleLab.
F. Detection of propagation events
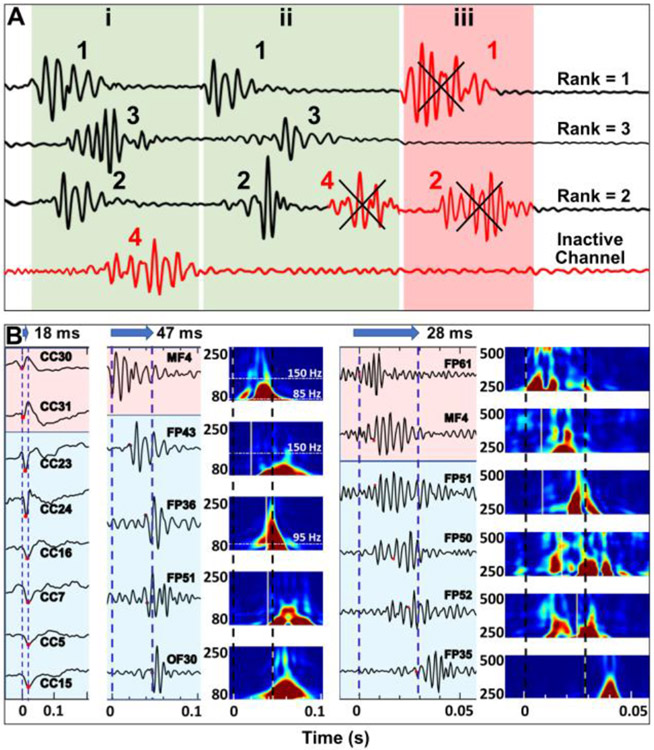
Channels containing <20% of the total number of events were initially regarded as inactive and were excluded from further analysis. Next, using the start times of spikes, ripples, and fast ripples, we identified temporal propagations across the icEEG electrodes for each of these biomarkers using an in-house algorithm developed in MATLAB. A propagation group includes individual events of the same type (e.g., spikes) happening through several channels. For a propagation not to be considered as an outlier, it should include a minimum of three channels and less than 75% of the total channels. Fig. 1A shows different propagation scenarios. The time interval between each event in a propagation group was set to 10 ms. Finally, all the events in active channels were assigned a rank, according to their appearance in propagations and the final rank of each channel was calculated as the median of the ranks of events in that channel. Using the median of ranks was preferred over the average since median accounts for eliminating possible outlier events with relatively high or low ranks that can artificially increase or decrease the final rank of a channel. Fig. 1B shows examples of spikes (left), ripples (middle), and fast ripples (right) propagations.
Fig. 1. Automated detection of propagation events for interictal spikes, ripples, and fast ripples.
(A) Different scenarios in propagation detection. Bottom channel (red) is considered as inactive and excluded from further analysis because it does not participate in several events. Propagation (i) includes three individual events in three channels, each of which is ranked according to their temporal appearance in propagation. Propagation (ii) consists of four events; event #4 is excluded from this propagation since each channel can have one event in propagation. Propagation in scenario (iii) is considered as an outlier since it does not include enough events and thus is discarded. (B) Propagation of spikes (left), ripples (middle), and fast ripples (right) across time (from 0 to 0.2 s for spikes, from 0 to 0.1 s for ripples, from 0 to 0.05 s for fast ripples). Durations of propagation for spikes, ripples, and fast ripples for this event were 18, 47, and 28 ms, respectively. Amplitudes of each channel are normalized for visualization. Time frequency analysis planes are also shown for ripples (80-250 Hz) and fast ripples (250-500 Hz).
G. Overlapping with SOZ and resection
To assess the performance of each biomarker to identify the EZ, we compared the onset electrodes (for each biomarker and overlaps) with the resection and the clinically defined SOZ to calculate their respective sensitivity and specificity. For spikes, ripples, and fast ripples propagations, the first 20% of rank-sorted electrodes were considered as onset zone, and the rest as spread zone. We thus defined: (i) true positives (TP) as onset electrodes located inside the SOZ (or resection) or within the vicinity of an electrode in the SOZ (at a distance of 10 mm for ECoG electrodes and 5 mm for sEEG electrodes); (ii) false positives (FP) as onset electrodes that were not located inside the SOZ (or resection); (iii) true negatives (TN) as spread electrodes that were not located inside the SOZ (or resection); (iv) false negatives (FN) as spread electrodes that were located inside the SOZ (or resection). A similar approach was used to estimate the performance of spread electrodes and the entire zone (all the active electrodes containing a specific biomarker) of each biomarker in predicting the SOZ and resection.
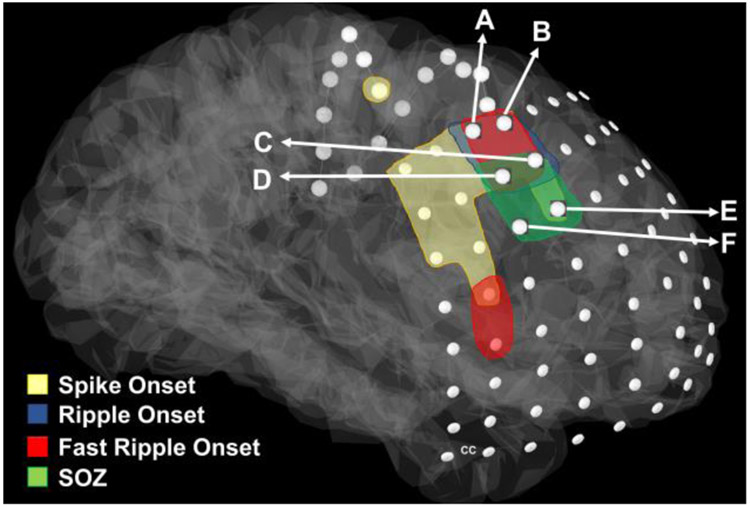
Fig. 2 shows a schematic representation of overlapping onsets with respect to the SOZ for patient #1. Electrodes C, D, E, and F are inside the SOZ (green). Two of the onset electrodes (C and D) are also inside the SOZ, and thus counted as TP while the remaining two electrodes inside the SOZ (E and F) are not among onset electrodes and thus counted as FN. Electrodes A and B are not inside the SOZ and thus fall into the FP category. The rest of the electrodes for this patient are correctly predicted as being outside the SOZ and thus counted as TN.
Fig. 2: Schematic representation of spike, ripple, and fast ripple onset.
The overlap of common electrodes with the SOZ for patient #1. Electrodes A, B, C, D are the overlapping onset electrodes and electrodes C, D, E, F are in the SOZ (green). Two of the onset electrodes (C and D) are also in the SOZ.
H. Statistical methods
We performed the Wilcoxon signed-rank test in MATLAB for comparing sensitivities and specificities among onset, spread and entire propagation zones for all biomarkers. We considered p < 0.05 as statistically significant threshold.
III. Results
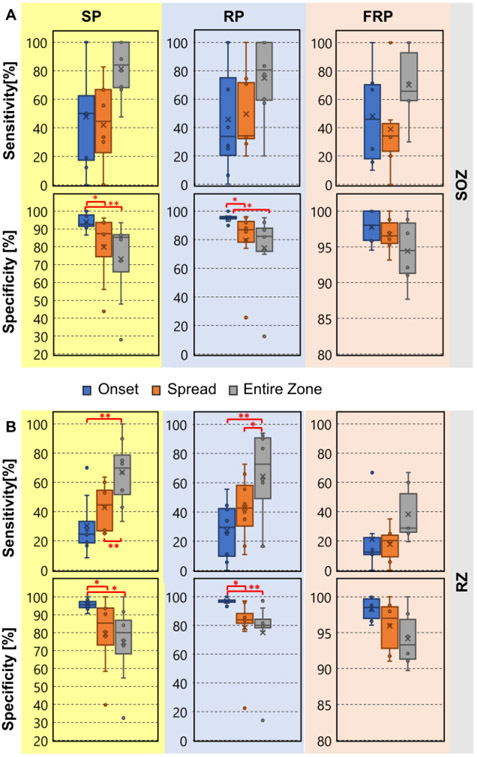
Interictal spike, ripple, and fast ripple propagations had a mean (± S.D.) duration of 28.3 ± 24.3 ms, 38.7 ± 37 ms, and 25 ± 14 ms, respectively. Fig. 3 shows comparisons between the sensitivity and specificity values of the different biomarkers in predicting the SOZ and the resection. Onset-zone of spikes and ripples (but not fast ripples) presented a higher specificity (compared to the spread-zone and the entire-zone) for identifying the SOZ and resection. For identifying the SOZ, spike onset was highly specific compared to the spike spread and the entire zone (p = 0.04 and p < 0.01 respectively). Also, the ripple onset was more specific than the ripple spread and the entire zone (p = 0.02 and p < 0.01 respectively). Regarding identifying the resection, the spike onset was more specific compared to the spike spread and the entire zone (p < 0.05 and p = 0.02, respectively). Ripple onset was highly specific compared to the ripple spread and the entire zone (p = 0.02 and p < 0.01 respectively). Comparisons for fast ripples did not reach statistical significance. The entire zones of spike propagations predicted the resection with higher sensitivity compared to the onset or spread (p < 0.01). Similarly, the entire zone of ripple propagations predicted the resection with higher sensitivity compared to the onset or spread zones (p < 0.01 for both cases). SOZ refers to the brain region where clinical seizures are initiated; RZ is the brain area which is finally resected during surgery. The SOZ is often larger than the RZ since it may overlap with eloquent areas (such as the primary motor cortex and language areas) that should not be resected during surgery.
Fig. 3: Specificity and Sensitivity for identifying the SOZ and resection for Spike Propagations (SP), Ripple Propagations (RP), and Fast Ripple Propagations (FRP).
(A) Sensitivity and specificity of onset, spread, and entire zone propagation in predicting the clinically defined SOZ. (B) Sensitivity and specificity of onset, spread, and entire zone propagation in predicting the resection (RZ). (*) indicates p < 0.05; (**) indicates p < 0.01.
G. Common onset of spike and ripple propagations
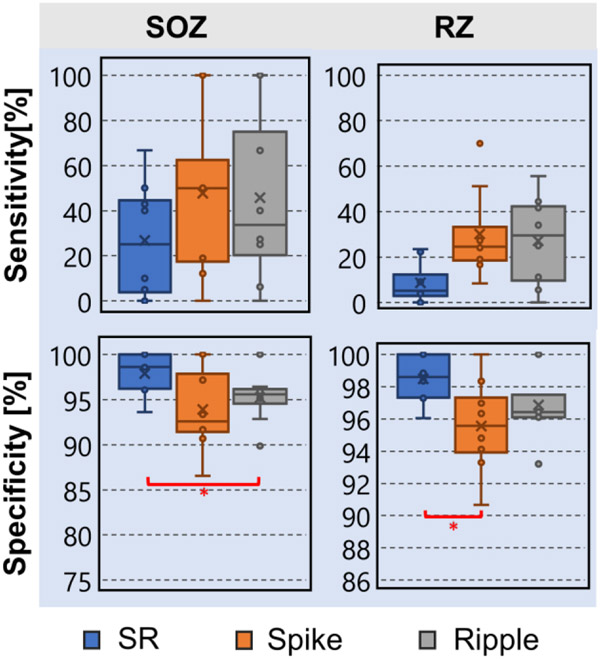
Fig. 4 presents the sensitivity and specificity values of the common onset of spike and ripple propagations for predicting the SOZ and resection. We observed that common onset electrodes were more specific than the ripple onset electrodes (p = 0.016) for predicting the SOZ. We also observed that the common onset electrodes were more specific than the spike onset electrodes for predicting resection (p = 0.031). Comparisons between the other combinations of biomarkers and individual biomarkers did not reach statistical significance.
Fig. 4: Specificity and Sensitivity for identifying the SOZ and resection (RZ) for overlapping of onsets of spike and ripple propagations (SR).
Comparison with spike and ripple onset propagations.
IV. Conclusion
In this study, we propose a novel method that detects and maps spatiotemporal propagations of interictal spikes, ripples, and fast ripples in icEEG recordings from patients with DRE undergoing surgery. Our method estimates critical features of these propagations (e.g., onset and spread zones, propagation length and duration) and assess their overlapping onset as a potential reliable biomarker of the EZ. We showed for the first time that: (i) the overlapping onset of spikes and ripples is a highly specific predictor of the EZ compared to previously proposed biomarkers including the onset of spikes and onset of ripples; (ii) fast ripples propagate in time across large areas of the brain similar to interictal spikes and ripples; and (iii) spikes and fast ripples propagate with almost the same velocity which is much faster compared to the velocity of ripples propagations. The high specificity of overlapping onset of spikes and ripples for delineating the EZ are comparable only to fast ripples, which present significant limitations as epilepsy biomarkers since it is difficult to be detected with conventional macroelectrodes and cannot be seen in all patients with DRE. Contrarily, the overlapping onset of spikes and ripples was seen in all patients of this cohort. Moreover, the delineation of the EZ using this new biomarker was achieved by analyzing only 5 minutes of icEEG recordings. Our findings may have significant clinical relevance since they introduce a novel interictal biomarker which may shorten extraoperative icEEG, reduce surgical morbidity, and potentially improve the surgical outcome of children with DRE undergoing neurosurgery. Our findings also reveal new information about the pathophysiological mechanisms of fast ripples propagation by comparing them with already known mechanisms of propagations for other epilepsy biomarkers. To further enhance our algorithm’s performance and improve our understanding of propagation mechanisms, we aim to validate our algorithm in a larger cohort that also includes patients with poor surgical outcome.
Acknowledgments
This work was supported by the National Institute of Neurological Disorders & Stroke 454 (RO1NS104116-01A1, PI: C. Papadelis; 1R21NS101373-01A1, PIs: C. Papadelis & S. Stufflebeam).
References
- [1].Oldham MS, Horn PS, Tsevat J, and Standridge S, “Costs and clinical outcomes of epilepsy surgery in children with drug-resistant epilepsy,” Pediatr. Neurol, vol. 53, no. 3, pp. 216–220, Sep. 2015, doi: 10.1016/j.pediatmeurol.2015.05.009. [DOI] [PubMed] [Google Scholar]
- [2].Papadelis C et al. , “Interictal high frequency oscillations detected with simultaneous magnetoencephalography and electroencephalography as biomarker of pediatric epilepsy,” J. Vis. Exp, vol. 2016, no. 118, p. 54883, Dec. 2016, doi: 10.3791/54883. [DOI] [PMC free article] [PubMed] [Google Scholar]
- [3].Tamilia E et al. , “Surgical resection of ripple onset predicts outcome in pediatric epilepsy,” Ann. Neurol, vol. 84, no. 3, pp. 331–346, 2018, doi: 10.1002/ana.25295. [DOI] [PubMed] [Google Scholar]
- [4].Tamilia E et al. , “Scalp ripples as prognostic biomarkers of epileptogenicity in pediatric surgery,” Ann. Clin. Transl. Neurol, vol. 7, no. 3, pp. 329–342, Mar. 2020, doi: 10.1002/acn3.50994. [DOI] [PMC free article] [PubMed] [Google Scholar]
- [5].Dirodi M et al. , “Noninvasive Localization of High-Frequency Oscillations in Children with Epilepsy: Validation against Intracranial Gold-Standard,” in Proceedings of the Annual International Conference of the IEEE Engineering in Medicine and Biology Society, EMBS, 2019, vol. 2019, pp. 1555–1558, doi: 10.1109/EMBC.2019.8857793. [DOI] [PubMed] [Google Scholar]
- [6].Tamilia E, Madsen JR, Grant PE, Pearl PL, and Papadelis C, “Current and emerging potential of magnetoencephalography in the detection and localization of high-frequency oscillations in epilepsy,” Front. Neurol, vol. 8, no. JAN, 2017, doi: 10.3389/fneur.2017.00014. [DOI] [PMC free article] [PubMed] [Google Scholar]
- [7].Tadel F, Baillet S, VIosher JC, Pantazis D, and Leahy RM, “Brainstorm: A user-friendly application for MEG/EEG analysis,” Comput. Intell. Neurosci, vol. 2011, 2011, doi: 10.1155/2011/879716. [DOI] [PMC free article] [PubMed] [Google Scholar]
- [8].Navarrete M, Alvarado-Rojas C, Le Van Quyen M, and Valderrama M, “RIPPLELAB: A comprehensive application for the detection, analysis and classification of high frequency oscillations in electroencephalographic signals,” PLoS One, vol. 11, no. 6, Jun. 2016, doi: 10.1371/journal.pone.0158276. [DOI] [PMC free article] [PubMed] [Google Scholar]


