Abstract
Proton Hyperfine Sublevel Correlation (1H-HYSCORE) experiments have been used to probe the ligation structure of the Fe(II) active site of taurine:2-oxoglutarate dioxygenase (TauD), a non-heme Fe(II) hydroxylase. To facilitate Electron Paramagnetic Resonance (EPR) experiments, Fe(II) derivatives of the enzyme were studied using nitric oxide as a substitute for molecular oxygen. The addition of NO to the enzyme yields an S = 3/2 {FeNO}7 paramagnetic center characterized by nearly axial EPR spectra with g⊥ = 4 and g|| = 2. Using results from (i) an X-ray crystallographic study of TauD crystallized under anaerobic conditions in the presence of both cosubstrate 2-oxoglutarate and substrate taurine, (ii) a published theoretical description of the {FeNO}7 derivative of this form of the enzyme, and (iii) previous 2H-Electron Spin Echo Envelope Modulation (ESEEM) studies, we were able to assign the proton cross peaks detected in orientation-selected 1H-HYSCORE spectra. Discrete contributions from the protons of two coordinated histidine ligands were resolved. If substrate taurine is absent from the complex, orientation-selective HYSCORE spectra show cross peaks that are less resolved and when combined with information obtained from continuous wave EPR, support an alternate binding scheme for 2-oxoglutarate. HYSCORE studies of TauD in the absence of 2-oxoglutarate show additional 1H cross peaks that can be assigned to two distinct bound water molecules. In addition, 1H and 14N cross peaks that arise from the coordinated histidine side chains show a change in NO coordination for this species. For all of the TauD species, 1H hyperfine couplings and their orientations are sensitive to the detailed electronic structure of the {FeNO}7 center.
1. Introduction
Mononuclear non-heme Fe(II) oxygenases catalyze a diverse set of chemical reactions in nature and play important roles in metabolism and biosynthesis [1–3]. Key to their chemical diversity is a common active site structure that features Fe(II) coordinated to the protein through the facial arrangement of the side chains of two histidine residues and the carboxylate side chain of either aspartic or glutamic acid. As a result, the Fe(II) has three open coordination positions available for the binding of cofactors, substrates and molecular oxygen [4, 5].
Fe(II) in this coordination environment is integer spin (S = 2) with large zero-field splitting (ZFS), typical of this metal ion, thus prohibiting the use of conventional X-band electron paramagnetic resonance (EPR) spectroscopy for structural studies. In 1979, Salerno and Siedow showed that X-band continuous wave (cw)-EPR studies of the non-heme Fe(II) active site of lipoxygenase were possible using nitric oxide (NO) as a substitute for molecular oxygen [6]. The resulting EPR signal was nearly axial, with g⊥ = 4 and g|| = 2, and was attributed to an S = 3/2 spin system that arose from the formation of an Fe(II)•NO complex, or an {FeNO}7 paramagnetic center using the notation of Enemark and Feltham [6, 7]. In subsequent years, the use of NO to perform EPR studies of non-heme Fe oxygenases was pioneered by the research groups of J. Lipscomb and E. Münck [8–10]. Specifically, these authors used characteristic EPR signals from the {FeNO}7 species of several non-heme Fe(II) enzymes for characterizing the coordination of substrates, cofactors and inhibitors to the active site. Eventually, isotopologs of a variety of Fe(II) ligands were used to detect ligand hyperfine coupling to the {FeNO}7 paramagnetic centers using EPR line-broadening studies [11, 12].
More recently, EPR studies on {FeNO}7 derivatives of non-heme Fe(II) oxygenases have used orientation-selective electron-nuclear double resonance (ENDOR) or electron spin echo envelope modulation (ESEEM) methods to directly measure ligand hyperfine couplings [13, 14]. These approaches are particularly useful for mononuclear non-heme Fe(II) oxygenases because substrates and cofactors can either bind directly to the metal ion or be positioned in the active site as second sphere ligands. For example, Q-band ENDOR studies of naphthalene 1,2 dioxygenase were able to detect 2H-dipolar couplings that ranged from 0.07 – 0.14 MHz between the {FeNO}7 paramagnetic center and specifically deuterated naphthalene substrates. The magnetic field dependence of the associated 2H-ENDOR spectra could then be used to define the orientation of substrate naphthalene with respect to the magnetic axis system defined by the Fe-NO bond. In the same study, 2H and 14N couplings ranging from 2 – 15 MHz were measured for bound water and histidine ligands, respectively [15]. Q-band ENDOR studies of {FeNO}7 derivatives of 1-aminocyclopropane-1-carboxylic acid (ACC) oxidase demonstrated that substrate ACC binds to the Fe(II) center in a bidentate fashion prior to catalysis [16, 17]. 2H-Electron Spin Envelope Modulation (ESEEM) and 2H-Hyperfine Sublevel Correlation (HYSCORE) studies were used to measure weak hyperfine couplings between {FeNO}7 centers and specifically deuterated substrates/cosubstrates of taurine:2-oxoglutarate (2-OG) dioxygenase (TauD) [18, 19], SyrB2, a 2-OG dependent halogenase [20], and tyrosine hydroxylase (TyrH), a pterin-dependent non-heme Fe(II) hydroxylase [21].
For all of these studies, the interpretation of ligand hyperfine couplings depends on the electronic structure of the {FeNO}7 paramagnetic center. There is considerable evidence from experimental and theoretical studies of bioinorganic model complexes that {FeNO}7 is best described as a high spin Fe(III) antiferromagnetically coupled to an S = 1, NO− [22, 23]. This description places the principal axis of the ZFS interaction that dominates the EPR response of the resulting S = 3/2 system close to the axis of the Fe-NO bond and calls for the use of spin projection factors when interpreting hyperfine couplings in terms of distances [24]. Indeed, this approach was used in interpreting the results of 2H-HYSCORE studies [19, 20]. A second approach for interpreting weak 2H-hyperfine couplings in terms of structure has made use of the standard point dipole-dipole coupling expression and the assumption that 90 – 95 % of the unpaired spin density for the S = 3/2 {FeNO}7 center is centered on Fe [15, 18, 21]. For cases where the couplings are weak, through-space dipolar distances are long and the differences between these two models may not be large. However, in a more recent 1H-HYSCORE study of water ligands bound to the {FeNO}7 catalytic site of TyrH, spin projection factors were offered as an explanation for large differences in proton couplings found for water molecules bound to the metal center [25]. It should be noted that an alternative approach to probing mono-nuclear non-heme Fe(II) centers in proteins using vanadyl ion, VO2+, as a substitute for Fe(II) circumvents this complication and offers the simplification provided by an S = ½ paramagnetic center [19].
In the present study, we examine details of the spin projection factor and dipole-dipole coupling analysis approaches using 1H-HYSCORE spectroscopy to study three forms of TauD, a mononuclear, non-heme Fe(II) oxygenase that catalyzes the hydroxylation of taurine (2-aminoethanesulfonic acid) leading to the formation of aminoacetaldehyde and hydrogen sulfite as products. This hydroxylation is coupled to the decarboxylation of the cosubstrate, 2-OG, with both reactions occurring at the Fe(II) catalytic site in a step-wise fashion. As such, TauD is a member of a broad class of enzymes, 2-OG dependent oxygenases, that catalyze a variety of important biochemical reactions including hydroxylations, desaturations, ring formation, ring expansions, and halogenations [26]. The generally accepted chemical mechanism for TauD and the other 2-OG-dependent hydroxylases was first proposed over 40 years ago [27], and an updated version specific to TauD is shown in Scheme 1. Initially, the Fe(II) center is six coordinate with the two histidine and aspartate side chains provided by the protein and three open coordination sites occupied by water ligands. In the first step, two waters are displaced by the bidentate coordination of 2-OG. Subsequent addition of substrate taurine positions the substrate in the active site as a second sphere ligand and leads to the displacement of the remaining water ligand leaving the Fe(II) with a 5-coordinate, square pyramidal geometry. The formation of this TauD[taurine, 2-OG] complex facilitates the binding of molecular oxygen to the open coordination position. Once bound, O2 is activated and attacks the C2 carbon of 2-OG leading to the formation of CO2, succinate and a high valent Fe(IV)-oxo intermediate. The Fe(IV)-oxo then abstracts a hydrogen atom from the C1 position of taurine creating a substrate radical that is subsequently hydroxylated, perhaps by hydroxyl radical rebound chemistry, restoring the metal ion to its original ferrous state [28].
Scheme 1:
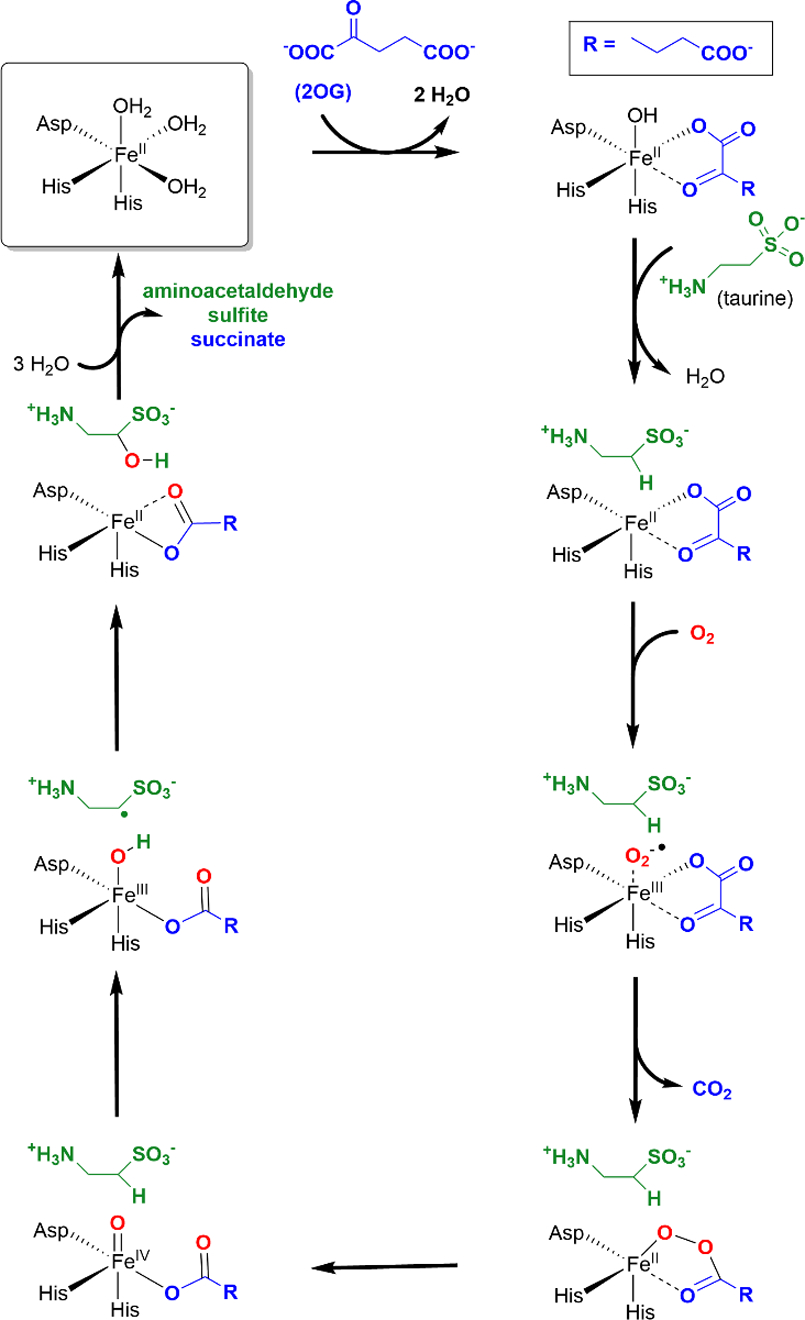
Catalytic Mechanism of TauD
The 1H-HYSCORE studies presented in this paper will focus on {FeNO}7 derivatives of three TauD species, TauD[taurine, 2-OG]NO, TauD[2-OG]NO, and TauD[taurine]NO. The TauD[taurine, 2-OG]NO species will provide a foundation for our work as an X-ray crystal structure of TauD with both 2-OG and taurine bound is known [29]. A detailed theoretical description of the {FeNO}7 derivative of TauD[taurine, 2-OG] has also been published and will supply a critical starting place for HYSCORE data analysis [23]. Combining the results of cw-EPR and HYSCORE studies, a more detailed description of the TauD[2-OG] and TauD[taurine] NO adducts was obtained.
2. Materials and Methods
TauD samples were prepared as previously described [18]. Both cw- and pulsed-EPR experiments were performed at X-band with a Bruker E-680X spectrometer equipped with an ER 4118X-MD-X5-W1 (MD5) probe and an Oxford CF-935 cryostat. An Oxford ITC-503 temperature controller was used for all experiments, and for pulsed EPR studies the sample temperature was set to 4.0 K to maximize spin echo intensity. HYSCORE measurements were made with the standard 4-pulse, 90°-τ−90°-t1−180°-t2−90°-τ-echo, scheme with all pulse widths set to 16 ns (FWHM). Two pulse channels were used so that the peak power of the 90° pulses could be attenuated by 6 dB from that used for the 180° degree pulse (approximately 800 W) [30]. The four-step phase cycle designated for non-ideal pulses was used [31]. Data collection made use of 16 ns time increments for both t1 and t2 dimensions with a 128 x 128 grid of time points collected. Data were processed using a second order polynomial to remove background decays followed by application of a Hamming window, zero filling to 256 points in each dimension and 2D-FFT. Absolute value spectra are displayed as contour plots with the plotting threshold set at 5 – 15 % of the maximum peak amplitude for the frequency window displayed.
Cw-EPR data were analyzed using the “pepper” module of EasySpin 5.2.28 running in the MATLAB 2019b environment (The Mathworks) [32]. Spectral simulations were based on a spin Hamiltonian for the S = 3/2 spin system that consisted of ZFS and electronic Zeeman terms and is given in Eqn. 1.
| (1) |
D is the zero field splitting term and has been shown to be approximately 10 cm−1 based on studies of Fe(II) model complexes and non-heme Fe(II) enzymes [8, 10, 22, 33]. E/D describes the rhombicity of the ZFS interaction and ranged from 0.00 – 0.04 for the TauD species studied. is the electron spin g-matrix that was found to show a modest axial symmetry with principal values close to 2.00, is the electron spin angular momentum operator and B is the magnetic field vector. The quality of spectral simulations was evaluated using a reduced χ2 value given by
| (2) |
where the yi are the simulated and experimental spectral amplitudes, npts is the number of data points considered in the simulation, and L is the number of adjustable parameters in the calculation. A uniform value of 0.5% of the maximum spectral amplitude was used for the standard deviation, σi, in our simulations.
The analysis of 1H-HYSCORE spectra made use of the “saffron” module in EasySpin [34] and was based on a spin Hamiltonian that featured nuclear Zeeman and electron nuclear hyperfine terms,
| (3) |
and in Eqn. 3 are the electron and nuclear spin operators, B is the magnetic field vector, γH is the proton gyromagnetic ratio and is the proton hyperfine coupling tensor. The proton hyperfine couplings examined in this work were taken to be axial with principal values given by (Aiso − T, Aiso -T, Aiso + 2T). Aiso and T are the isotropic and dipolar portions of the hyperfine coupling, respectively. To be used in Eqn. 3, the coupling tensor must be transformed into the principal axis system of the ZFS interaction using the EasySpin function AFrame. AFrame uses a zyʹzʹ rotation scheme to describe the transformation from the molecular frame to the principal axis system of a given proton’s hyperfine tensor [34]. Because the principal axis of the ZFS is essentially coincident with the Fe-NO bond and the cw-EPR spectra show near-axial symmetry, the molecular axis system can be considered coincident with the ZFS principal axis system for the studies presented here. As a result, the angles needed as arguments for the AFrame function of a given proton of the TauD {FeNO}7 site are readily related to structure [23, 35]. This process will be described in more detail below.
3. Results
3.1. cw – EPR spectra
Cw-EPR spectra of the TauD adducts studied in this work are of axial symmetry with g⊥ = 4 and g|| = 2 (Fig. 1 - inset), and are typical of S = 3/2 {FeNO}7 centers where large ZFS leads to an EPR spectrum that originates from the Ms = ±1/2 Kramer’s doublet. Figure 1 shows the g = 4 region of the cw-EPR spectra (black traces) collected for (a) TauD[taurine]NO, (b) TauD[2-OG]NO, and (c) TauD[taurine, 2-OG]NO along with spectral simulations in green. For all three NO adducts, a mixture of two different paramagnetic species was required to realize χn2 values below one. For example, when treating the TauD[taurine, 2-OG]NO sample (Fig. 1c) as a single species, the best fit simulation was obtained using |E|/D = 0.004, an |E|/D strain of σE/D = 0.018, and χn2 = 1.9. If a mixture of two species is considered, the signal can be simulated considering 70% of the {FeNO}7 centers to have |E|/D = 0.006 with σE/D = 0.005 (red trace in Fig. 1c), and the remaining 30% characterized by |E|/D = 0.017 with σE/D = 0.012 (blue trace in Fig.1c). The χn2 value for this model was 0.6 (green trace of Fig 1c). These results, along with the results for the TauD[taurine]NO and TauD[2-OG]NO samples presented using the same format, are shown in Figure 1 and summarized in Table 1.
Figure 1:
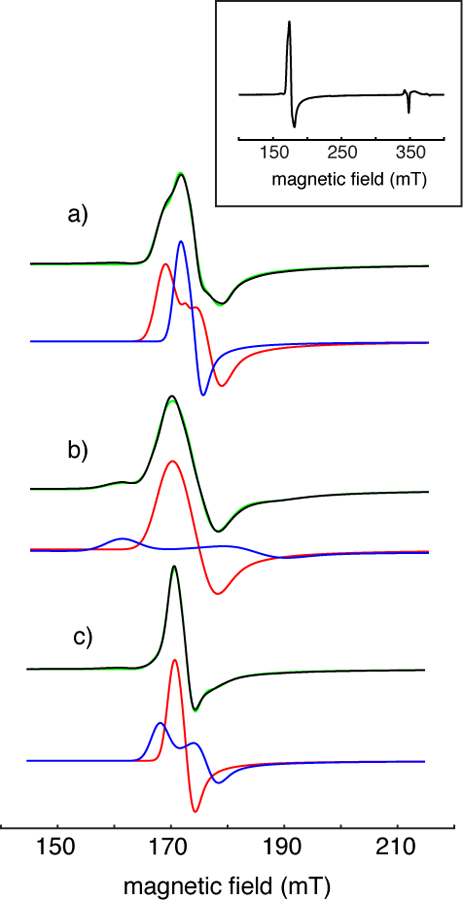
Cw-EPR spectra (black traces) showing the g = 4 region of (a) TauD[taurine]NO, (b) TauD[2-OG]NO and (c) TauD[taurine, 2-OG]NO. The inset shows a full spectrum of TauD[taurine]NO. Parameters for data acquisition that were common for all three spectra are: microwave frequency, 9.68 GHz; microwave power, 6.3 μW; sample temperature, 4.0 K; field modulation amplitude, 0.8 mT; field modulation frequency, 10 kHz; sample probe, Bruker MD5. The red and blue traces are spectral simulations for the majority and minority species, respectively, obtained using the spin Hamiltonian parameters provided in Table 1. These sub-spectra are scaled and offset to aid visualization, when combined (green traces) they yielded simulations with values that ranged from 0.6 – 0.9.
Table 1:
Cw-EPR spectral analysis for TauD derivatives
| Sample | |E|/D (±0.001) | g (± 0.002) | Fraction | σE/D (± 0.003) |
|---|---|---|---|---|
| TauD[taurine]NO | 0.006 | 2.008, 2.002 | 0.30 ± 0.05 | 0.005 |
| 0.016 | 2.010, 2.002 | 0.70 | 0.014 | |
| TauD[2-OG]NO | 0.014 | 2.023, 2.006 | 0.81 ± 0.05 | 0.016 |
| 0.048 | 2.028, 2.006 | 0.19 | 0.024 | |
| TauD[taurine, 2-OG]NO | 0.006 | 2.016, 2.001 | 0.71 ± 0.10 | 0.005 |
| 0.017 | 2.011, 2.001 | 0.29 | 0.012 |
D = 3 x 10⁵ MHz (10 cm−1) for all simulations. Error estimates were based on parameter changes that led to an increase of one standard deviation in .
3.2. TauD[taurine, 2-OG]NO
1H-HYSCORE spectra for the TauD[taurine, 2-OG]NO sample collected at magnetic field positions from 170 mT (g =4) to 300 mT (g = 2.3) are shown in Figure 2. The red lines drawn on these 2-dimensional spectra are 1H antidiagonals, lines that are perpendicular to and intersect the frequency diagonal at the proton Larmor frequency at each magnetic field value. Cross peaks shifted to the high frequency side of the antidiagonal are distinguished by larger dipolar couplings and, therefore, often show a substantial degree of orientation selection. For protons characterized by an axial hyperfine interaction, cross peaks will move along an arc, or ridge, trajectory as the magnetic field is varied from g = 4 to g = 2. The ends of these ridges intersect the frequency antidiagonal at the extremes of the hyperfine tensor, Aiso – T and Aiso +2T [36]. Cross peak positions are then functions of the magnetic field used for a given experiment and the orientation of the nucleus in the magnetic axis system of the unpaired electron spin [37]. The contour plots in Figure 2 are arranged in two sets. The top line of plots displays a frequency range from 0 – 20 MHz in each dimension and shows the 1H-HYSCORE response in the g = 4 region, 170 and 190 mT, and near the g = 2 region, 300 mT. At 170 mT, two sets of cross peaks are observed near extremes along the frequency antidiagonal, one centered at (3.5, 12.3 MHz) and the other at (5.8, 9.0 MHz). These cross peaks occur in pairs about the frequency diagonal, but will be referred to in this paper using just the coordinates of the peak to the high frequency (f2) side of the frequency diagonal. As one moves across the EPR spectrum, more complex cross peak patterns are observed. To better illustrate these observations, the contour plots obtained at 240, 260, and 280 mT are shown on the bottom line of Figure 2 with an expanded frequency scale. At 240 mT, four sets of cross peaks are resolved including two close to the antidiagonal at (8.6, 11.7 MHz) and (7.6, 13.2 MHz), one well off of the antidiagonal at (9.2, 13.2 MHz) and a fourth characterized by a ridge shape centered at approximately (6, 15 MHz). As one moves to 280 mT, this pattern has collapsed into a pair of cross peaks resolved at (9.5, 14.7 MHz) and (8.5, 16.1 MHz). Moving further upfield all of the cross peaks collapse into a wedge – shape contour close to the frequency diagonal at 300 mT (g = 2.3).
Figure 2:
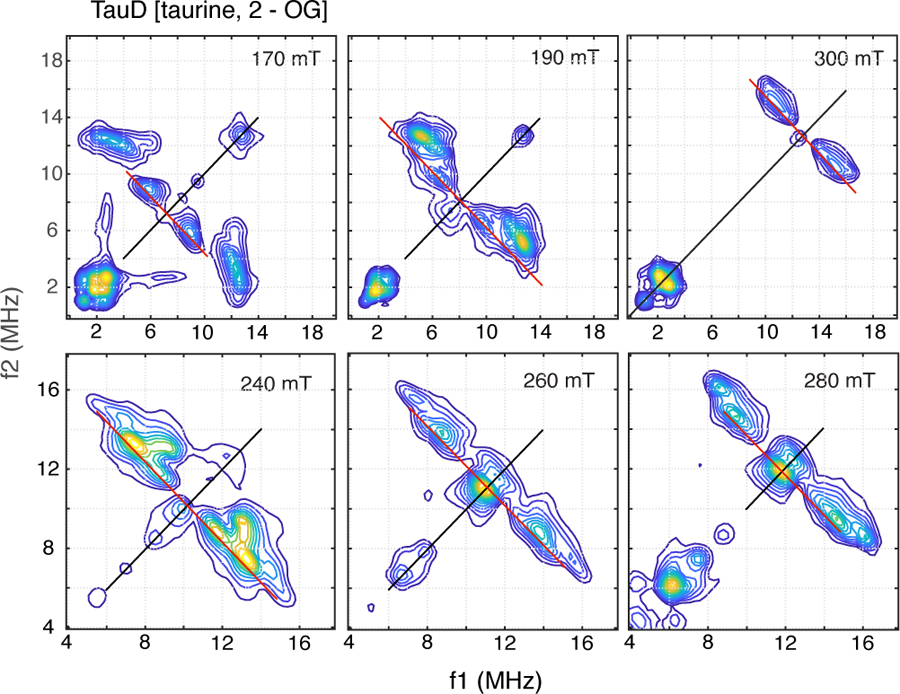
HYSCORE spectra of TauD[taurine, 2-OG]NO collected at field positions ranging from 170 mT to 300 mT. Contour plots were made using a cut-off threshold that varied from 5 – 15% of the maximum amplitude displayed in the plotting window. Data were collected at 9.6862 GHz using the following timing parameters: τ, 136 ns (170 mT), 124 ns (190 mT), 96 ns (240 mT), 92 ns (260 ns), 84 ns (280 mT), 156 ns (300 mT); starting values for t1 and t2, 40 ns; time increment, 16 ns.
While these spectra may appear complex, we started with this sample for three reasons: (i) there is an X-ray crystal of TauD where crystals were grown anaerobically with both 2-OG and taurine bound to the enzyme [29], (ii) a detailed computation chemistry study was published of {FeNO}7 derivatives of this TauD species [23], and (iii) 2H-ESEEM and 2H-HYSCORE studies of TauD[taurine, 2-OG]NO have been reported where the structural relationship between the {FeNO}7 center and substrate taurine was probed [18, 19]. Scheme 2 shows the Fe(II) site obtained from the X-ray structure of TauD[taurine, 2-OG] (PDB: 1GY9). The Fe(II) is facially coordinated by His-99, Asp-101, and His-255, and chelated by cosubstrate 2-OG, forming a square pyramidal, 5-coordinate structure. The five protons in this structure that are closest to the metal ion were added using PYMOL and are circled in Scheme 2. 2H-ESEEM and HYSCORE studies of this species show that NO binds at the open coordination position opposite His-255 to form a 6-coordinate complex. Computational work done on the {FeNO}7 adduct of TauD[taurine, 2-OG] showed two possible orientations for coordinated NO, with the lowest energy conformer having an Fe-N-O bond angle of 144° that projects along the Fe-O bond to the 2-keto group of cosubstrate 2-OG (x-axis in Scheme 2). Placing the Fe-NO bond along the z-axis in Scheme 2 and using an Fe-N bond length of 1.8 Å, a N-O bond length of 1.15 Å, and an Fe-N-O bond angle of 145°, the coordinates of the atoms of the {FeNO}7 unit can be determined. The closest protons of the His-99 side chain are 3.3 Å from the Fe, make a ± 40° angle with respect to the Fe – N (His) bond, and are taken to be in the xy plane of our magnetic axes system. For His-255, one can start by positioning the 2 protons of the side chain at a distance of 3.3 Å from the Fe and confine the ligand to the xz plane.
Scheme 2 –
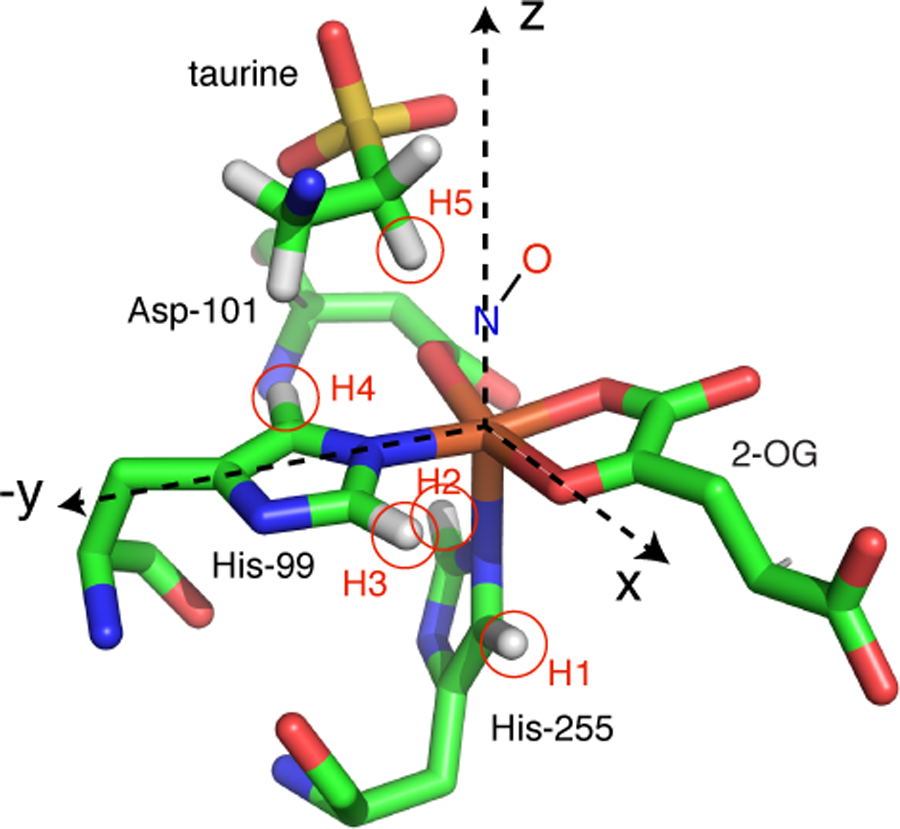
Working structure of TauD[taurine, 2-OG]NO (adapted from PDB:1GY9)
It is straightforward to use the approximate coordinates of these four histidine protons to determine their distances from the Fe, N, and O of the {FeNO}7 center. The contributions from each atom to the dipolar coupling can then be determined from application of the point dipole-dipole model and an overall coupling determined using spin projection factors as given by Silakov and co-workers [20]. For example, the distance of the proton labeled “H1” in Scheme 2 to the Fe, N, and O of the {FeNO}7 center are 3.3, 4.8, and 5.5 Å, respectively. These distances yield proton dipolar couplings of 2.2, 0.7, and 0.5 MHz. Considering the {FeNO}7 center to be an S = 5/2 Fe(III) antiferromagnetically coupled to an S = 1 NO− yields an overall dipolar coupling of
| (4) |
Repeating this procedure for the other 4 histidine protons labeled in Scheme 2 yields TH2, TH3, and TH4 values of 2.87, 2.54, and 2.62 MHz respectively. For each of these protons, the contribution arising from the dipolar coupling to Fe(III) dominates Eqn. 4. As a result, the principal axis of the hyperfine coupling should be well-approximated by the Fe – H vector making it straightforward to use Scheme 2 to determine the transformation angles needed for HYSCORE simulations. Because the H1 proton considered above was taken to be in the xz plane of the magnetic axes system, a rotation about the y axis of 140°, or −40°, would serve to make the magnetic z axis colinear with the Fe – H1 vector. For H2, a +40° rotation about the y axis would be needed. For the protons of His-99, the transformation from the magnetic axis system shown in Scheme 2 to the two hyperfine principal axes systems would require an initial z rotation of +/− 50° followed by a −/+ rotation of 90° about y’. In practice, the axial nature of the cw-EPR spectra of the TauD species studied here, and our assumption that the hyperfine interactions are axial, made simulations less sensitive to values chosen for the initial z rotation angle and obviated the need for a z’ rotation. For the C1 proton on taurine, the results of 2H-ESEEM studies can be used to define the hyperfine coupling and tensor orientation for calculations. This coupling is dipolar with T = − 1.3 MHz and a y’ axis rotation of −26° following Scheme 2.
Simulations using the parameters described above were adequate and are shown in Figure S1 of the supplementary information (SI). The chief shortcoming of this model was that it failed to account for the high frequency ridge that is first revealed at approximately (6, 15 MHz) in the 240 mT contour plot (Fig. 2) and then becomes more pronounced as one moves towards g = 2. At 280 mT, the simulations fail to account for the cross peak at (8.5, 16.1 MHz). Because this coupling is moving to the higher frequency extreme of the coupling ridge as the magnetic field approaches g = 2, it must be associated with either His-255 or substrate taurine. Given the smaller hyperfine coupling measured previously for taurine and parallel HYSCORE studies using samples prepared with perdeuterated taurine (Fig. S2), His-255 must account for this feature in the data. Indeed, better agreement between our simulations and the data was obtained by allowing His-255 to be skewed somewhat from its symmetric depiction about the Fe-N bond in Scheme 2, so that the dipolar coupling from H2 would be increased to 3.2 MHz, with concomitant increase in the y’ transformation angle. This skewing also resulted in a lowering of the dipolar coupling to H1 and a modest shift in its y’ transformation angle as well. 1H-HYSCORE simulations obtained with this adjusted set of coupling parameters are shown as red contours in Figure 3. In addition to the changes made for His-255 proton couplings, an Aiso of 0.2 MHz was added to all of the histidine proton couplings to get better agreement between the experimental data and simulations. The proton hyperfine coupling parameters used in the simulations are summarized in Table 2.
Figure 3:
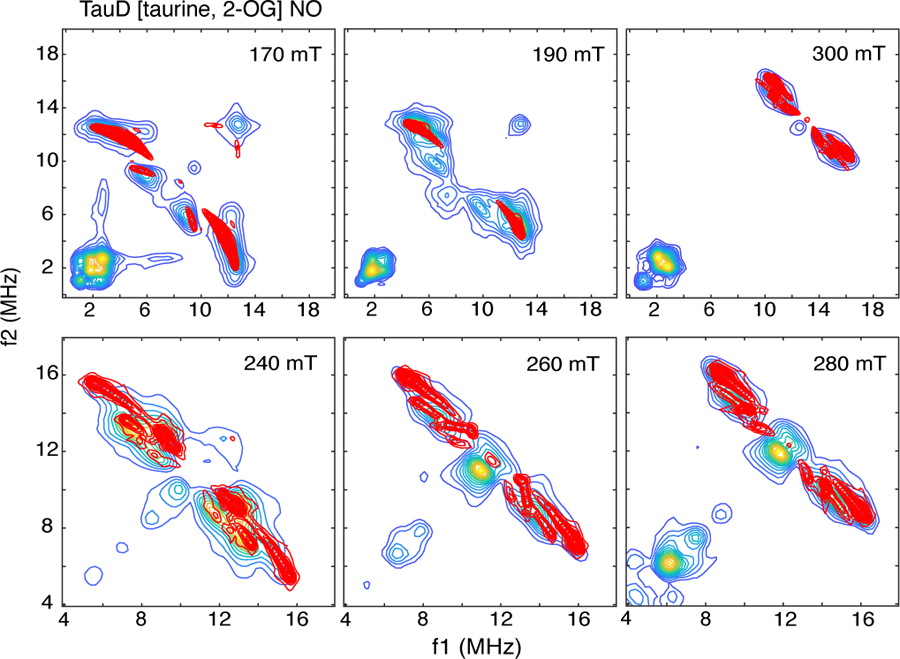
Simulations (red contours) of the HYSCORE contributions from the five protons closest to the {FeNO}7 center of TauD[taurine, 2-OG]NO. The spin Hamiltonian parameters used in the simulations are given in Table 2. Simulations were plotted with a threshold of 5 % of the maximum amplitude to facilitate visualization.
Table 2:
1H Hyperfine Coupling Parameters for TauD species
| Sample | Proton | Aiso (MHz) (±0.2 MHz)* | T (MHz) (± 0.2 MHz)* | AFrame – z | AFrame – y’ (± 4°)* |
|---|---|---|---|---|---|
| TauD[taur., 2-OG]NO | His-255 – H1 | 0.2 | 2.7 | 9° | −29° |
| His-255 – H2 | 0.2 | 3.2 | 9° | 63° | |
| His-99 – H3 | 0.2 | 2.6 | −50° | 90° | |
| His-99 – H4 | 0.2 | 2.6 | 50° | −90° | |
| Taurine – C1-H5 | 0 | −1.3 | 0° | 26° | |
| TauD[taur.]NO | His-255 – H1 | 0.2 | 1.6 | 0° | −57° |
| His-255 – H2 | 0.2 | 2.6 | 0° | 38° | |
| His-99 – H3 | 0.2 | 1.3 | 90° | −57° | |
| His-99 – H4 | 0.2 | 2.6 | 90° | −34° | |
| Taurine – C1 – H5 | 0 | 2.6 | 40° | −43° | |
| W1 – 1 | 0 | 4.5 | −3° | 68° | |
| W1 – 2 | 0 | 5.3 | −18° | 103° | |
| W2 – 1 | 0 | 4.7 | −106° | 74° | |
| W2 – 2 | 0 | 5.5 | −97° | 110° |
Error estimates were derived from overlays of experimental and simulated contour plots.
3.3. TauD[2-OG]NO
1H-HYSCORE of TauD[2-OG]NO were similar to those obtained for TauD[taurine, 2-OG]NO, but were lacking in resolution. Figure 4 shows contour plots of the spectra obtained at 240, 280, and 300 mT that are expanded about the proton Larmor frequency for comparison with the data collected for the TauD[taurine, 2-OG]NO sample (Fig. 2). The contour plot obtained at 240 mT for the TauD[2-OG]NO sample shows that the two cross peaks observed along the proton antidiagonal at (7.6, 13.2 MHz) and (8.6, 11.7 MHz) for the TauD[taurine, 2-OG]NO sample have merged into a single, broad cross peak for the TauD[2-OG]NO adduct. The ridge that was attributed to the stronger coupled proton of His-255 for the TauD[taurine, 2-OG]NO sample at 240 mT is also not observed. This is also true of the contour plot obtained at 280 mT for the TauD[2-OG]NO sample (Fig. 4 - center), where only one elliptically shaped 1H contour is found. Still, if one compares the frequency extent, or footprint, of the overall 1H HYSCORE contours for the spectra obtained from TauD[taurine, 2-OG]NO with those from TauD[2-OG]NO, they are well-matched. It follows that the proton hyperfine couplings provided in Table 2 for His-255 and His-99 predict cross peaks that fall within the contours obtained for TauD[2-OG]NO. The loss of resolution observed in the 1H-HYSCORE spectra for this NO adduct mirrors the loss of resolution observed for the g = 4 feature of the cw-EPR spectrum as demonstrated by comparison of Figures 1b and 1c. These changes are likely tied to the plasticity of the active site and features of 2-OG coordination that will be discussed below.
Figure 4:
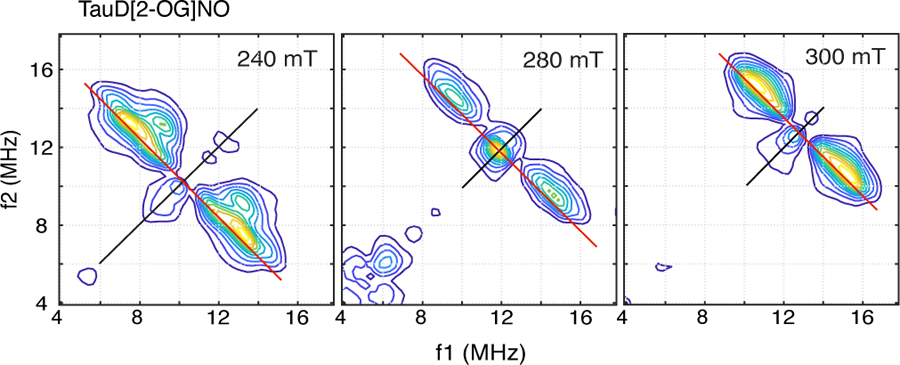
1H – HYSCORE spectra of TauD[2-OG]NO taken at 9.6807 GHz using the conditions described in the text and the caption for Fig. 2.
3.4. TauD[taurine]NO
Orientation-selected 1H-HYSCORE spectra of the TauD[taurine]NO adduct are shown in Figure 5. These spectra are markedly different from those shown previously for enzyme samples where cosubstrate 2-OG was chelated to the {FeNO}7 center. Two unique sets of cross peaks were resolved. The first set, shows a cross peak at (5.6, 9.3 MHz) at 170 mT (g = 4) that tracks away from the frequency diagonal as the magnetic field increases towards g = 2. Overall, this cross peak remains closer to the frequency diagonal at all observation fields and can be assigned to the coupled protons of the two histidine ligands. The second class of couplings gives rise to a faint pair of proton cross peaks at (4.9, 17.5 MHz) and (6.1, 18.5 MHz) at 240 mT with the overall contour showing a heart-like shape. As the magnetic field is increased, these cross peaks become more intense with their heart-shaped pattern becoming better resolved. At 260 mT, the two lobes of this pattern are observed at (7.1, 17.3 MHz) and (7.8, 18.3 MHz), and at 280 mT, they are resolved at (8.7, 17.6 MHz) and (9.4, 18.2 MHz). At 300 mT, their contributions to the HYSCORE spectrum are convolved with those due to the histidine protons and only a faint cross peak at (11.0, 17.6 MHz) is resolved. These cross peaks are typical for the protons of water ligands coordinated an {FeNO}7 paramagnetic center and have been described previously for {FeNO}7 model complexes [38] and for the mononuclear non-heme Fe(II) enzyme, TyrH [25]. These two sets of resonances differ in terms of their dipolar coupling. Our analysis of the HYSCORE spectra of the TauD[taurine, 2-OG]NO samples showed that typical dipolar couplings for the protons of the histidyl side chain are in the 2.5 – 3.2 MHz range. Previous work done on {FeNO}7 model complexes and TyrH showed that the dipolar couplings typical for water ligands range from 4 – 6 MHz. As a result, it is not feasible to consider both classes of protons in the same simulation because of their predicted differences in cross peak intensity, and because limitations of our pulse EPR instrument likely affected the amplitudes of the water proton cross peaks.
Figure 5:
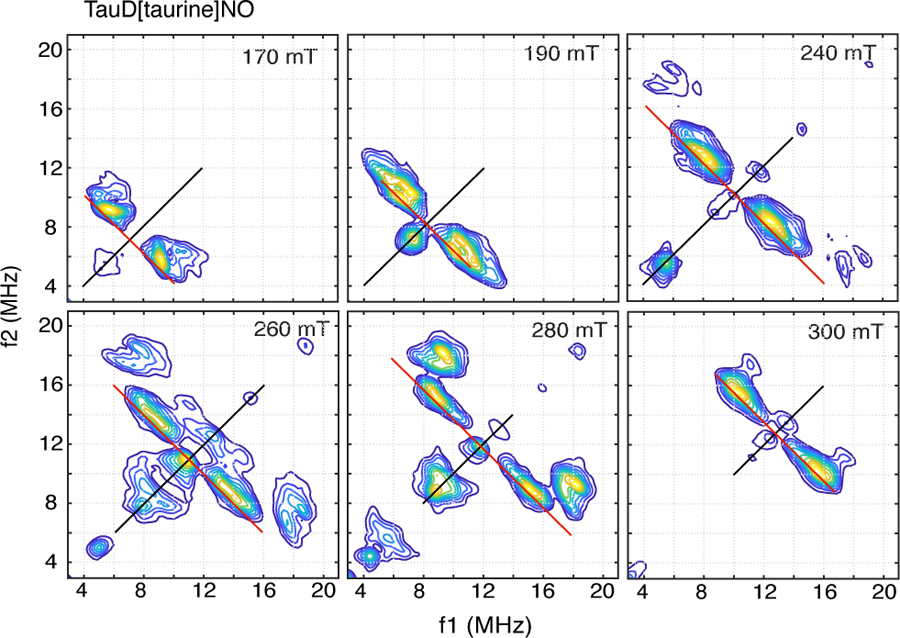
1H-HYSCORE spectra collected for TauD[taurine]NO taken at 9.6818 GHz using the conditions described in the text and in the caption for Fig. 2.
To analyze the 1H-HYSCORE spectra due to the 4 protons of His-99 and His-255, we used the same approach developed above for the TauD[taurine, 2-OG]NO adduct. A comparison between the 1H-HYSCORE spectrum collected at 170 mT (Fig. 5) with its counterpart collected for the TauD[taurine, 2-OG]NO sample (Fig.2) indicates that NO is coordinated differently in the two samples. Specifically, for TauD[taurine, 2-OG]NO the 170 mT 1H-HYSCORE spectrum (Fig. 2) shows a ridge – like cross peak centered at higher frequency, (3.5, 12.3 MHz), and a second cross peak at (5.8, 9.0 MHz). The ridge-like cross peak is typical for field positions where one is sampling a larger range of couplings over the limits from A|| to A⊥. Indeed, Scheme 2 shows that the coordination of NO at the Fe site of TauD results in His-255 being trans to the {FeNO}7 group and His-99 being cis. As a result, when the observing magnetic field is at g = 4, all orientations perpendicular to the Fe-NO bond axis will be detected and the greater extent of the hyperfine tensors of the His-99 protons will be observed. For the TauD[taurine]NO species, the 1H-HYSCORE spectrum at 170 mT shows just a single, well-resolved cross peak closer to the frequency diagonal at (5.6, 9.3 MHz), showing that we are sampling a smaller, more uniform range of couplings at g = 4. For this to occur, NO must coordinate to Fe(II) in a fashion that allows the coupled protons of His-99, His-255, and taurine to have similar dipolar couplings and hyperfine tensor orientations that are more aligned with the principal axis system of the ZFS. This restriction can be realized if NO is placed at the coordination site taken by the 2-oxo group of 2-OG in Scheme 2. In support of this idea, the 14N-HYSCORE spectra of our three TauD adducts, show identical responses for TauD[taurine, 2-OG]NO and TauD[2-OG]NO samples, but are markedly different for the TauD[taurine]NO adduct (Fig. S3).
The foundation for our analysis of His-99, His-255, and taurine proton couplings is the structure provided in Scheme 3. This structure was taken from the x-ray crystal structure of TauD[taurine, 2-OG] with the 2-OG cosubstrate removed and the magnetic axis system shifted as shown. Taking the Fe-NO bond to be coincident with the z-axis, confining the {FeNO}7 group to the xz plane (the NO bond projects along +x), and using the Fe-N-O bond angle and bond lengths used above for the Fe(taurine, 2-OG]NO analysis, the distances from the {FeNO}7 atoms and the five closest protons, labeled H1 – H5 in Scheme 3, can be estimated. Because protons H1 and H3 are closer to the NO group than they are to Fe, their couplings as determined from Eqn. 4 are reduced to 1.6 and 1.3 MHz, respectively. For H2 and H4, the NO group is more distant and couplings of 2.8 MHz are obtained for both nuclei. For the closest C1 proton of taurine, a stronger dipolar coupling of 3.4 MHz is estimated from the 1GY9 structure. As done previously, the Fe-H vectors can be used to obtain initial estimates of the transformation angles needed for HYSCORE simulations. However, because the couplings to H1 and H3 are substantially reduced from their Fe(III)-only value of 3.1 MHz, the y’ transformation angle for each will be greater than the ± 50° estimate given by their Fe – H vectors. For the stronger coupled protons, H2, H4, and H5, the 1GY9 structure shows that their Fe – H vectors make angles of 62, 53, and 58° with the Fe-O bond to Asp-101, respectively. The contributions from NO should reduce these values. A reasonable set of simulations was obtained using this strategy and is shown as red contours superimposed on the 1H-HYSCORE spectra of TauD[taurine]NO (Fig. 6). The proton hyperfine couplings and orientations used to generate these simulations are given in Table 2. These simulations required that the dipolar couplings for the stronger coupled set, H2, H4, and H5, be more uniform and a value of 2.6 MHz was used for all three protons.
Scheme 3.
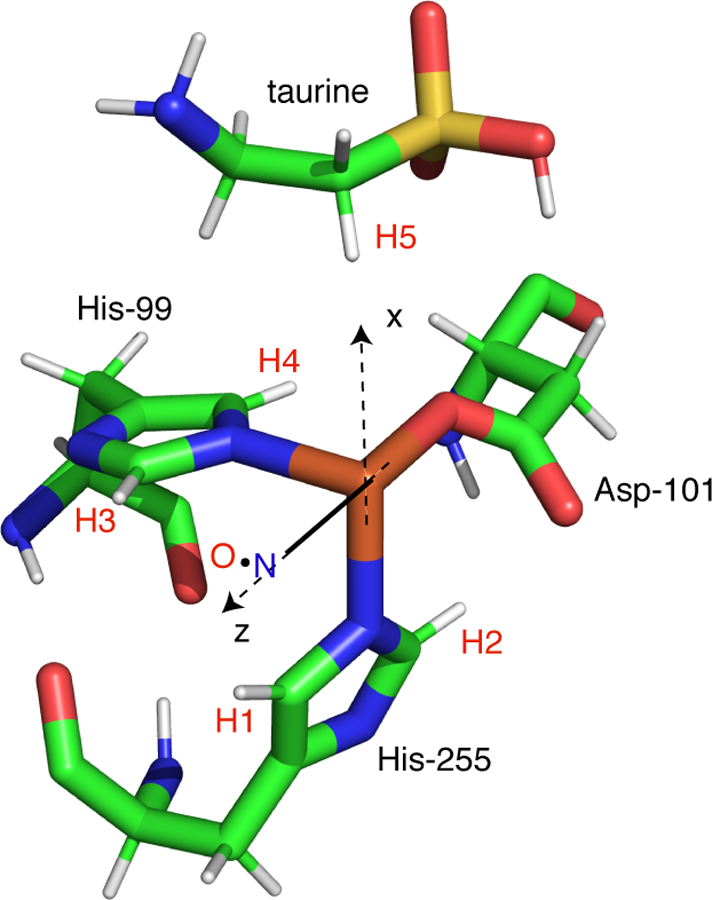
Working structure for TauD[taurine]NO (adapted from PDB: 1GY9)
Figure 6:
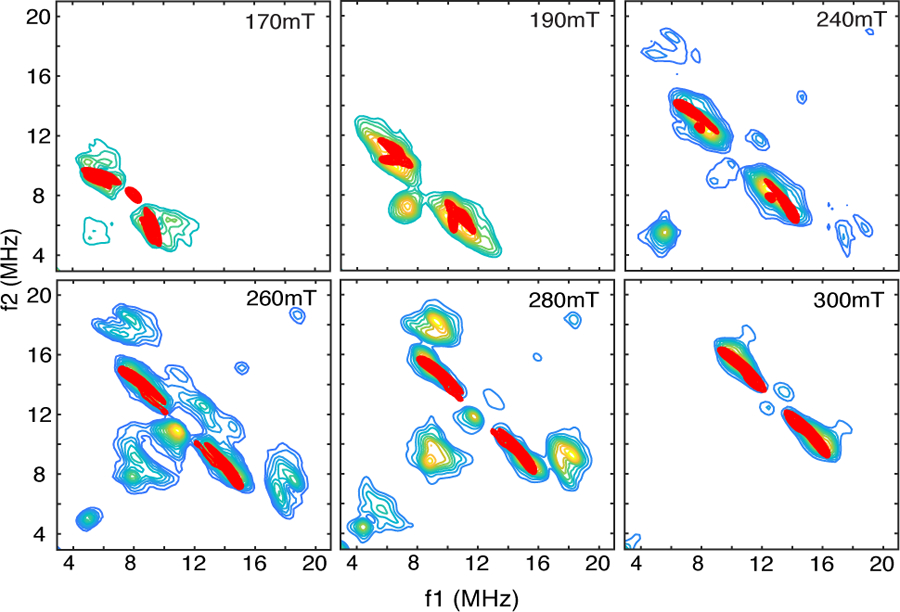
1H-HYSCORE simulations (red contours) for the 5 protons of His-99, His-255 and taurine that are closest to the {FeNO}7 paramagnetic center for TauD[taurine]NO. Spin Hamiltonian parameters for the simulations are provided in Table 2. Plotting thresholds for the simulations were adjusted to facilitate comparison with the experimental data (colored contours).
The heart-shaped contours that are attributed to the protons of water ligands are a consequence of proton dipolar couplings that show at least two distinct ridges in the HYSCORE spectrum. Because the protons of bound water molecules are close to all of the atoms of the {FeNO}7 paramagnetic center, their dipolar couplings can vary by as much as 2 MHz, depending on their orientation with respect to the Fe-NO bond axis and the projection of the NO group onto the water ligand’s bond axis. For the TauD[taurine]NO sample simulations, two water molecules bound to the open coordination positions were considered. Our treatment used the formalism developed previously for systematically varying the orientations of water ligand protons and their respective dipolar couplings [25, 38]. The simulations, shown as red contours superimposed on the experimental spectra from TauD[taurine]NO are shown in Figure 7. The dipolar couplings for the four water protons considered in the simulations and the orientations of their coupling tensors with respect to the magnetic axes are listed in Table 2. Each of the two water molecules features a smaller dipolar coupling, 4.5 MHz for water 1 (W1) and 4.7 MHz for water 2 (W2), and y’ rotation angles, for relating the magnetic principal axis system (Fe-NO bond axis) to their hyperfine principal axis systems, of approximately 70°. Using the axis system provided in Scheme 3, and placing water ligands at the two open coordination positions along the +x and -y axes, reveals that these two protons are closest to the NO ligand. These two protons are responsible for the cross peaks along the lower ridge. The remaining two protons have larger dipolar couplings, 5.3 MHz (W1) and 5.5 MHz (W2), y’ rotation angles >100°, and give rise to the cross peaks that form the upper ridge of the heart-shaped contours. Because these two protons are furthest from the NO group, their dipolar couplings are dominated by their proximity to Fe(III) and larger coupling values are realized.
Figure 7:
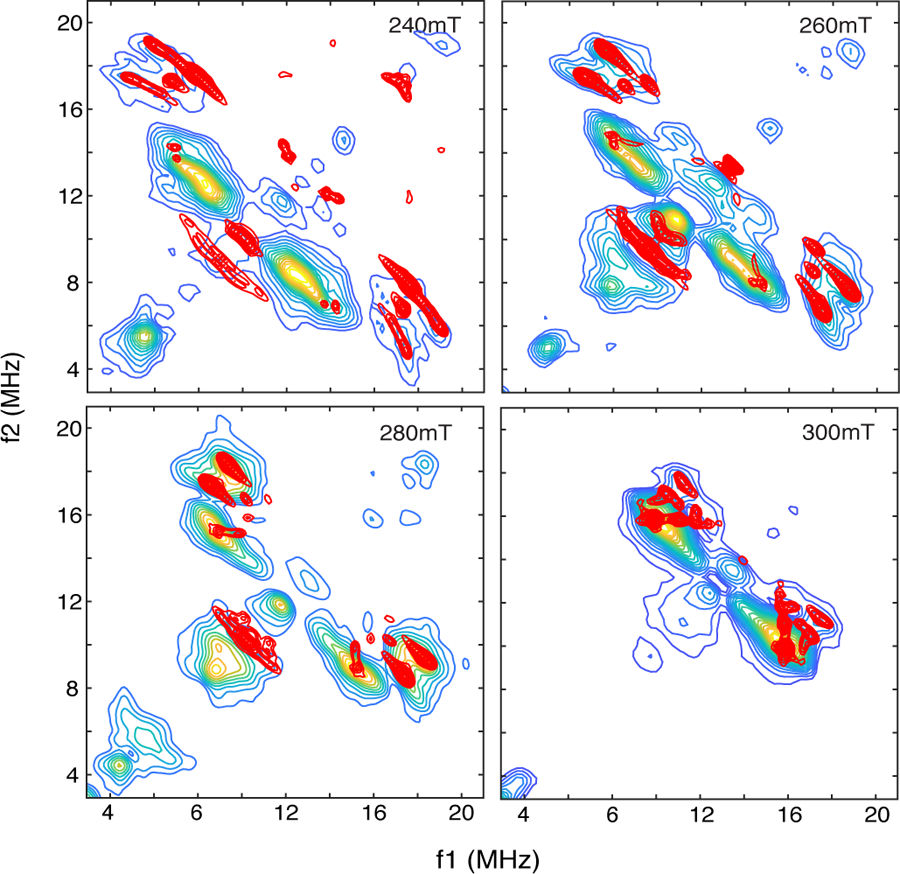
1H-HYSCORE simulations (red contours) for the 4 protons attributed to water ligands bound to the {FeNO}7 center of TauD[taurine]NO. The spin Hamiltonian parameters used in the simulations are provided in Table 2. Plotting thresholds for the simulations were adjusted to facilitate comparison with the experimental data (colored contours).
4. Discussion
The experimental results and analysis presented in this paper form a nice illustration of the unique capabilities of EPR spectroscopy and the HYSCORE technique for probing the structure of paramagnetic centers in randomly ordered systems. We began with studies of the {FeNO}7 derivative of TauD[taurine, 2-OG] where x-ray crystallographic, and detailed electronic structure calculations were available. Using a structural model derived from these previous studies, we were able to analyze 1H-HYSCORE spectra of the TauD[taurine, 2-OG] NO adduct with only minor adjustment of the predicted hyperfine couplings and tensor orientations. These modifications involved a straightforward canting, or skewing of His-255 to force the proton couplings of this ligand to be inequivalent. With these adjustments we were able to account for an additional discrete cross peak and the overall dependence of the 1H-HYSCORE response on magnetic field strength/orientation. Because the hyperfine coupling for the four proximal histidyl imidazole protons are substantially determined by dipolar coupling with Fe, tensor orientations could be determined without considering the detailed electronic structure of the {FeNO}7 paramagnetic center. However, evaluation of the dipolar couplings was facilitated by considering the {FeNO}7 center to consist of a high spin Fe(III) antiferromagnetically coupled to an S = 1 NO−. Using this model and the appropriate spin projection factors, dipolar couplings that averaged 2.8 MHz for the two proximal protons of His-255 and 2.6 MHz for their His-99 counterparts were obtained. These values worked well in simulations and the 1H-HYSCORE contour plots could be accounted for with just the slight modification mentioned above. Using the more simplistic model for the dipolar couplings, one that considers 90 – 100% of the unpaired electron spin to reside on the metal center, the Fe – H distance of 3.3 Å to all four proximal histidine protons results in a dipolar coupling of 2.0 – 2.2 MHz.
While this difference in predicted dipolar couplings would easily be corrected through the process of simulating the 1H-HYSCORE spectra of Figure 2, there are situations where it would be more problematic. In a previous work from our lab, 2H-ESEEM was used to study TauD[1,1-2H-taurine, 2-OG]NO. By fitting orientation selective 2H-ESEEM spectra at multiple magnetic field positions across the EPR spectrum, we found that the dipolar coupling to the closest deuteron of taurine was 0.19 ± 0.03 MHz and that the principal axis of the hyperfine tensor made a 26 ± 6° angle with the Fe-NO bond. These results were interpreted using the point dipole-dipole approximation assuming that 95% of the unpaired spin density was on Fe. A distance of 3.9 ± 0.3 Å between the closest C1-deuteron of taurine and the metal ion was obtained [18]. This distance is substantially greater than the 3.1 Å predicted by the x-ray crystal structure of the TauD[taurine, 2-OG] species (PDB: 1GY9) [29]. Alternatively, if one treats the {FeNO}7 electronic structure as an S = 5/2 Fe(III) antiferromagnetically coupled to an S = 1 NO− and computes the coupling using spin projection factors [20], the 3.1 Å Fe – 2H distance and 26° orientation with respect to the Fe-NO bond axis yields an approximate dipolar coupling of −0.24 MHz. Because the ESEEM experiment only measures the magnitude of the dipolar couplings, the value estimated from the 1GY9 structure agrees well with that measured in our previous experiments. For this particular geometry, the NO ligand dominates the 2H hyperfine coupling and has a substantial effect on the interpretation of the measured dipolar coupling and tensor orientation.
The cw-EPR spectrum of the TauD[taurine, 2-OG]NO sample was best simulated as a mixture of two species with 71% of the amplitude attributed to an S =3/2 species characterized by |E|/D = 0.006 and a small strain in |E|/D of 0.005. The remaining 29% of the amplitude was derived from a second S = 3/2 center with a slightly larger |E|/D of 0.017 and σE/D = 0.012. The computational study of this TauD derivative that helped provide the foundation for our analysis of the 1H-HYSCORE data predicted that a second Fe-NO rotamer, one with the NO group directed towards the Fe-O bond associated with Asp-101 coordination, might also be found. A modest shift of 0.02 in |E|/D was predicted for this rotamer [23]. The effect of this NO orientation on the 1H-HYSCORE would likely be small because the magnetic axis system of Scheme 2 would just be rotated by 180° about the z-axis. That action would leave the couplings and tensor orientations to be considered in the HYSCORE analysis unchanged and allow for the high resolution observed in our measurements in spite of the speciation (Fig. 2).
The cw-EPR spectrum of the TauD[2-OG]NO sample also provides evidence for the presence of two species. The majority species accounts for 81% of the spectral amplitude and is characterized by |E|/D = 0.014 and a large strain in |E|/D of 0.016. The minor species is quite different from the others characterized in this study with |E|/D = 0.048 and σE/D = 0.024. 1H- and 14N-HYSCORE spectra (Figs. 4 and S3) reveal only modest differences from those collected for the TauD[taurine, 2-OG]NO sample, showing that the majority species has the structure depicted in Scheme 2, with NO bound opposite His-255. While 1H-HYSCORE spectra showed cross peak contours of similar overall shape to those of the TauD[taurine, 2-OG]NO sample, they lacked the resolution of individual 1H contributions observed at some field positions. This absence could be a reflection of the plasticity of the TauD active site. To date, it has only been possible to crystallize the Fe-containing enzyme with both substrate taurine and cosubstrate 2-OG bound to the protein [29]. The cw-EPR spectra of the {FeNO}7 derivatives of TauD (Fig. 1) show that the addition of taurine narrows the EPR lineshape at g = 4. Taken together, these observations indicate that the structure is better defined, or more uniform, when both substrate and cosubstrate are bound.
The minority species present for the TauD[2-OG]NO sample may represent an alternate binding mode for 2-OG. Specifically, in the absence of taurine, it would be possible for 2-OG to chelate Fe with the C1 carboxylate group coordinated opposite His-255. This orientation would force NO coordination at the position opposite His-99. Because the structural relationship between the NO and the two histidine ligands would be similar to the majority species, with one histidine ligand trans to the NO and the other cis, the 14N-HYSCORE would be similar. The 1H-HYSCORE would also be similar, but it would be unlikely to show the same precise cross peak locations leading to the observed loss in resolution.
One of the most surprising results from this study concerned the unique binding of NO to the coordination site opposite Asp-101 determined for the TauD[taurine]NO sample. This coordination results in both histidine ligands being cis to the Fe-NO bond axis and, because their imidazole rings appear to remain in orientations close to those found for the TauD[taurine, 2-OG] adduct (Scheme 3), only a small range of histidine 1H hyperfine values would be sampled at 170 mT (g = 4). This result is readily seen by comparing the 170 mT contour plots from the two samples (Figs. 2 and 5), where a distinct ridge at (3.5, 12.3 MHz) is observed in the TauD[taurine, 2-OG]NO sample from His-99, but the ridge is absent for the TauD[taurine]NO sample. Attempts to find evidence for this ridge in the 170 mT 1H-HYSCORE spectrum of TauD[taurine]NO using peak thresholds close to the noise floor were unsuccessful (see Fig. S4). Because this ridge dominated the 1H-HYSCORE spectra of the TauD[taurine,2-OG]NO and TauD[2-OG]NO samples, it is unlikely that NO coordinates to either of the other two open coordination sites on the metal. It is worth noting that in a recent X-ray crystallographic study of TauD with vanadyl ion substituting for Fe(II), and with both product succinate and substrate taurine bound at the active site (PDB: 6deh), a minor population of structures was found with the vanadyl oxygen opposite Asp-101 [39]. The cw-EPR spectrum of the TauD[taurine]NO adduct was best fit considering a 70/30 % mixture of species with |E|/D = 0.0163 (σE/D = 0.014) and |E|/D = 0.006 (σE/D = 0.005). Given the 1H- and 14N-HYSCORE results, and the small difference in |E|/D for these two species, they most likely represent different Fe-NO rotamers.
1H-HYSCORE spectra of the TauD[taurine]NO sample also showed cross peaks from two water ligands that occupied the open coordination sites adjacent to NO. Because the protons of these ligands are close to the Fe, they are most sensitive to the {FeNO}7 electronic structure. This sensitivity is easily shown through orientation-selective HYSCORE studies because of the method’s unique ability to distinguish proton hyperfine couplings by their dipolar contributions and their discrete orientations with respect to the magnetic axis system. To make sense of these correlations, it is best to take the dipolar couplings and orientations summarized in Table 2 and cast them into an elementary structural model for the water ligand. Specifically, a model that considers the oxygen of water to be sp3 hybridized, with the Fe-OH2 bond made through one of oxygen’s lone electron pairs. That places the ligand’s protons on the base of a cone whose dimensions are defined by the Fe-O bond length and the structure of water. Assuming that the Fe-NO bond and Fe-OH2 bonds are 90° apart (Scheme 4, top), and that the principal axis of each proton hyperfine tensor is well-approximated by its Fe-H vector, the dependence of the measured dipolar couplings can be related to the projection of the proton’s O-H bond onto the Fe-NO bond axis (Scheme 4, bottom). In this depiction, β1 and β2 are the angles of rotation about the Fe-OH2 bond that define the location of the two ligand protons and describe their projections onto the Fe-NO bond axis. For a discrete water ligand, |β1 − β2| should be in the 100 – 120° range. For the schematic drawing at the top of Scheme 4, if one takes β2 = 0° and considers H1 and the atoms of the {FeNO}7 group to all be in the same plane, dipolar couplings from the Fe, N and O to H1 are 4.4, 4.7, and 3.6 MHz, respectively. Using Eqn. 4, one determines an overall dipolar coupling of 4.5 MHz. For the other extreme, if one sets β1 = 180° and calculates dipolar distances and couplings for H2, a value of 5.7 MHz is obtained. It follows that this coupling range is sensitive to the orientation of NO with respect to the Fe-OH2 bond axis. If one rotates the Fe-NO bond by 90° in Scheme 4 (top), the range of predicted dipolar couplings shifts from 4.8 MHz (β = 0°) to 5.7 MHz for (β = 180°). Returning to the couplings and orientations measured by the 1H-HYSCORE experiments on TauD[taurine]NO (Table 2), we used the geometric relationships developed previously, to compute the corresponding rotation angles, β2 and β1, for each water ligand [25, 38]. The following correlations were found: for water 1, T1 = 4.5 MHz (β2 = 8°) and T2 = 5.3 MHz (β1 = 126°); and for water 2, T1 = 4.7 MHz (β2 = 45°) and T2 = 5.5 MHz (β1 = 160°). Clearly, there is a correlation between the measured dipolar coupling for each proton and its proximity to the NO ligand.
Scheme 4 –
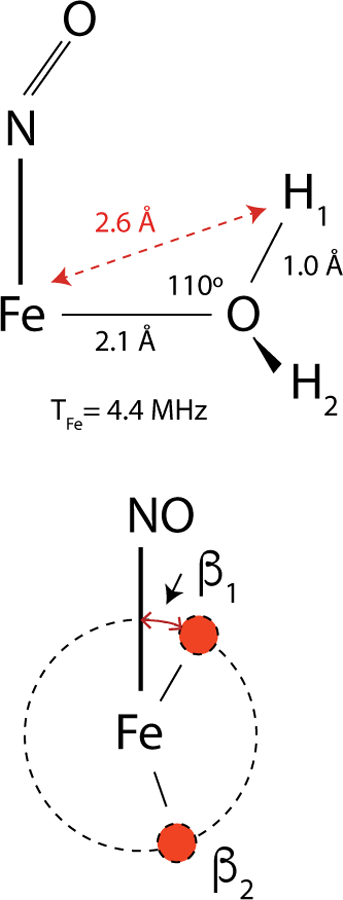
Elementary structure for water ligation. The bottom view is along the Fe-OH2 bond with the red circles representing the two hydrogen atoms.
Finally, it worth commenting on the relative intensities of the 1H cross peaks assigned to the water protons versus those of the histidine and taurine ligands. Because the water protons have a substantially larger dipolar coupling, they would be expected to show the highest cross peak intensities in the spectra collected for the TauD[taurine]NO samples. Our data show comparable cross peak intensities at higher fields as one approaches g = 2, but that the water proton cross peaks are barely resolved at 240 mT and absent from the contour plots shown for 190 and 170 mT (Fig. 5). This lack of cross peak intensity is primarily a consequence of the bandwidth of the 180° microwave pulses used in our studies, a problem that was well-characterized in the early HYSCORE literature [30, 36]. In a previous study of {FeNO}7 model complexes, we found that the cross peak intensities arising from water protons doubled when we adopted the two-channel pulsing scheme that allowed us to reduce the 180° pulse width from 32 to 16 ns. It is reasonable to assume that higher-bandwidth, shaped 180° pulses would be most beneficial to 1H-HYSCORE studies of the type presented here.
5. Summary
The cw-EPR and HYSCORE results presented in this paper have provided new information regarding the coordination of ligands at the catalytic Fe(II) site of TauD, a 2-OG dependent hydroxylase. Using TauD[taurine, 2-OG]NO, we built a foundation for relating ligand hyperfine couplings and cw-EPR speciation to structural changes at the active site. For the TauD[2-OG]NO species, our data support an alternate binding mode for the chelation of 2-OG to the metal center. For TauD[taurine]NO, an alternate binding mode for NO was determined. This complex also features two coordinated water molecules characterized by proton hyperfine couplings that are most sensitive to the electronic structure of the {FeNO}7 paramagnetic center.
Supplementary Material
Acknowledgments
We thank Meng Li who initiated these studies. J.M. would like to thank Drs. Gareth and Sandra Eaton for their support over the past 35 years.
Funding:
This work was supported by National Institutes of Health grants GM065384 (R.P.H.), GM054065 (J.M.) and RR15880 (J.M.).
Footnotes
Availability of Data and Material: The data presented in this article and the MATLAB scripts used for data analysis can be made available upon request to the corresponding author.
References
- 1.Kovaleva EG, Lipscomb JD, Nature Chemical Biology 4, 186 (2008). [DOI] [PMC free article] [PubMed] [Google Scholar]
- 2.Herr CQ, Hausinger RP, Trends Biochem. Sci 43, 517 (2018). [DOI] [PMC free article] [PubMed] [Google Scholar]
- 3.Wang Y, Li J, Liu A, J. Biol. Inorg. Chem 22, 395 (2017). [DOI] [PMC free article] [PubMed] [Google Scholar]
- 4.Hegg EL, Que L, Eur. J. Biochem 250, 625 (1997). [DOI] [PubMed] [Google Scholar]
- 5.Kal S, Que L, J. Biol. Inorg. Chem 22, 339 (2017). [DOI] [PubMed] [Google Scholar]
- 6.Salerno JC, Siedow JN, Biochim. Biophys. Acta 579, 246 (1979). [DOI] [PubMed] [Google Scholar]
- 7.Enemark JH, Feltham RD, Coord. Chem. Rev 13, 339 (1974). [Google Scholar]
- 8.Arciero DM, Lipscomb JD, Huynh BH, Kent TA, Münck E, J. Biol. Chem 258, 14981 (1983). [PubMed] [Google Scholar]
- 9.Chen VJ, Orville AM, Harpel MR, Frolik CA, Surerus KK, Münck E, Lipscomb JD, J. Biol. Chem 264, 21677 (1989). [PubMed] [Google Scholar]
- 10.Orville AM, Chen VJ, Kriauciunas A, Harpel MR, Fox BG, Münck E, Lipscomb JD, Biochemistry 31, 4602 (1992). [DOI] [PubMed] [Google Scholar]
- 11.Arciero DM, Orville AM, Lipscomb JD, J. Biol. Chem 260, 14035 (1985). [PubMed] [Google Scholar]
- 12.Arciero DM, Lipscomb JD, J. Biol. Chem 261, 2170 (1986). [PubMed] [Google Scholar]
- 13.Hoffman BM, Martinsen J, Venters RA, J. Magn. Reson 59, 110 (1984). [Google Scholar]
- 14.Hurst GC, Henderson TA, Kreilick RW, J. Am. Chem. Soc 107, 7294 (1985). [Google Scholar]
- 15.Yang TC, Wolfe MD, Nebergall MB, Mekmouche Y, Lipscomb JD, Hoffman BM, J. Am. Chem. Soc 125, 7056 (2003). [DOI] [PubMed] [Google Scholar]
- 16.Rocklin AM, Tierney DL, Kofman V, Brunhuber NM, Hoffman BM, Christoffersen RE, Reich NO, Lipscomb JD, Que L, Proc. Natl. Acad. Sci. U.S.A 96, 7905 (1999). [DOI] [PMC free article] [PubMed] [Google Scholar]
- 17.Tierney DL, Rocklin AM, Lipscomb JD, Que L, Hoffman BM, J. Am. Chem. Soc 127, 7005 (2005). [DOI] [PubMed] [Google Scholar]
- 18.Casey TM, Grzyska PK, Hausinger RP, McCracken J, J. Phys. Chem. B 117, 10384 (2013). [DOI] [PMC free article] [PubMed] [Google Scholar]
- 19.Martinie RJ, Pollock CJ, Matthews ML, Bollinger JM, Krebs C, Silakov A, Inorg. Chem 56, 13382 (2017). [DOI] [PMC free article] [PubMed] [Google Scholar]
- 20.Martinie RJ, Livada J, Chang W, Green MT, Krebs C, Bollinger JM, Silakov A, J. Am. Chem. Soc 137, 6912 (2015). [DOI] [PMC free article] [PubMed] [Google Scholar]
- 21.Krzyaniak MD, Eser BE, Ellis HR, Fitzpatrick PF, McCracken J, Biochemistry 52, 8430 (2013). [DOI] [PMC free article] [PubMed] [Google Scholar]
- 22.Brown CA, Pavlosky MA, Westre TE, Zhang Y, Hedman B, Hodgson KO, Solomon EI, J. Am. Chem. Soc 117, 715 (1995). [Google Scholar]
- 23.Ye S, Price JC, Barr EW, Green MT, Bollinger JM, Krebs C, Neese F, J. Am. Chem. Soc 132, 4739 (2010). [DOI] [PMC free article] [PubMed] [Google Scholar]
- 24.Bencini A, Gatteschi D, EPR of Exchange Coupled Systems (Springer - Verlag, Berlin, 1990). [Google Scholar]
- 25.McCracken J, Eser BE, Mannikko D, Krzyaniak MD, Fitzpatrick PF, Biochemistry 54, 3759 (2015). [DOI] [PubMed] [Google Scholar]
- 26.Hausinger RP, in 2-Oxoglutarate-Dependent Oxygenases, ed. by Hausinger RP and Schofield CJ (Royal Society of Chemistry, London, 2015) p. 1–58. [Google Scholar]
- 27.Hanauske-Abel HM, Günzler V, Journal of Theoretical Biology 94, 421 (1982). [DOI] [PubMed] [Google Scholar]
- 28.Bollinger JM, Chang W, Matthews ML, Martinie RJ, Boal AK, Krebs C, in 2-Oxoglutarate-Dependent Oxygenases, ed. by Hausinger RP and Schofield CJ (Royal Society of Chemistry, London, 2015), p. 95–123. [Google Scholar]
- 29.Elkins JM, Ryle MJ, Clifton IJ, Hotopp JCD, Lloyd JS, Burzlaff NI, Baldwin JE, Hausinger RP, Roach PL, Biochemistry 41, 5185 (2002). [DOI] [PubMed] [Google Scholar]
- 30.Shane JJ, Höfer P, Reijerse EJ, de Boer E, J. Magn. Reson 99, 596 (1992). [Google Scholar]
- 31.Gemperle C, Aebli G, Schweiger A, Ernst RR, J. Magn. Reson 88, 241 (1990). [Google Scholar]
- 32.Stoll S, Schweiger A, J. Magn. Reson 178, 42 (2006). [DOI] [PubMed] [Google Scholar]
- 33.Brown CD, Neidig ML, Neibergall MB, Lipscomb JD, Solomon EI, J. Am. Chem. Soc 129, 7427 (2007). [DOI] [PMC free article] [PubMed] [Google Scholar]
- 34.Stoll S, Britt RD, Phys. Chem. Chem. Phys 11, 6614 (2009). [DOI] [PubMed] [Google Scholar]
- 35.Aquino F, Rodriguez JH, J. Phys. Chem. A 113, 9150 (2009). [DOI] [PubMed] [Google Scholar]
- 36.Schweiger A, Jeschke G, Principles of Pulse Electron Paramagnetic Resonance (Oxford University Press, Oxford, 2001). [Google Scholar]
- 37.Pöppl A, Kevan L, J. Phys. Chem 100, 3387 (1996). [Google Scholar]
- 38.McCracken J, Cappillino PJ, McNally JS, Howart M, Krzyaniak MD, Caradonna JP, Inorg. Chem 54, 6486 (2015). [DOI] [PubMed] [Google Scholar]
- 39.Davis KM, Altmyer M, Martinie RJ, Schaperdoth I, Krebs C, Bollinger JM, Boal AK, Biochemistry 58, 4218 (2019). [DOI] [PMC free article] [PubMed] [Google Scholar]
Associated Data
This section collects any data citations, data availability statements, or supplementary materials included in this article.


