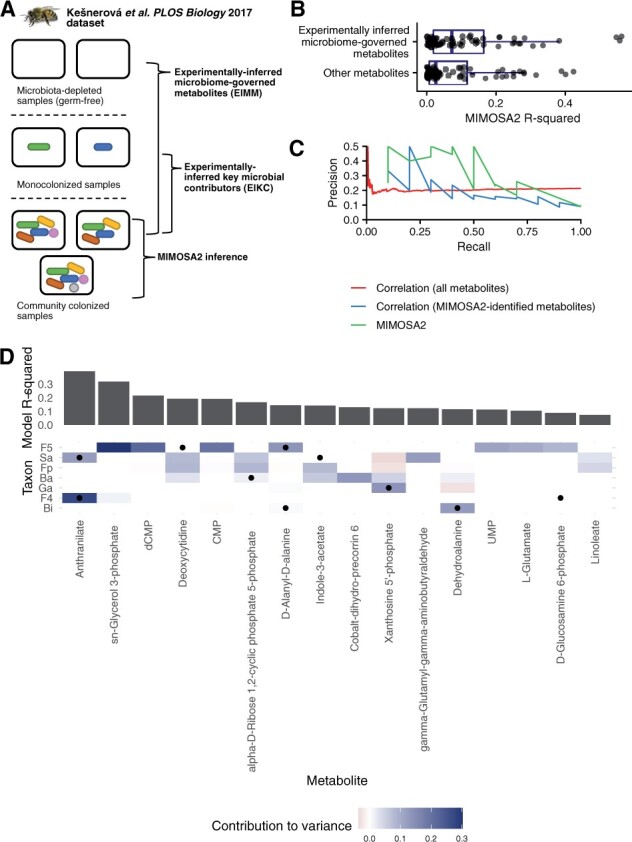
Fig. 5.

Partial overlap between MIMOSA2 results and experimental inferences in honeybee gut microbiota. (A) Summary of experiments from Kešnerová et al. (2017) reanalyzed here. MIMOSA2 was applied to a dataset of 18 samples from community-colonized bees, and its results were compared with inferences from metabolomics of microbiota-depleted (germ-free) bees and bees monocolonized with individual bacterial strains. (B) Experimentally inferred microbial metabolites in 11-strain communities are significantly better predicted by MIMOSA2 than other metabolites. (C) MIMOSA2 identifies experimentally inferred microbial contributors with higher precision and recall than microbe–metabolite correlation analysis. (D) Metabolite-level comparison of experimentally inferred and MIMOSA2-inferred microbial key contributors. Cell color indicates a microbe’s contribution to variance in a metabolite as inferred by MIMOSA2; black dots indicate experimentally inferred contributors based on metabolomics of monocolonized samples. Metabolites shown are microbiome-governed as determined by the MIMOSA2 model. Ba, Bartonella apis; Bi, Bifidobacterium asteroides; F4, Lactobacillus Firm-4; F5, Lactobacillus Firm-5; Fp, Frischella perrara; Ga, Gilliamella apicola; Sa, Snodgrassella alvi
