

Abstract
Mechanical properties, size and geometry of cells, and internal turgor pressure greatly influence cell morphogenesis. Computational models of cell growth require values for wall elastic modulus and turgor pressure, but very few experiments have been designed to validate the results using measurements that deform the entire thickness of the cell wall. New wall material is synthesized at the inner surface of the cell such that full-thickness deformations are needed to quantify relevant changes associated with cell development. Here, we present an integrated, experimental–computational approach to analyze quantitatively the variation of elastic bending behavior in the primary cell wall of living Arabidopsis (Arabidopsis thaliana) pavement cells and to measure turgor pressure within cells under different osmotic conditions. This approach used laser scanning confocal microscopy to measure the 3D geometry of single pavement cells and indentation experiments to probe the local mechanical responses across the periclinal wall. The experimental results were matched iteratively using a finite element model of the experiment to determine the local mechanical properties and turgor pressure. The resulting modulus distribution along the periclinal wall was nonuniform across the leaf cells studied. These results were consistent with the characteristics of plant cell walls which have a heterogeneous organization. The results and model allowed the magnitude and orientation of cell wall stress to be predicted quantitatively. The methods also serve as a reference for future work to analyze the morphogenetic behaviors of plant cells in terms of the heterogeneity and anisotropy of cell walls.
The combined experimental and computational protocol described allows the elastic modulus and turgor pressure of living Arabidopsis epidermis cells to be quantified using deformations that bend the entire thickness of the wall.
Introduction
The plant leaf epidermis consists of a single layer of cells that adhere to one another through their middle lamella. Many species have jigsaw puzzle-piece-shaped cells and grow with an interdigitated growth pattern (Panteris and Galatis, 2005; Vőfély et al., 2019; Belteton et al., 2021). This behavior is attributed to the anisotropic enlargement of cells as they expand (Panteris and Galatis, 2005; Szymanski, 2014). The formation of this patterning has attracted much attention in order to discover the fundamental mechanisms that govern the cell shapes. Mechanical properties, especially the cell wall elastic modulus and their spatial organization are clearly important because these properties govern the material response to applied forces (Cosgrove, 1993; Sampathkumar et al., 2014; Majda et al., 2017; Sapala et al., 2018; Bidhendi et al., 2019). In some cases, a qualitative analysis is sufficient to uncover trends in cell growth. However, quantitative information about the stresses and strains in the cell walls is critical if growth mechanisms are to be translated temporally and across different species. Computational models are critical to such analyses because they can provide potential mechanisms that can be explored experimentally. Quantitative knowledge of the wall elastic modulus tensor is especially critical because it provides the connection between the wall stresses and strains. Erroneous conclusions about growth mechanisms may result if computational models are not based on accurate material behavior. As a result, it is necessary to develop a reliable approach to measure the cell wall mechanical properties and turgor pressure in these living systems.
An example of pavement cell lobing is illustrated in Figure 1, A–C in which a single cell is tracked temporally (9.5 h) in order to quantify the space-time characteristics of the lobing wall indicated by the arrows (see Belteton et al., 2021 for details about imaging and more examples). Although many features for this cell appear self-similar (only larger), the forming lobes become deeper with a spatial variability that is difficult to predict from the initial state. Many efforts have been made to understand the biomechanics behind this type of patterning which is an integral part of morphogenesis (Cosgrove, 1993; Sampathkumar et al., 2014; Majda et al., 2017; Sapala et al., 2018; Bidhendi et al., 2019; Lin and Yang, 2020; Belteton et al., 2021).
Figure 1.

Heterogeneous growth and example FE analysis showing the impact of cell wall modulus. A–C, Morphogenesis of lobe features detected during time-lapsed imaging, lobe locations are indicated with yellow and pink arrows, and the time intervals in hours are shown. Insets in (A) show the y–z (right) and x–z (below) views of the same cell to reveal the outer periclinal and anticlinal walls. Scale bar for (A–C) = 10 µm. D–E, FE analysis is conducted for the same cell in (A) using two values of uniform cell wall modulus (wall thickness = 300 nm; turgor pressure = 0.6 MPa). Cross-sectional views of the y–z and x–z planes from the FE results are shown for comparison with the experiments.
Computational models are often used for such studies, but there is little agreement in the literature regarding the appropriate mechanical properties that should be used in the models. The impact of the modulus value on the wall deformation behavior is illustrated in Figure 1, D and E. The cell shown in Figure 1A is modeled using the finite element (FE) method (details later and in “Materials and methods”) using two different values for the elastic modulus of the periclinal wall with all other properties constant (thickness = 300 nm; turgor pressure = 0.6 MPa). In Figure 1D, with a modulus of 300 MPa, the periclinal wall has a maximum height of ∼3.5 μm and the maximum is centered within the cell. In this case, the out-of-plane maximum height is similar to the microscopy results. If the value of the modulus is decreased by a factor of 10 (30 MPa), as shown in Figure 1E, the height is considerably larger (∼14.1 μm), and is well above the height typically observed for pavement cells. The cross-sections of the periclinal wall for the cell and model, shown at the positions of the dashed lines, are also revealing. The x–z microscopy profile of the cell shows a maximum that is not centered between the two anticlinal walls in contrast to the y–z profile which has a centered maximum. Both profiles from the model have a centered maximum suggesting that the uniform, isotropic properties, or boundary conditions used in the model may be too simplistic. This comparison of simulated cell wall deformation under turgor pressure using different orders of magnitude of cell wall modulus motivates the objective of this article: To map the spatial variability of the periclinal wall and turgor pressure quantitatively using a measurement-modeling approach based on indentations that deform the entire thickness of the wall and the initial periclinal wall height. Variations of both modulus and turgor pressure have been studied previously and an overview of that work is important for context.
The possibility of a nonuniform distribution of cell wall mechanical properties has been considered by others (Szymanski and Cosgrove, 2009; Sampathkumar et al., 2014; Majda et al., 2017; Altartouri et al., 2019; Bidhendi et al., 2019; Hamant et al., 2019; Belteton et al., 2021). The connection between anisotropic growth and such a spatial variability is difficult to define quantitatively due to a lack of experimental data that engage the full thickness of the cell wall. As discussed previously (Cosgrove, 2016), atomic force microscope (AFM) measurements on the outer surface of cell walls often use forces that compress only the outer portion of the wall. Thus, such measurements may not be sensitive to material behavior closer to the interior wall surface. As cells grow, new wall material is synthesized from the inside of the cell. Therefore, changes to wall properties are expected from the inside, and measurements that are sensitive to this portion of the wall are needed to capture changes during growth. The ability to quantify and to map the mechanical properties spatially across individual cells can provide the information needed for models that are used to establish the relations between stress patterns and growth (e.g. Belteton et al., 2021).
There have been many attempts to characterize the mechanical properties of plant epidermal cell walls directly, including tensile tests of artificial composites (Chanliaud et al., 2002), micro-testing of peeled/cut leaf samples (Hiller et al., 1996; Zamil et al., 2015), AFM measurements (Peaucelle, 2014; Sampathkumar et al., 2014; Beauzamy et al., 2015; Carter et al., 2017; Long et al., 2020), and micro/nanoindentation measurements (Hayot et al., 2012; Forouzesh et al., 2013; Weber et al., 2015; Malgat et al., 2016). These different approaches have resulted in a very wide range of cell wall elastic moduli, from 1 MPa (Majda et al., 2017), ∼10 MPa (Sampathkumar et al., 2014), to hundreds of megapascal (Forouzesh et al., 2013; Malgat et al., 2016). Some differences in properties are expected due to the influence of plant age, cell type, and environmental factors. In addition, the organization of the wall is such that the length scale and the time scale of each measurement play a role in the outcome (Cosgrove, 2016). For example, an AFM tip with contact radius on the order of tens of nanometers will engage a volume of material less than ∼1 μm3, while micro/nanoindentation measurements use larger tips such that the contact radius is a few micrometers. Instrumented indentation testing (IIT), also called nanoindentation (Fischer-Cripps, 2011), can engage bending of the full wall thickness of leaf epidermal cells. Variations within a single cell, as determined from measurements of wall bending, would indicate possible organizational heterogeneity in the cell wall constituents—a substantive advance from current knowledge.
Turgor pressure is often thought to be uniform in all cells in a given leaf because of the presence of plasmodesmata throughout the tissue (Belteton et al., 2021) which suggests that ion concentrations among cells would be in equilibrium. However, few studies have investigated spatial variations quantitatively. Recently, Long et al. (2020) suggested that turgor pressure could vary between the cells of the shoot apical meristem of Arabidopsis. Thus, it also is plausible that differential pressure may exist among pavement cells that can influence the formation of puzzle-shaped cells when combined with the effect of nonuniform mechanical properties. The presence of turgor pressure is a challenge for characterization of mechanical properties of the cell wall due to the coupling effect of the mechanical response when the cell walls are loaded sufficiently. Plasmolysis is the most accepted method for measuring turgor pressure. However, many other methods have been proposed including micro/nanoindentation (Forouzesh et al., 2013; Weber et al., 2015; Malgat et al., 2016), probe contact (Lintilhac et al., 2000), pressure chamber (Tyree and Hammel, 1972), and the pressure probe (Wang et al., 2006). Unfortunately, the sizes of cells, cell geometry, and cell topography can limit the viability of some methods for all plant species, especially if a nondestructive approach is needed.
In this article, an iterative experimental–computational approach is used in which IIT and laser scanning confocal microscope (LSCM) measurements are combined with an FE model of the IIT experiments to quantify the local mechanical properties of periclinal cell walls and turgor pressure of Arabidopsis. High-resolution imaging is used to position the IIT experiments, such that several measurements can be made over the surface of the periclinal wall of the cell. The 3D topography of the same cell is also mapped with LSCM for two purposes. The cell outline is used to create the boundaries for the FE model. More importantly, the cell height profile is clearly an important aspect of the response (see Figure 1). Therefore, the height information is used together with the IIT measurement data to determine the turgor pressure and wall modulus. Our previous IIT research on plant cells (Forouzesh et al., 2013) did not use high-resolution imaging, nor was the precise cell geometry (cell shape and cell height) used for analysis of the experimental data. With these mechanical and geometric measurements, the elastic modulus and the associated turgor pressure at each indentation position along the periclinal wall are estimated in an iterative manner using the computational model. Turgor pressure estimates are validated using the same approach for a cell under different osmotic conditions to observe the associated changes. A sensitivity study is used to quantify the impact of assumptions used in the FE model. This article describes an important breakthrough technology to map the subcellular distribution of mechanical properties of the periclinal wall nondestructively using deformations that engage the entire thickness of the cell wall.
Results
The approach used two types of measurements, as shown in Figure 2, which provides an overview of the approach (see “Materials and methods” for more details). True leaves (usually leaf 5, 6, or 7) were mounted (Figure 2A) such that the abaxial surface was exposed for the measurements. From the LSCM (Figure 2, B and D), cell shape and the height of the pavement cell periclinal wall (e.g. ∼3 μm) were measured (0.5 nm z-resolution) relative to the average height of the surrounding anticlinal wall (Figure 2D). The sample was then moved immediately to the IIT stage, and the same cell was identified with the optical microscope of the IIT instrument (Figure 2, C and E). Several measurements were made along the cell using the load function (Figure 2F) developed previously (Forouzesh et al., 2013) that included several short unloading segments at different depths. The white circles in Figure 2E indicate the approximate contact area for each measurement. The shallow indentations were expected to be influenced mostly by the cell wall compression (Cosgrove, 2016), while deeper indentations reflected a combination of the wall bending stiffness and turgor pressure. General IIT guidelines (Fischer-Cripps, 2011) suggest that indentation depths <10% of the sample thickness will be insensitive to any “substrate effect” which here refers to the turgor pressure. The minimum depth used here was estimated to be one-fourth to one-third of the thickness of the wall which means that the turgor pressure will have some effect on the measured response for all measurements. The test positions were selected along the ridge of each cell near its maximum height for two primary reasons. First, measurements made along the cell plateau minimized the influence of the boundary conditions at the anticlinal walls which were not known fully. Second, the ridge positions were primarily flat which minimized potential horizontal loads on the indenter tip to improve the reliability of the measurements. From each resulting force–displacement measurement (Figure 2G), the local stiffness values (Figure 2G inset) were determined. In all measurements, the local stiffness showed an overall increase with indentation depth (Figure 2H).
Figure 2.

Geometric and mechanical characterization for turgid pavement cells in air. A–C, Experimental setup. The leaf was glued on a support to expose the abaxial surface which was used for LSCM and IIT (i.e. nanoindentation) experiments sequentially. D, Topography of a pavement cell measured using LSCM. The black points on the anticlinal wall were used for calculating the average height as a reference, and the points on the periclinal wall (also shown in (E)) denote the positions of cell height measured relative to the reference. Two cross-sections (A–A and B–B) show the measured height variation across this cell. E, Optical view of a pavement cell using the 50X objective of the indentation instrument. The white circles indicate the approximate size of the contact area during the measurements. F, Input load function for the IIT experiments with a loading rate of 100 nm/s. G, Example measured force as a function of displacement and the associated stiffness. The stiffness is the slope of the unloading ramp and is used to determine the elastic modulus and turgor pressure. H, Stiffness at different depths at position P-7 shown in (E). Error bar type is standard error (SE). Error is based on the uncertainty in the slope as shown in the inset of Figure 2G. The number of points is variable. Scale bar for (D) and (E) = 10 μm.
The stiffness values at all depths and the overall height of the periclinal wall were matched iteratively using an FE model of the IIT experiment to find the turgor pressure and local wall modulus (a Supplemental Movie S1 of an IIT simulation is included). The measured cell boundary was used to create the cell model. The nanoindenter tip was measured and rendered within the FE software (additional details in “Materials and methods”; Supplemental Figures S1 and S2) in order to represent the experiments as closely as possible (additional data and model values are shown in Supplemental Figures S3 and S4). It should be noted that the modulus estimated with the model was that of the undeformed material state. Thus, local changes in measured stiffness due to wall tension were accounted for in the model. FE models have been used previously to analyze lobe initiation in cotyledon pavement cells (Belteton et al., 2021). Transmission electron microscopy (TEM) data from those cells (Figure 3, A–C) gave a thickness of 280 ± 14 nm. TEM from true leaves (Forouzesh et al., 2013) showed a thicker periclinal wall in the range of 400–600 nm depending on distance from the anticlinal wall (thinner near the cell center). Based on these studies, 400 nm was used here for the FE models. A sensitivity study (below) shows the impact of this assumption.
Figure 3.

Details of the geometry and the role of neighboring cells on the mechanical response from indentation. A–C, TEM images show the cross-section of Arabidopsis cotyledon pavement cells (scale bar = 5 μm). The circles and green lines in (B) and (C) indicate the spacing and measurements of the cell wall thickness along the cell wall contour, respectively. The average thicknesses of the periclinal and anticlinal walls shown are 280 ± 14 nm and 35 ± 10 nm, respectively. Error type is standard deviation (SD). Periclinal wall result based on 21 positions; anticlinal wall result based on 10 positions. D, FE model of a single pavement cell. E, Three cell structural models. F, FE model with two layers of cells. The cells at the bottom are assumed to be the same as the associated epidermal cells with an intermediate cell wall thickness of 50 nm. Simulations of IIT are performed, respectively, at the edge (4 μm away; blue circle) and the central position (red circle) for all three models. G and H, Force curve and stiffness at different depths of the computational indentation results at the edge position on a cell. I and J, Computational indentation results at the central position of the cell. Note that the measurements used for the main results were limited to a maximum indentation depth of 1,500 nm.
In the FE model, the surrounding anticlinal walls of the cell of interest were constrained on the outside by a stiff isotropic matrix to approximate the boundary conditions within the leaf. To understand the influence of surrounding cells, a set of expanded models was used as shown in Figure 3, D–J. These models provided a comparison between the IIT simulations for three cases: a single cell embedded in a matrix (Figure 3D), a single layer of cells with neighboring cells (Figure 3E), and a model with two layers of multiple cells (Figure 3F). The influence of neighboring cells was most important for indentations near the boundary of the cell (Figure 3, G and H) because the anticlinal wall became engaged during the deformation which resulted in an increase of the force needed to deform the wall. These differences were important only for large indentation depths (>2,000 nm). However, for indentation positions near the maximum of the periclinal wall (central position Figure 3, I and J), the neighboring cells had a negligible effect. Therefore, the influence of neighboring cells at the maximum depth used in the IIT experiments (≤1,500 nm) was expected to be minimal (<5%). The addition of a layer of cells below the epidermal cells also had little impact on the deformations at the central position of the cell (Figure 3, I and J). The deflection of the cell wall during the measurements would result in a decrease of the interior volume and a corresponding increase of pressure. The maximum percentage change in the volume was estimated to be <0.7% for the indentation depth of 1,500 nm (Supplemental Figure S5). These analyses were used to provide a reference to determine the experimental parameters of the approach in order to measure and evaluate the cell wall mechanical properties and turgor pressure accurately.
Mechanical response variability
Measurements from four pavement cells were evaluated using the iterative calculation based on the FE model (Supplemental Figure S2B). The local wall modulus and the associated turgor pressure at each indentation position of the periclinal wall were determined in order to match the geometric (i.e. out-of-plane periclinal wall deformation) and IIT mechanical measurements (results for all cells studied are shown in Supplemental Figure S3; see Supplemental Figure S4 for example comparisons between the final model result and the experimental data for the cell shown in Figure 2). Results for the four cells are shown in Figure 4. Deviations between the measurements and model results after iteration were very good and were ˂20% on average (see Supplemental Table S1 for all results). The local elastic modulus across these cell walls showed a variation from 200 to 800 MPa. Materials in several constricted regions were stiffer, but no clear trend was observed based on these measurements. For example, cell 1 (Figure 4, A–C) had moduli for positions P-1, P-2, and P-7 that were much higher than the rest (500–750 MPa), but other positions within constrictions had moduli closer to 400 MPa (positions P-8, P-9, and P-10). For cell 2 (Figure 4, D–F), positions P-4–6 had moduli >450 MPa, while other positions were ˂400 MPa. For cell 4 (Figure 4, J–L), moduli in one constricted region (positions P-4 and P-5) were about half of the maximum >600 MPa at position P-2 which was more central.
Figure 4.

Wall modulus and turgor pressure results using the experimental–computational approach for four different cells. A–C, D–F, G–I, and J–L, Elastic modulus and turgor pressure estimated for each indentation position of the cell walls of four leaf cells. The horizontal axis represents the indentation position, as shown in I, (F), (I), and (L). Scale bar for all images = 10 μm. The uncertainty in the plots is estimated by considering the uncertainties in the measured height and stiffness data as shown for the first cell in Figure 2, D and H. Error bar type is standard error (se). Error is based on the uncertainty in the slope as shown in the inset of Figure 2G and the uncertainty of the model parameters.
On the contrary, the turgor pressure estimated at each position in the cell was relatively uniform for each cell as expected (Figure 4, B, E, H, and K). However, turgor pressure varied from 0.52 to 0.96 MPa for these four cells which were from different leaf samples, likely reflecting a variable water status for each leaf. Depending on the cell shape, size, and the growth conditions of the plants, the turgor pressure in most leaf pavement cells at the status of the experiments here was expected to be on the order of 1 MPa (Forouzesh et al., 2013; Beauzamy et al., 2014) and our results were consistent.
Modulus variation is governed by more than cell geometry alone
The elastic modulus data for the four cells (Figure 4, A, D, G, and J) showed that the mechanical response at each indentation position along the ridge of the periclinal wall had substantial variability. The detailed measurement results for one cell (Figure 4, A–C) are shown in Figure 5A. These differences reflect the combined influence of wall properties and cell geometry. To study the effect of cell geometry alone on the measured mechanical response, an FE model was created using uniform mechanical properties across the periclinal wall (Figure 5B). The mechanical response in the constricted region between two cell ingrowths was stiffer than that of other positions (Figure 5C) due to the decreased distance between the sections of deformation. Additionally, the analysis showed that most material in the constricted regions had a similar mechanical response (P-2, P-3, and P-7 in Figure 5C). This type of geometric effect on the mechanical response of the periclinal wall was expected. However, a comparison of the model response with the IIT measurements, showed that cell geometry alone could not explain the different responses for the five positions shown in Figure 5A. For example, the measurement at position P-7 was much stiffer than positions P-2 and P-3 which showed the same response in the model when uniform properties were assumed. As another example, the model with uniform properties predicted that positions P-1 and P-10 would have a similar indentation response (Figure 5C). On the contrary, the measured behavior (Figure 5A) at these two positions showed differences in the maximum force of ∼15%. Thus, the mechanical properties of the periclinal wall are clearly not uniform.
Figure 5.
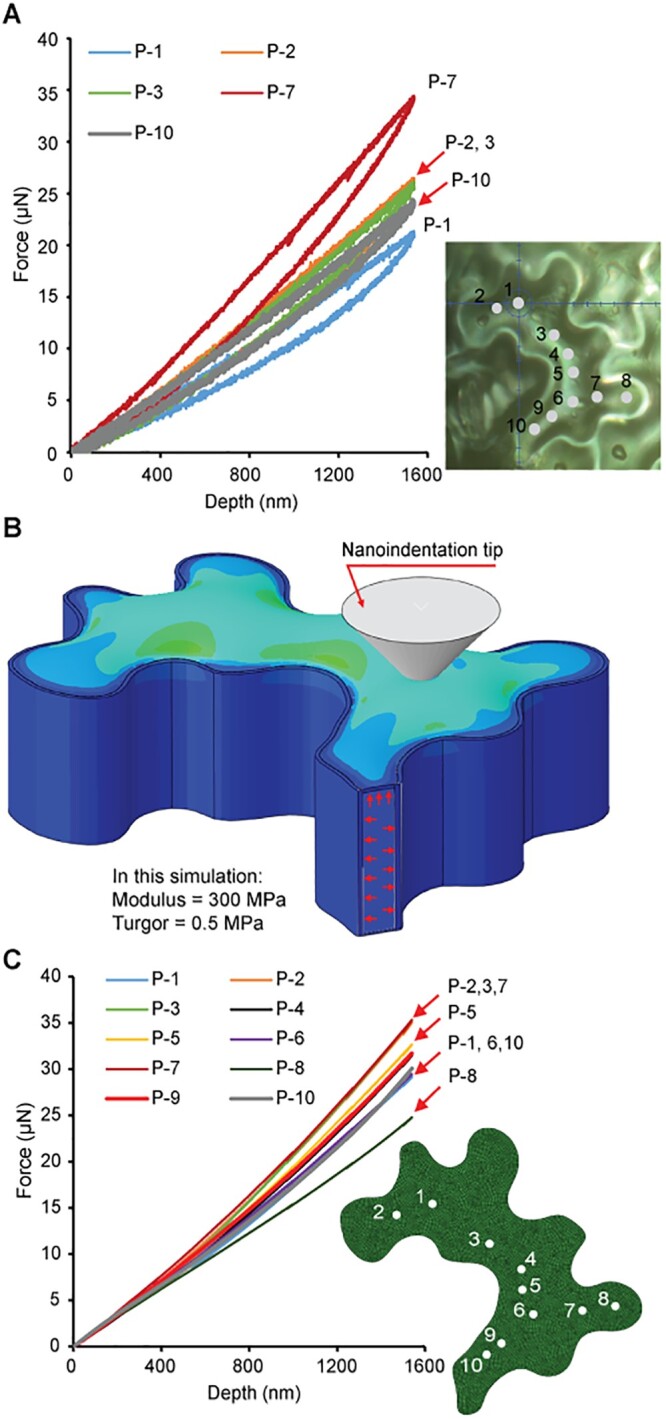
Influence of the cell geometry alone on the mechanical response. A, Measured indentation force as a function of displacement (five results shown here; all ten results are shown in Supplemental Figure S3B). B, FE model of the indentation experiments assuming uniform wall properties (modulus = 300 MPa; turgor pressure = 0.5 MPa). The diameter of contact from the probe is ∼3 μm at the deepest position (see Supplemental Figure S5C). C, Indentation forces calculated using the FE model of the IIT experiment. A movie of the simulation is included in the Supplemental Material (Supplemental Movie S1).
Mechanical response for different osmotic conditions
The turgor pressure values were validated using the same measurement approach on an additional cell subjected to different osmotic conditions. Mannitol solution treatments (Figure 6A; “Materials and methods”) were used to manipulate the turgor pressure in the cell (Lucas and Alexander, 1981). As the concentration of the solution increased up to 0.9 MPa solute potential, the relative height of the periclinal wall was relatively constant with a slight trend downward (Figure 6, B and C). The height decreased dramatically above a solute potential of 1.2 MPa. Optical images of the cell at different stages are shown in Supplemental Figure S6. As expected, the IIT experiments showed the effect of a decrease in turgor pressure. The mechanical force needed to achieve the same indentation depth decreased (Figure 6E), but after a solute potential of 0.9 MPa was reached, the mechanical response no longer changed for higher solute potentials. The highest concentration solution (1.5 MPa) greatly modified the surface quality of the cell, such that IIT experiments could not be conducted due to the difficulty of cell identification.
Figure 6.

Geometric and mechanical characterization of the periclinal cell wall for different osmotic conditions. A, Experiment setup. The leaf was glued on a support with the abaxial surface exposed and then was immersed in different concentrations of D-mannitol solution. B, Height measurement of the periclinal wall. The green points on the anticlinal wall are used for calculating the average boundary height as a reference, the red points are the positions of cell height measured relative to this reference, and the three purple points (P-3, P-4, and P-5) are the positions used for IIT under different osmotic conditions. Scale bar = 10 μm. C, Relative height of the periclinal wall as a function of solute potential. Error bar type is sd. D, Indentation force versus displacement across the periclinal wall at the initial stage before mannitol treatment. E, Indentation force versus displacement for position P-4 for different mannitol treatments.
At each stage of the solution treatment, IIT measurements were made only at positions P-3, P-4, and P-5 in order to decrease the overall measurement time for each stage of treatment. As a result, estimated changes in turgor pressure and modulus were made only at these positions (all measurement data are shown in Supplemental Figure S7). Figure 7A shows that turgor pressure in the pavement cell dropped with increasing concentration of the mannitol solution. The turgor pressure for this cell at the initial stage was estimated to be 0.8 MPa, and the reduction in turgor pressure agreed well with the difference of solute potential between the first two treatments. For the remaining treatments, the pressure decreased nonlinearly until dropping to the range of 0.1–0.2 MPa at the associated solute potentials of 0.9 and 1.2 MPa. This minimum value of the turgor pressure from the IIT measurements was on the order of the measured variation in the turgid cells. The distribution of elastic modulus along the periclinal cell wall (Figure 7B) was nonuniform with a range of elastic modulus from 200 to 700 MPa, a variation similar to that of other cells (Figure 4). However, the local elastic modulus decreased by 15% at the measurement positions (P-3, P-4, and P-5) for the first two solution treatments. For higher solution concentrations, the elastic modulus of the cell wall appeared to decrease further although these data are insufficient to make any strong conclusions.
Figure 7.

Results using the experimental–computational method for a pavement cell under different osmotic conditions. A, Turgor pressure in the cell estimated at each indentation position for different mannitol solution treatments. B, Elastic modulus of the cell wall at each indentation position as a function of solute potential treatment.
Measurement sensitivity
A parametric sensitivity study was conducted using the FE model to quantify the impact of the fixed parameters on the resulting unknown parameters that were determined from the iterative computations. The base parameters from this study are given in Table 1 (see Supplemental Material for more details of the material model). The estimates of turgor pressure and elastic modulus were determined for a range of the fixed parameters (wall thickness, relaxation time, Gi/G0 ratio, and Poisson’s ratio) to quantify the variations (Tables 2–6). The experimental result from position P-6 of the cell shown in Figures 2 and 4, and Supplemental Figure S5, A–C was used for this study. The wall thickness (Table 2) has the most impact on the results (21.2% variation of turgor pressure; 126% variation of modulus) for a wide thickness range of 200–600 nm. If the thickness range was limited to a range of 300–500 nm, the resulting variations decreased to 12.3% and 53.0% for the turgor pressure and modulus, respectively. With respect to a relaxation time range of 3–12 s (Tables 3 and 4), the impact on the property estimates was negligible (5.36% variation of turgor pressure; 3.42% variation of modulus) possibly due to the loading rate used for the measurements (100 nm/s; see Figure 2F). A very wide range of the Gi/G0 ratio from 0.05 to 0.5 (Table 5) resulted in a moderate impact on the property estimates (30.4% variation of turgor pressure; 27.4% variation of modulus). Finally, a reduction of Poisson’s ratio from 0.47 to 0.4 (Table 6), had a small effect on the estimated turgor pressure (1.53%) but increased the modulus estimate by 15.3%. Based on these results, the turgor pressure estimates in comparison with the plasmolysis measurements were within the range of the sensitivity study which is encouraging. Clearly, confidence in the modulus estimate requires accurate thickness information, but such measurements are difficult in vivo at the precise location of the IIT measurements given that wall thickness is on the order of hundreds of nanometers.
Table 1.
Base parameters used in the FE sensitivity study to quantify the influence on the estimated values of modulus and turgor pressure
| Parameters | Value | Physical Meaning |
|---|---|---|
| ν | 0.47 | Poisson’s ratio |
| τ 1 (s) | 6.88 | Relaxation time |
| G 1 (MPa) | 12.6 | Shear modulus associated with the wall matrix |
| t (nm) | 400 | Periclinal wall thickness |
| G 0 | Unknown | Initial elastic shear modulus |
| Turgor pressure | Unknown | Internal pressure in cells |
Table 2.
Variation of the estimated turgor pressure and modulus with respect to cell wall thickness based on Cell 1, position P-6 (Figure 4, A–C) with Gi/G0 = 0.125
| Wall Thickness (nm) | Estimated Turgor Pressure (MPa) | Estimated Elastic Tensile Modulus (MPa) |
|---|---|---|
| 200 | 0.67 | 552.7 |
| 300 | 0.66 | 370.4 |
| 400 | 0.65 | 288.1 |
| 500 | 0.58 | 217.6 |
| 600 | 0.53 | 188.2 |
All other parameters were fixed with values shown in Table 1.
Table 3.
Variation of estimated turgor pressure and modulus with respect to relaxation time based on Cell 1, position P-6 (Figure 4, A–C) with Gi/G0 = 0.125
| Relaxation Time (s) | Estimated Turgor Pressure (MPa) | Estimated Elastic Tensile Modulus (MPa) |
|---|---|---|
| 3 | 0.64 | 285.2 |
| 6.88 | 0.65 | 288.1 |
| 12 | 0.66 | 291.1 |
All other parameters were fixed with values shown in Table 1.
Table 4.
Variation of estimated turgor pressure and modulus with respect to relaxation time based on Cell 1, position P-6 (Figure 4, A–C) with Gi/G0 = 0.3
| Relaxation Time (s) | Estimated Turgor Pressure (MPa) | Estimated Elastic Tensile Modulus (MPa) |
|---|---|---|
| 3 | 0.55 | 341.0 |
| 6.88 | 0.56 | 343.4 |
| 12 | 0.58 | 352.8 |
All other parameters were fixed with values shown in Table 1.
Table 5.
Variation of estimated turgor pressure and modulus with respect to Gi/G0 ratio based on Cell 1, position P-6 (Figure 4, A–C)
| Ratio Gi/G0 | Estimated Turgor Pressure (MPa) | Estimated Elastic Tensile Modulus (MPa) |
|---|---|---|
| 0.05 | 0.65 | 287.1 |
| 0.125 | 0.65 | 288.1 |
| 0.3 | 0.56 | 343.4 |
| 0.5 | 0.48 | 381.0 |
All other parameters were fixed with values shown in Table 1.
Discussion
The integrated experimental–computational approach described here used both optical (LSCM) and IIT measurements. This combination allowed the outer periclinal wall contour and data from several force–displacement measurements to be used in the model. The iterative approach provided local values of wall modulus and turgor pressure. The results showed that the elastic modulus varied at different positions across each cell although the turgor pressure values were very uniform. The FE simulations of the measurements with uniform cell wall properties showed that cell geometry alone cannot explain the measured variations. The cells studied were from relatively mature leaves (22–28 d after germination) such that they were likely fully lobed. Thus, the variation in modulus must have occurred during the growth process which is counter to models for cell lobing control based solely on geometry (Sapala et al., 2018). Previous results (Sampathkumar et al., 2014) reported enhanced stiffness in the convex region of lobes, but their AFM protocol did not deform the periclinal wall to the extent used here (our IIT measurements used a maximum load of 40 μN, which was 40 times the load used in Sampathkumar et al. (2014)). Our results show that the convex regions may not be stiffer than other positions. Firm conclusions cannot be drawn based on the limited number of measurements, but variability among convex regions is expected due to the highly variable microtubule organizations observed in these regions (Belteton et al., 2018; Wong et al., 2019). It is possible that the mechanical behavior of the periclinal wall exhibits a gradient of properties through the thickness such that both types of measurements (AFM and IIT) are consistent.
Pavement cell expansion during growth is known to occur nonuniformly based on measurements of cell wall deformation using time-lapsed quantification of cell shape (Zhang et al., 2011; Wu et al., 2016) and microbeads to measure local growth behavior (Armour et al., 2015; Elsner et al., 2018). Different cells also grow at different rates and single cells often have walls that each expand at different rates (Belteton et al., 2021). Cell enlargement is related to the change in strain of the periclinal wall and anticlinal walls, and nonuniform growth must have a nonuniform strain distribution across the cell walls. A clear understanding of the distribution of material properties within single cells is needed for robust growth models. The properties may change over time and the approach described here has the potential to quantify and track such changes.
The range of the elastic modulus of the periclinal wall of Arabidopsis pavement cells varied from 200 to 800 MPa, and this range is consistent with previous results based on IIT (Forouzesh et al., 2013). The model of each IIT measurement was based on a uniform periclinal wall so the results are limited by this assumption. However, future models could be developed with spatially varying properties in order to match all measurements (position and depth) simultaneously. Though not trivial, such a model would likely to be more realistic. The sensitivity study for the modulus estimate based on a uniform thickness (Table 2) showed that variations of cell wall thickness could play a role in the outcome. Prior TEM measurements (Forouzesh et al., 2013) showed a variation with respect to position on the periclinal wall with an increase of thickness near anticlinal walls. Variations on the order of 100 nm (25%) could affect the modulus estimates by ∼50%. Our measurements were all made on the wall plateau with the intent to minimize the impact of the thickness assumption. The variation of modulus within a single cell could reflect a variation in volumetric content (i.e. the relative percentage of cellulose and matrix at a given position), but will also be influenced by the local anisotropy from cellulose microfibril alignment. The deep indents will deform the cell wall in bending and the curvature induced by the bending in different directions would be influenced by the orientation of the cellulose microfibrils. Such an effect will be more dramatic in regions such as the constrictions for which the distances to anticlinal walls vary with direction. The FE model used here was based on isotropic material behavior and these results will direct future models that can incorporate in-plane anisotropy. The modulus values here were much larger than some in the literature, primarily those based on AFM measurements (Peaucelle, 2014; Sampathkumar et al., 2014; Beauzamy et al., 2015). Modulus values in the range of a few MPa would result in significant expansion of the periclinal wall (as shown in the example FE result of Figure 1E) unless walls are thicker or the values of turgor pressure are much lower. An AFM tip would engage only a small volume of material at the outer surface of the wall (Cosgrove, 2016), which means that such results are not expected to match IIT measurements that bend the entire cell wall. Moduli of several hundred MPa are consistent with a composite that includes both cellulose, having a modulus of tens of GPa (Al-Oqla et al., 2015; Zhai et al., 2018), and a viscoelastic matrix comprised of pectin, hemicelluloses, and various proteins.
The turgor pressure values were found to be nearly constant for all measurements within a given cell and this outcome was expected (Beauzamy et al., 2014). However, there was variation between cells from different leaves, even though the ages of the leaves were similar. These differences likely reflect the varying water status of the leaf. Very little information is found in the literature about turgor pressure variations across a single leaf primarily because such measurements have historically been destructive and have not been possible on small cells. Here, turgor pressure measurements after the first two stages of mannitol solution treatment showed a decrease that was consistent with the difference of the two solute potentials. Such results highlight the sensitivity of the measurements to small changes in turgor pressure. The changes in turgor pressure for the higher solute potentials reflect the nonlinear behavior of the cell volume change that has been observed in connection with solution concentration (Sajnin et al., 1999).
Using higher concentrations of mannitol, the turgor pressure in the cell decreased, whereby the periclinal wall gradually flattened. For osmotic potentials of 0.9–1.2 MPa, the height of the cell wall showed a small change, but was followed by a dramatic drop. These stages were associated with the presence of plasmolysis. This phenomenon is also consistent with previous reports (Speth et al., 2009). Generally, the plasmolysis starts in some locations of the cell for mannitol solutions of 0.6–0.8 mM (1.48–1.98 MPa solute potential; Lang et al., 2014; Junková et al., 2018). The extent of the changes during mannitol treatment was compared with the threshold value of solute potential for plasmolysis which was in the range of 1–2 MPa (see Supplemental Figure S8). This information also supports the estimation of turgor pressure using our approach.
Our measurements also showed that the elastic modulus decreased by ∼15% for the first two stages of mannitol treatment, and decreased by ∼35% for higher mannitol concentrations. A reduction of modulus was reported by Beauzamy et al. (2015), but they found a decrease of modulus of ∼85% for high concentrations of sorbitol solution which they attributed to a drop in wall tension from the pressure. Our model accounts for such wall tensioning because the wall modulus was defined in the predeformed state which may explain the smaller decrease of modulus. In addition, the drop in modulus cannot be explained in terms of wall thinning or a drop in Poisson’s ratio, because both reductions would lead to an increase in estimated modulus (see Tables 2 and 6). Another previous result by Forouzesh et al. (2013), in which a salt solution was used to decrease turgor pressure, did not show significant differences in wall modulus due to plasmolysis, but their lack of sensitivity may have been the result of the simple cell geometry used in their model. Some studies have shown that a saline solution can increase the transport of Na+, K+, and Ca2+ out of the cell (Cramer et al., 1985; Almeida et al., 2017). It has also been shown (Zsivanovits et al., 2004) that the loss of these elements can lead to a stiffness reduction in pectin. Thus, the water movement may also cause ion transport out of the wall matrix leading to changes that are detectable for higher concentrations of the mannitol solution. However, cellulose is the primary load-bearing component of the wall so small changes in the matrix modulus may not be measurable for small values of wall strain. In general, the use of chemical treatments to manipulate turgor in cells remains a valuable technique but more studies are needed to assess potential changes to cell wall mechanical properties.
Table 6.
Variation of the estimated turgor pressure and modulus with respect to Poisson’s ratio based on Cell 1, position P-6 (Figure 4, A–C) with Gi/G0 = 0.125
| Poisson’s Ratio, ν | Estimated Turgor Pressure (MPa) | Estimated Elastic Tensile Modulus (MPa) |
|---|---|---|
| 0.4 | 0.64 | 332.2 |
| 0.47 | 0.65 | 288.1 |
All other parameters were fixed with values shown in Table 1.
Conclusions
The integrated experimental–computational approach described here allowed accurate 3D geometry of the cell to be used to create a robust FE model to simulate the indentation experiments that deform the entire thickness of the cell wall. The spatial resolution of the measurements was on the order of a few microns offering the potential to map the properties of the periclinal wall on living Arabidopsis pavement cells. The results quantitatively demonstrated a variation of properties within single cells and were sensitive to wall material throughout the entire thickness, an aspect of this work which is important for future cell growth and development studies. Even though anisotropic mechanical properties were not considered in this article, these results serve as a reference for additional studies to characterize the in-plane anisotropy ratio in the periclinal wall, in order to understand the morphogenesis of the epidermal cells during growth (Belteton et al., 2021). This method was also used successfully to estimate turgor pressure for living plant pavement cells nondestructively. It has the potential to be used to monitor the change of turgor for pavement cells during growth and under specific chemical or environmental conditions.
Materials and methods
Plant materials
Arabidopsis (Arabidopsis thaliana) wild-type (Col-0) was used for the measurements. The plants were grown in a growth chamber (23°C, 16-h light/8-h dark), and 22–28 d after germination, the plant was transplanted in a small petri-dish attached with a support and settled for 1–3 d before testing. Leaves (#5, #6, or #7) were mounted on the support using epoxy gel (Devcon, Milpitas, CA, USA; 5 min cure) to expose the abaxial side. The soil in the petri-dish was covered with plastic film to prevent dehydration. To be able to identify the same epidermal cells, a black Sharpie marker was used to make a reference mark on the sample surface (a very small mark away from the test site). Five plants were used for the experiments involving a single leaf from each plant. Trichomes sometimes limited the cells that could be studied, but were not problematic.
The Arabidopsis line expressing TUB6:GFP (transgenic line that constitutively expresses a fusion protein comprising green fluorescent protein [GFP] and tubulin; smRS-GFP was fused to the N-terminus of the Arabidopsis beta-tubulin 6 [TUB6] isoform) that contained unpolymerized subunits that marked the cytosol was used to observe plasmolysis under different osmotic conditions. The #5–#7 leaf (30–40 d after germination) of the plant was cut, and the petiole was sealed using epoxy. Then the leaf was flattened and glued on a thin glass slide for microscopy.
Mannitol solution preparation
D-Mannitol was purchased from Sigma Aldrich (type number M4125), and different solute concentrations of the solution (D-Mannitol and distilled water), 0.12 M (0.3 MPa), 0.24 M (0.6 MPa), 0.36 M (0.9 MPa), 0.48 M (1.2 MPa), and 0.61 M (1.5 MPa), were prepared. The associated solute potentials, , shown in parentheses, were calculated using , where i = 1 for mannitol, c is the solute concentration (unit is mol/L), R is the pressure constant (8.314 kPa·L/mol·K), and T is the absolute temperature in degrees Kelvin.
Mannitol solution treatment of the samples
Two groups of samples were prepared for mannitol treatment. For the first group, there was no treatment, and the living leaf was mounted directly on a support for optical and mechanical testing. For the second group, the leaf was mounted on a support/container, and each mannitol solution was placed in the support/container for 50 min to allow the water potential in the epidermal cells to reach equilibrium. Then the solution was removed from the container, the leaf was carefully blotted dry, and the LSCM and IIT measurements were performed.
LSCM and TEM experiments
An LSCM (Keyence VK-X200, 402 nm wavelength, 0.5 nm z-resolution) with an objective lens of 50X (long working distance) was used for measuring the 3D shape of the epidermal cells tested in this study. Using this microscope, the boundary geometry of the cells of interest and the relative height of the periclinal wall relative to the average height of the surrounding anticlinal wall were measured.
Another confocal microscope (Zeiss LSM 800 with Airyscan, Germany) was used to observe plasmolysis of the GFP samples. The green channel and the 50X and 10X objective lenses were used. For application of the 50X objective, oil was added on the lens for the optical observation of the same cells.
The TEM methodology described previously (Yanagisawa et al., 2015) was used to measure the thickness of cotyledons. In addition, values of periclinal wall thickness from TEM measurements on true leaves (22 d) were also reported previously (Forouzesh et al., 2013). Both datasets were used to select the thickness of the periclinal wall used in the FE model.
IIT experiments
IIT experiments (Fischer-Cripps, 2011) were conducted in quasi-static mode using a Hysitron Triboscan Ti950 (USA) with a cono-spherical indenter tip (2–3 μm maximum contact diameter). A 50X magnification objective lens (long working distance) was used to observe the epidermal cells. All IIT measurements were conducted in air. Before testing, the leaf sample was settled for 1–2 h in the machine for equilibration. A force of 2–5 μN was used to engage the sample. Displacement control was used for the experiments. Before the experiment of each plant pavement cell, a tip-to-optic calibration (Fischer-Cripps, 2011) was conducted in order to ensure that the spatial positioning on each cell was as accurate as possible.
FE model and iterative calculation
The structural model of the epidermal cells was constructed, and the mechanical analysis was performed using commercial FE software Abaqus (2019 version). In the FE models, the thickness of the periclinal wall was fixed at 400 nm based on TEM measurements, and the cell wall was meshed using elements (element type C3D8R) with a maximum size of 100 nm to ensure a minimum effect from the meshing. Each single periclinal wall was tied to the surrounding anticlinal wall, and the anticlinal wall was confined as a boundary condition. Except for the models with multiple cells (Figure 3, E and F) whose anticlinal wall thickness was 50 nm, the anticlinal wall thickness was fixed at 500 nm although the value played a minor role due to the surrounding matrix that was used to constrain the anticlinal wall deformation. Before pressurization, the periclinal wall was assumed flat. The material of the cell wall was assumed to be an isotropic neo-Hookean material, and the whole material was assumed to be a standard linear solid with a primary relaxation time of 6.88 s (Zsivanovits et al., 2004; Forouzesh et al., 2013). The Poisson’s ratio was assumed to be 0.47 (i.e. nearly incompressible). The equations for the mechanical model are described in the Supplemental Material. The cell wall was first pressurized and then the indentation simulation was performed.
For estimating turgor pressure and local elastic modulus at each indentation position, the hyperelastic material was assigned uniformly across the whole cell wall. Similar to the previous approach (Forouzesh et al., 2013), the stiffness at the shallow indentation depth was dominated by the elastic modulus but the turgor pressure affected the stiffness more at deeper measurements. Therefore, the simulated stiffnesses at all indentation depths were used to match those of the IIT experiments. Furthermore, at the end of cell pressurization, the vertical displacement of the wall at the indentation position was used for comparison with the LSCM height measurement. Once both the optical and mechanical measurements were matched iteratively (refer to Supplemental Figure S4), the turgor pressure and the local wall modulus were determined. The flowchart of the iterative approach is shown in Supplemental Figure S2. Example Abaqus input files of the indentations are available at http://tulips.unl.edu and on GitHub (https://github.com/Turner-TULiPS/Li2021-Models).
Supplemental data
The following materials are available in the online version of this article.
Supplemental Figure S1 . Standard linear solid model.
Supplemental Figure S2 . Schematic of the approach developed.
Supplemental Figure S3. Experimental data from the IIT experiments and LSCM measurements of the pavement cells.
Supplemental Figure S4. Comparison of the simulation with the experiment for the cell shown in Fig. 2.
Supplemental Figure S5 . Calculated change in the total cell volume for different values of indentation depth based on the FE model.
Supplemental Figure S6. LSCM images of the pavement cell at the stage of each mannitol solution treatment.
Supplemental Figure S7. IIT experimental results for the pavement cell with different osmotic conditions.
Supplemental Figure S8. Optical observation of plasmolysis of the leaf sample expressing a cytosolic GFP at mid-plane locations with obvious cell–cell contact.
Supplemental Table S1. Percentage difference between the experimental values and the final model values after iteration for cells 1–4 (Figure 4) and cell 5 which was treated with mannitol solution (Figures 6–7).
Supplemental Movie S1. Example model which shows an indentation at a single location.
Funding
This work was supported by the US National Science Foundation under grant number MCB-1715444 to D.B.S and J.A.T. The IIT experiments and LSCM measurements were conducted at the Nano-Engineering Research Core Facility (NERCF) of the University of Nebraska-Lincoln, which is partially funded by the Nebraska Research Initiative.
Conflict of interest statement: None declared.
Supplementary Material
W.L. and J.A.T. designed the experiments and conceived the overall approach. W.L. performed the nanoindentation and laser scanning confocal microscope experiments and developed the computational analysis with assistance from S.K. and F.A., W.L., S.A.B., and S.K. designed and performed the plasmolysis experiments. S.A.B. obtained the live cell growth images and the TEM results. W.L., J.A.T., and D.B.S. drafted the manuscript which was reviewed and revised by all authors. D.B.S. and J.A.T. acquired the funding.
The author responsible for distribution of materials integral to the findings presented in this article in accordance with the policy described in the Instructions for Authors (https://academic.oup.com/plphys/pages/general-instructions) is: Joseph Turner (jaturner@unl.edu).
References
- Al-Oqla FM, Salit MS, Ishak MR, Aziz NA (2015) Selecting natural fibers for bio-based materials with conflicting criteria. Am J Appl Sci 12:64–71 [Google Scholar]
- Almeida DM, Oliveira MM, Saibo NJM (2017) Regulation of Na+ and K+ homeostasis in plants: towards improved salt stress tolerance in crop plants. Genet Mol Biol 40:326–345 [DOI] [PMC free article] [PubMed] [Google Scholar]
- Altartouri B, Bidhendi AJ, Tani T, Suzuki J, Conrad C, Chebli Y, Liu N, Karunakaran C, Scarcelli G, Geitmann A (2019) Pectin chemistry and cellulose crystallinity govern pavement cell morphogenesis in a multi-step mechanism. Plant Physiol 181: 127–141. [DOI] [PMC free article] [PubMed] [Google Scholar]
- Armour WJ, Barton DA, Law AMK, Overall RL (2015) Differential growth in periclinal and anticlinal walls during lobe formation in Arabidopsis cotyledon pavement cells. Plant Cell 27:2484–2500 [DOI] [PMC free article] [PubMed] [Google Scholar]
- Beauzamy L, Derr J, Boudaoud A (2015) Quantifying hydrostatic pressure in plant cells by using indentation with an atomic force microscope. Biophys J 108:2448–2456 [DOI] [PMC free article] [PubMed] [Google Scholar]
- Beauzamy L, Nakayama N, Boudaoud A (2014) Flowers under pressure: ins and outs of turgor regulation in development. Ann Bot 114: 1517–1533 [DOI] [PMC free article] [PubMed] [Google Scholar]
- Belteton SA, Sawchuk MG, Donohoe BS, Scarpella E, Szymanski DB (2018) Reassessing the Roles of P IN Proteins and Anticlinal Microtubules during Pavement Cell Morphogenesis. Plant Physiol 176: 432–449 [DOI] [PMC free article] [PubMed] [Google Scholar]
- Belteton SA, Li W, Yanagisawa M, Afshar F, Quinn MI, Szymanski MK, Marley MW, Turner JA, Szymanski DB (2021) Real-time conversion of tissue-scale mechanical forces into an interdigitated growth pattern. Nat Plants 7:826–841 [DOI] [PubMed] [Google Scholar]
- Bidhendi AJ, Altartouri B, Gosselin FP, Geitmann A (2019) Mechanical stress initiates and sustains the morphogenesis of wavy leaf epidermal cells. Cell Rep 28:1237–1250.e1236 [DOI] [PubMed] [Google Scholar]
- Carter R, Woolfenden H, Baillie A, Amsbury S, Carroll S, Healicon E, Sovatzoglou S, Braybrook S, Gray JE, Hobbs J, et al. (2017) Stomatal opening involves polar, not radial, stiffening of guard cells. Curr Biol 27: 2974–2983.e2972 [DOI] [PMC free article] [PubMed] [Google Scholar]
- Chanliaud E, Burrows KM, Jeronimidis G, Gidley MJ (2002) Mechanical properties of primary plant cell wall analogues. Planta 215: 989–996 [DOI] [PubMed] [Google Scholar]
- Cosgrove DJ (1993) Wall extensibility: its nature, measurement and relationship to plant cell growth. New Phytologist 124: 1–23 [DOI] [PubMed] [Google Scholar]
- Cosgrove DJ (2016) Plant cell wall extensibility: connecting plant cell growth with cell wall structure, mechanics, and the action of wall-modifying enzymes. J Exp Bot 67: 463–476 [DOI] [PubMed] [Google Scholar]
- Cramer GR, Läuchli A, Polito VS (1985) Displacement of Ca 2+ by Na + from the plasmalemma of root cells: a primary response to salt stress? Plant Physiol 79: 207–211 [DOI] [PMC free article] [PubMed] [Google Scholar]
- Elsner J, Lipowczan M, Kwiatkowska D (2018) Differential growth of pavement cells of Arabidopsis thaliana leaf epidermis as revealed by microbead labeling. Am J Bot 105: 257–265 [DOI] [PubMed] [Google Scholar]
- Fischer-Cripps AC (2011) Nanoindentation, 3rd edn.Springer Science & Business Media, New York, Dordrecht, Heidelberg, London [Google Scholar]
- Forouzesh E, Goel A, Mackenzie SA, Turner JA (2013) In vivo extraction of Arabidopsis cell turgor pressure using nanoindentation in conjunction with finite element modeling. Plant J 73: 509–520 [DOI] [PubMed] [Google Scholar]
- Hamant O, Inoue D, Bouchez D, Dumais J, Mjolsness E (2019) Are microtubules tension sensors? Nat Commun 10: 2360. [DOI] [PMC free article] [PubMed] [Google Scholar]
- Hayot CM, Forouzesh E, Goel A, Avramova Z, Turner JA (2012) Viscoelastic properties of cell walls of single living plant cells determined by dynamic nanoindentation. J Exp Bot 63: 2525–2540 [DOI] [PMC free article] [PubMed] [Google Scholar]
- Hiller S, Bruce DM, Jeronimidis G (1996) A micro-penetration technique for mechanical testing of plant cell walls. J Texture Stud 27: 559–587 [Google Scholar]
- Junková P, Daněk M, Kocourková D, Brouzdová J, Kroumanová K, Zelazny E, Janda M, Hynek R, Martinec J, Valentová O (2018) Mapping of plasma membrane proteins interacting with Arabidopsis thaliana flotillin 2. Front Plant Sci 9: 991. [DOI] [PMC free article] [PubMed] [Google Scholar]
- Lang I, Sassmann S, Schmidt B, Komis G (2014) Plasmolysis: loss of turgor and beyond. Plants 3: 583–593 [DOI] [PMC free article] [PubMed] [Google Scholar]
- Lin W, Yang Z (2020) Unlocking the mechanisms behind the formation of interlocking pavement cells. Curr Opin Plant Biol 57: 1435–1449. [DOI] [PubMed] [Google Scholar]
- Lintilhac PM, Wei C, Tanguay JJ, Outwater JO (2000) Ball tonometry: a rapid, nondestructive method for measuring cell turgor pressure in thin-walled plant cells. J Plant Growth Regul 19: 90–97 [DOI] [PubMed] [Google Scholar]
- Long Y, Cheddadi I, Mosca G, Mirabet V, Dumond M, Kiss A, Traas J, Godin C, Boudaoud A (2020) Cellular heterogeneity in pressure and growth emerges from tissue topology and geometry. Curr Biol 30: 1504–1516.e1508 [DOI] [PubMed] [Google Scholar]
- Lucas WJ, Alexander JM (1981) Influence of turgor pressure manipulation on plasmalemma transport of HCO 3− and OH − in Chara corallina. Plant Physiol 68: 553–559 [DOI] [PMC free article] [PubMed] [Google Scholar]
- Majda M, Grones P, Sintorn IM, Vain T, Milani P, Krupinski P, Zagórska-Marek B, Viotti C, Jönsson H, Mellerowicz EJ, et al. (2017) Mechanochemical polarization of contiguous cell walls shapes plant pavement cells. Dev Cell 43: 290–304.e294 [DOI] [PubMed] [Google Scholar]
- Malgat R, Faure F, Boudaoud A (2016) A mechanical model to interpret cell-scale indentation experiments on plant tissues in terms of cell wall elasticity and turgor pressure. Front Plant Sci 7: 1351. [DOI] [PMC free article] [PubMed] [Google Scholar]
- Panteris E, Galatis B (2005) The morphogenesis of lobed plant cells in the mesophyll and epidermis: organization and distinct roles of cortical microtubules and actin filaments. New Phytol 167: 721–732 [DOI] [PubMed] [Google Scholar]
- Peaucelle A (2014) AFM-based mapping of the elastic properties of cell walls: at tissue, cellular, and subcellular resolutions. J Vis Exp [DOI] [PMC free article] [PubMed] [Google Scholar]
- Sajnin C, Gerschenson LN, Rojas AM (1999) Turgor pressure in vegetable tissues: comparison of the performance of incipient plasmolysis technique using mannitol and polyethylenglycol. Food Res Int 32: 531–537 [Google Scholar]
- Sampathkumar A, Krupinski P, Wightman R, Milani P, Berquand A, Boudaoud A, Hamant O, Jönsson H, Meyerowitz EM (2014) Subcellular and supracellular mechanical stress prescribes cytoskeleton behavior in Arabidopsis cotyledon pavement cells. eLife 3: e01967. [DOI] [PMC free article] [PubMed] [Google Scholar]
- Sapala A, Runions A, Routier-Kierzkowska AL, Das Gupta M, Hong L, Hofhuis H, Verger S, Mosca G, Li CB, Hay A, et al. (2018) Why plants make puzzle cells, and how their shape emerges. eLife 7: e32794. [DOI] [PMC free article] [PubMed] [Google Scholar]
- Speth EB, Imboden L, Hauck P, He SY (2009) Subcellular localization and functional analysis of the Arabidopsis GTPase RabE. Plant Physiol 149: 1824–1837 [DOI] [PMC free article] [PubMed] [Google Scholar]
- Szymanski DB (2014) The kinematics and mechanics of leaf expansion: new pieces to the Arabidopsis puzzle. Curr Opin Plant Biol 22: 141–148 [DOI] [PubMed] [Google Scholar]
- Szymanski DB, Cosgrove DJ (2009) Dynamic Coordination of Cytoskeletal and Cell Wall Systems during Plant Cell Morphogenesis. Current Biology 19: R800–R811 [DOI] [PubMed] [Google Scholar]
- Tyree MT, Hammel HT (1972) The measurement of the turgor pressure and the water relations of plants by the pressure-bomb technique. J Exp Bot 23: 267–282 [Google Scholar]
- Vőfély RV, Gallagher J, Pisano GD, Bartlett M, Braybrook SA (2019) Of puzzles and pavements: a quantitative exploration of leaf epidermal cell shape. New Phytologist 221: 540–552 [DOI] [PMC free article] [PubMed] [Google Scholar]
- Wang L, Hukin D, Pritchard J, Thomas C (2006) Comparison of plant cell turgor pressure measurement by pressure probe and micromanipulation. Biotechnol Lett 28: 1147–1150 [DOI] [PubMed] [Google Scholar]
- Weber A, Braybrook S, Huflejt M, Mosca G, Routier-Kierzkowska AL, Smith RS (2015) Measuring the mechanical properties of plant cells by combining micro-indentation with osmotic treatments. J Exp Bot 66: 3229–3241 [DOI] [PMC free article] [PubMed] [Google Scholar]
- Wong JH, Kato T, Belteton SA, Shimizu R, Kinoshita N, Higaki T, Sakumura Y, Szymanski DB, Hashimoto T (2019) Basic Proline-Rich Protein-Mediated Microtubules Are Essential for Lobe Growth and Flattened Cell Geometry. Plant Physiol 181: 1535–1551 [DOI] [PMC free article] [PubMed] [Google Scholar]
- Wu TC, Belteton SA, Pack J, Szymanski DB, Umulis DM (2016) LobeFinder: a convex hull-based method for quantitative boundary analyses of lobed plant cells. Plant Physiol 171: 2331–2342 [DOI] [PMC free article] [PubMed] [Google Scholar]
- Yanagisawa M, Desyatova AS, Belteton SA, Mallery EL, Turner JA, Szymanski DB (2015) Patterning mechanisms of cytoskeletal and cell wall systems during leaf trichome morphogenesis. Nat Plants 1: 1–8 [DOI] [PubMed] [Google Scholar]
- Zamil MS, Yi H, Puri VM (2015) The mechanical properties of plant cell walls soft material at the subcellular scale: the implications of water and of the intercellular boundaries. J Mater Sci 50: 6608–6623 [Google Scholar]
- Zhai L, Kim HC, Kim JW, Kang J, Kim J (2018) Elastic moduli of cellulose nanofibers isolated from various cellulose resources by using aqueous counter collision. Cellulose 25: 4261–4268 [Google Scholar]
- Zhang C, Halsey LE, Szymanski DB (2011) The development and geometry of shape change in Arabidopsis thaliana cotyledon pavement cells. BMC Plant Biol 11: 27. [DOI] [PMC free article] [PubMed] [Google Scholar]
- Zsivanovits G, MacDougall AJ, Smith AC, Ring SG (2004) Material properties of concentrated pectin networks. Carbohydr Res 339: 1317–1322 [DOI] [PubMed] [Google Scholar]
Associated Data
This section collects any data citations, data availability statements, or supplementary materials included in this article.