Abstract
To explore kinship practices at chambered tombs in Early Neolithic Britain, we combined archaeological and genetic analyses of 35 individuals who lived about 5,700 years ago and were entombed at Hazleton North long cairn1. Twenty-seven are part of the first extended pedigree reconstructed from ancient DNA, a five-generation family whose many interrelationships provide statistical power to document kinship practices that were invisible without direct genetic data. Patrilineal descent was key in determining who was buried in the tomb, as all 15 inter-generational transmissions were through men. The presence of women who had reproduced with lineage men and the absence of adult lineage daughters suggests virilocal burial and female exogamy. We demonstrate that one male progenitor reproduced with four women: the descendants of two of those women were buried in the same half of the tomb over all generations. This suggests that maternal sub-lineages were grouped into branches whose distinctiveness was recognized during the tomb’s construction. Four males descended from non-lineage fathers and mothers who also reproduced with lineage males, suggesting that some men adopted their reproductive partners’ children by other males into their patriline. Eight individuals were not close biological relatives of the main lineage, raising the possibility that kinship also encompassed social bonds independent of biological relatedness.
Genome-wide ancient DNA analysis has emerged as a transformative tool for understanding how past people related to each other and to people today. To date, these studies have mostly focused on changes in deep ancestry proportions over time which can be accurately characterized with only a handful of individuals per population2,3. Recently, ancient DNA has been increasingly applied to provide insight into social phenomena4–7. Yet, while more than a thousand pairs of first- to fourth-degree relatives have been documented in the ancient DNA literature, there have been almost no multi-generational families5,7 where the exact relationships of all the individuals have been uniquely characterized. In studies of Neolithic chambered tombs in Britain and Ireland, relatedness patterns documented to date include cases of first- or second- degree relative pairs within or across tombs8, persistence of particular Y-chromosome lineages in the same tombs8; two brothers in the same chamber in England9, and an absence of biological kin within the third degree among 11 and 15 sampled individuals at two tombs in Ireland4. Our genome-wide data on 36 individuals from the same tomb and reconstruction of a five-generation family including 27 individuals which we co-analyse with contextual archaeological information thus offers an unprecedented opportunity to understand social relations within the communities that built and used these tombs. Such comprehensive reconstructions not only provide insight into the genealogical aspects of kinship in past societies, but can also be used to identify kinship practices that extend beyond genealogical descent. Anthropological studies have made it clear that kinship—the relationships of family connection and belonging that play a central role in organizing societies—varies dramatically across cultures. Biological relatedness may be of greater or lesser importance in determining kinship; kin need not be biological relatives (or even human), and child rearing is not always centered on the relationship between biological father and mother10–12. Funerary practices often play an important role in the social negotiation of connections and divisions between kin, and here we use this insight, along with the ability of ancient DNA to document relatedness, to provide a window into the role of biology in determining kinship among people who buried their dead in Neolithic chambered tombs.
Hazleton North, Gloucestershire, an Early Neolithic Cotswold-Severn chambered long cairn, contained well-preserved human remains and was excavated in its entirety1. The tomb was constructed in the thirty-seventh century BC13, at least a hundred years after cattle and cereal cultivation had been introduced to Britain along with the construction of megalithic monuments14; prior to that, the overwhelming majority of the biological ancestors of those buried at Hazleton North lived in continental Europe2,3. There are many other long cairns or long barrows in the region, at least nine of which share with Hazleton North a bilateral arrangement of chambers, although no two sites are identical and others have different chamber arrangements. Hazleton North incorporates two opposed L-shaped chambered areas mirrored around the ‘spine’ of the cairn; these roofed chambered areas were flanked by rectangular cells of masonry on either side of the axial line and the whole cairn was enclosed by a retaining wall1 (Fig. 1a). The two chambered areas, north and south, each had three compartments: a chamber (innermost), a passage, and an entrance (Fig. 1b and Extended Data Fig.1). Osteological analysis has identified a minimum of 41 individuals within the tomb, including 22 adults15,16. The treatment of human remains differs somewhat between the north and south chambers (Supplementary Information Section 1): bones from more than five individuals in the north chambered area had been gnawed by scavengers15 suggesting exposure prior to deposition (Extended Data Fig.2); cremated remains from three individuals were placed in the north entrance (one infant, one child and one adult); and the remains in the south chambered area were more commingled and dispersed among neighbouring compartments than in the north. The individuals buried at Hazleton North exhibit a similar range of pathologies as those from contemporary tombs in southern Britain, such as osteoarthritis and conditions suggesting nutritional stress in childhood15 (such as cribra orbitalia) (Supplementary Information section 1). Isotopic analysis indicates a diet rich in animal proteins17 while proteomic analysis confirms this included dairy products18, which is also typical for the region. Bayesian modelling of 44 radiocarbon dates suggested that the monument was built over the course of a decade between 3,695–3,650 BC, with the stonework of the north passage collapsing and sealing off the north chamber c. 3,660–3,630 BC, and the deposition of the individuals in this study probably ceasing around 3,620 BC13. A study of strontium and oxygen stable isotopes on teeth suggested that most of the 22 individuals sampled had spent some of their childhood on geology at least 40 km away19. Here we interpret new ancient DNA data alongside the archaeological evidence to reconstruct kinship practices among the community who buried their dead at Hazleton North.
Fig. 1. The Hazleton North pedigree in the context of the physical structure of the tomb.
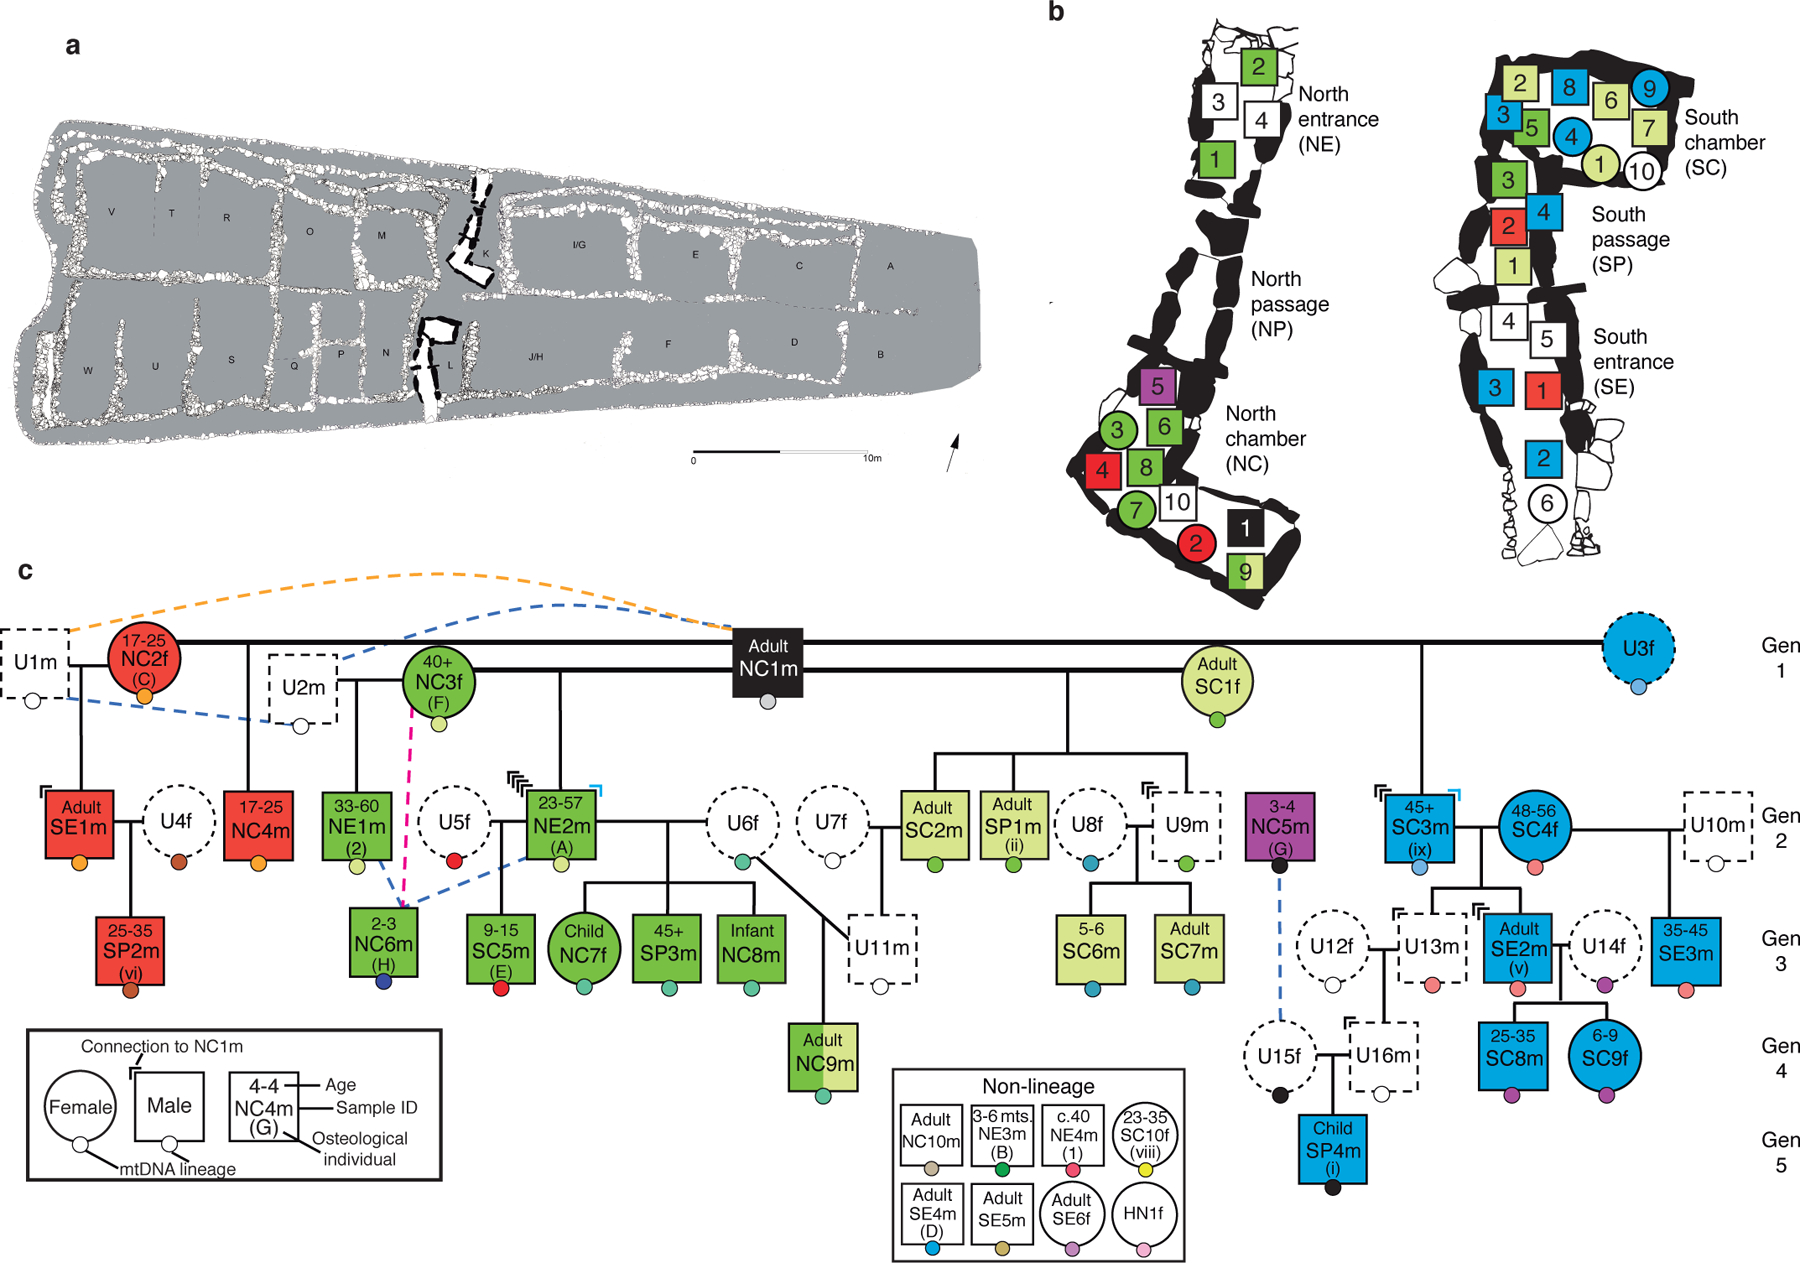
a, Plan of Hazleton North showing the north and south chambered areas in the cairn (grey). Adapted from1. b, Burial locations for individuals, with squares for males and circles for females. Individuals are coloured according to the female sub-lineage they belong to. The relative position of each individual within each compartment does not reflect the exact location in which the corpse or remains were placed. c, Reconstruction of the pedigree, using the same colour scheme and indicating the locations of individuals in the tomb, osteological information including age estimates, and different mitochondrial DNA haplogroups as small circles with different colours. Individuals with a dotted outline are unsampled (U) and their existence is inferred. Pink, blue and orange dotted lines indicate likely second-, third- and fourth-degree relationships, respectively. Marks at the top corners of individuals indicate how many genealogical connections linking individuals in the third through fifth generations to male NC1m traverse through that individual (in blue, connections through step-fathers).
To generate ancient DNA data, we obtained powder from 74 samples, largely petrous bones and teeth. We extracted DNA, generated double- and single-stranded libraries, enriched for molecules overlapping approximately 1.2 million polymorphic positions in the nuclear human genome as well as mitochondrial DNA, and sequenced these libraries (Methods). We obtained data passing standard metrics for DNA authenticity for 156 libraries deriving from 66 samples (Supplementary Table 1). After detecting samples that derived from the same individual and merging the data, we had genome-wide data from 35 distinct individuals (Extended Data Table 1) with median coverage of 2.9-fold (range of 0.018 – 9.75-fold; Supplementary Table 1).
We estimated mismatch rates on the autosomes (Supplementary Tables 4, 5) for each pair of individuals, randomly sampling one DNA sequence at each position on chromosomes 1–22, and computed relatedness coefficients r (Supplementary Table 5, Methods). We also determined the type of first-degree relationships based on uniparental markers (mtDNA and Y-chromosome) (Supplementary Table 1) and based on the spatial pattern of mismatches along the chromosomes (Supplementary Tables 5, 6 and Extended Data Fig. 3). We manually built family trees (Supplementary Information Section 2; Fig. 1c and Extended Data Fig. 4) consistent with the pairwise genetic degrees of relatedness (Extended Data Fig. 2); maternal (mtDNA) and paternal (Y-chromosome) haplogroups; genetic sex (Supplementary Table 1); genetic inbreeding (Extended Data Fig. 9) and age-at-death. After leveraging the distribution of recombination events (Extended Data Fig. 5) we obtained a unique pedigree that fit the data for 27 individuals (Fig. 1c). We determined that the inferred pedigree (Supplementary Information Section 2) was entirely consistent with independent information from the X-chromosome (Extended Data Fig. 6a), the number of shared DNA segments (Extended Data Fig. 6b), and a different methodology for kinship estimation (Extended Data Fig. 7). We introduce a nomenclature to refer to individuals that first specifies location within the tomb (NC = North Chamber, NP = North Passage, NE = North Entrance, SC = South Chamber, SP = South Passage, SE = South Entrance, U = Unsampled individual who may not even have been buried on the tomb but who we know must have existed based on their genetic relationship to other individuals, HN = uncertain location within the tomb), then specifies an arbitrary number to distinguish each individual from the others, and finally gives a letter to indicate their chromosomal sex. In this study we use “m/male/man” to indicate an individual with an X and a Y chromosome, and “f/female/woman” to indicate an individual with two X chromosomes, while recognizing that chromosomal sex is only one element in how sex and gender are contextually and culturally defined. In Extended Data Table 1, Supplementary Table 1 and 2 we provide translations between this nomenclature and genetic and osteological identifiers.
The reconstructed pedigree consists of a five-generation lineage descended from one male NC1m and four females with whom he reproduced (SC1f, NC2f, NC3f, and unsampled female U3f); also interred as part of this family are adult female reproductive partners of lineage males and male line descendants of these women and non-lineage males. The pedigree includes 27 individuals—three times as many individuals as the largest pedigrees reconstructed from ancient DNA5,7—and provides the first direct evidence that at least some Neolithic tombs were organized around kinship practices. Eight other individuals are not close biological relatives of the 27. The reconstructed pedigree includes a sufficiently rich network of relationships to identify kinship practices that would be invisible in smaller datasets (Extended Data Table 2 and Supplementary Table 7), while the inclusion in the tomb of eight individuals without evidence of close biological relationships or reproductive partnerships with others in the pedigree suggests either that kinship did not always depend on such relations or that kinship may not have been the only criterion for inclusion in the tomb throughout its use.
Mortuary treatment varied according to chromosomal sex in several ways. Firstly, each third-, fourth- or fifth-generation individual whose lineage we can trace through the second generation to the first is connected to NC1m entirely through males. Specifically, all 15 of the genealogical connections are through fathers (13 cases) or stepfathers (2 cases) (P=0.000061 from a two-side binomial test; Fig. 1c), providing the first direct evidence that patrilineal descent was a primary determinant of who was interred with whom in a Neolithic tomb. These observations are consistent with the inference that the persistence of rare Y-chromosome haplotypes over time among individuals from the same Neolithic tombs indicates patrilineal practices in these communities4,8. Secondly, 26 of 35 individuals with genetic data are biologically male (P=0.00599 from a two-sided binomial test), consistent with osteological20 and genetic evidence8 that chambered tombs in England and Ireland preferentially included biological males (for example, males outnumber females about 1.6 to 1 in Cotswold monuments)20. This suggests the remains of some women were treated in another way (e.g. exposure of remains to the elements or scattering of cremated remains away from the tomb). Thirdly, four women among those sampled had reproduced with lineage males, and their presence suggests virilocal burial, that is, burial with a male partner’s lineage rather than their father’s lineage. This, combined with the lack of adult lineage daughters among those sampled (0 adult daughters vs. 14 adult sons; P=0.00012 from a two-sided binomial test) and the presence of two lineage daughters who died in childhood, suggests that women generally joined the lineage of their mate. While we do not know the social or geographical distance involved in this patrilocal exogamy, the lack of long runs of homozygosity which measures how closely a person’s two parents are related to each other for all but one individual indicates that inbreeding was effectively avoided (Extended Data Fig. 9). These results show that patrilineal descent played an important role in shaping social relations—a finding that provides some insight into the nature of the community at Hazleton North (especially given the associations between patrilineal descent, virilocality, polygyny and cattle husbandry documented in ethnographically diverse cultures21)—but as we show below, the spatial organization of the dead, and the inclusion of individuals who were not part of the biological patriline, indicate that other considerations also had significant influence on burial patterns.
We observe six instances of multiple reproductive partners (Fig. 1c), most notably male NC1m who reproduced with four females. We cannot determine whether the latter was an instance of serial monogamy or polygyny, and we cannot exclude the possibility of progeny from unions that were not socially sanctioned in any of the six instances. Where men had multiple reproductive partners those females were not closely related to one another (Extended Data Fig. 8). However, multiple reproductive partners of females were related in most cases, such as two males in the patriline, NE2m and unsampled male U11m, who are inferred to be third-degree relatives and who both produced offspring with female U6f. Another case is NC3f, who reproduced with male NC1m and also with a different male who, although not descending from NC1m, was likely his close relative. Such women may have formed important connections between parallel lineages of related males.
Our data prove that the arrangement of chambers at this Neolithic tomb was centrally determined by notions of kinship, a matter long debated for such monuments22. While determination of who could be buried at Hazleton North was primarily patrilineal, we observe a significant spatial patterning in the placement of individuals from different maternal sub-lineages, with all 12 individuals belonging to the sub-lineages of SC1f and U3f buried in the south, and 9 out 13 belonging to the sub-lineages of NC2f and NC3f buried in the north, including the first generation mothers in the 3 out 4 cases where we have been able to locate them (P-value=0.0011 from a Fisher’s Exact Test for a difference in the spatial placement of these four sub-lineages) (Fig. 1b). We can therefore describe the pedigree as divided into a ‘southern branch’ and a ‘northern branch’, each consisting of two maternal lines. The fact that this duality is fundamental to the tomb’s architecture suggests that the builders anticipated this division. The collapse of walling which blocked the junction of the north passage and entrance led to the deposition of longer-lived second and third generation descendants of NC2f and NC3f outside the north chamber, disrupting this duality and perhaps contributing to the abandonment of the tomb by the northern branch (P-value=0.00408 from a one-sided Fisher’s Exact Test for the individuals in these two sub-lineages with a likely later date of death being buried outside the north chamber). The fact that these branches were based on maternal descent provides evidence that the women originating each sub-lineage were socially significant in the memories of these communities. The interplay between patrilineal and maternal descent also has implications for interpreting the constitution of personhood and gender in this Neolithic community23.
Our genetic analyses of individuals from Hazleton North reveal kinship practices that while consistent with patrilineality cannot all be explained by biological descent. Thus, NE1m, SE1m, and SE3m are not descendants of NC1m but instead are sons of women who had other children with him or his male-line genetic descendants; SP2m is the biological son of one of these individuals, SE1m. These four individuals represent cases of incorporation of males into a patriline when a man born into the lineage reproduced with their mothers: this could indicate adoptive kinship, although in two cases the fathers of these males were also third- or fourth-degree biological relatives of NC1m (Extended Data Fig. 8). Social fatherhood in this Neolithic community could be as important as biological fatherhood, a pattern observed ethnographically in societies such as the patrilineal and polygynous Nuer24. The presence of eight individuals who are not close biological relatives of any member of the lineage could be interpreted in several ways. Three were women; it is possible they were mates of lineage males but did not reproduce, or that we have not sampled their offspring (who likely would not have been buried in the tomb if they were grown adult daughters). Some or all of these eight may have been considered kin by association or co-residence, or by adoption, raising the possibility of a meaningful role for completely non-biological kinship within the community; however, it is possible that reasons other than kinship were a factor in their inclusion in the tomb and the presence of unrelated individuals is noted at tombs from the same period in Ireland4. Overall, however, it is clear that biological relationships and kin membership were critical to the placement of many of the dead in this tomb: two pairs of sub-lineages within a single patriline were core to the layout of the tomb, and most of those buried in the chambers were lineage members. We therefore infer that the patriline and maternal sub-lineages grounded in the first generation both played anchoring roles in how kinship was negotiated at a tomb designed to both bring together and sub-divide the community.
This analysis provides additional archaeological insights. Bayesian modelling of radiocarbon dates suggested Hazleton North was probably only in use for up to three generations, but the ancient DNA data document five generations in the southern chamber (Supplementary Information Section 4). Osteological identification of the minimum number of individuals in a tomb has the potential to greatly underestimate the numbers present25, yet the 66 skeletal samples that produced genome-wide data included 31 cases of genetic duplicates despite selecting bones and teeth that were not attributed to the same individuals. This suggests that our sampling is well on its way to capturing a good fraction of the individuals whose remains were recovered from the tomb and adds strength to the osteological inference that Hazleton North accommodated tens rather than hundreds of individuals (Supplementary Information section 1). Approximately one hundred long cairns are known within 50km of Hazleton North; one just 80m away. Further excavation, radiocarbon dating and aDNA analyses are needed to assess how many of these exhibit similar contemporary kinship practices, but it is possible that a high proportion of the local contemporary kin groups built and used such tombs. We have too few measurements of stable isotopes on the individuals we analysed to be able to study correlations to cross-geology mobility19 but isotopic analyses of additional individuals with genetic data could reveal undetected patterns.
This study illustrates how ancient DNA analysis can be combined with archaeological evidence to draw inferences about kinship practices invisible to other methods. In particular, our ability to reconstruct a family tree spanning five continuous generations reveals the first direct evidence for a central role for patrilineal descent in the Neolithic mortuary practices5, the acceptance of ‘step-sons’ into the patriline, and a key role for maternal sub-lineages. Adoption or kinship by association may also have played a role in the inclusion of biologically unrelated individuals. Hazleton North cannot be considered a template for all Neolithic chambered tombs since the layout of such monuments varied and kinship practices could have varied between (and within) the different regions where such tombs were built22. Nonetheless, this analysis advances our understanding of kinship and chambered tomb construction in Neolithic Britain. Future research carrying out similar studies in additional tombs both in a Neolithic context in northern Europe and in other cultural contexts has the potential to test alternative theories of kinship in past societies.
Methods
Sampling and ancient DNA data generation
We obtained permission from the Corinium Museum to sample 8 postcranial bones, 17 petrous bones and 49 teeth from Hazleton North. Processing was carried out in dedicated clean rooms. DNA was extracted from using an automated protocol with silica coated magnetic beads and ‘Dabney binding buffer’26. DNA extracts equivalent to between 6 and 8 mg of powder were converted into either single-stranded or double stranded libraries (Supplementary Table 1) following automated library preparation. For some samples we built multiple libraries. USER treatment was applied before single-stranded library preparation27 and partial UDG treatment before double-stranded library preparation28. Amplified libraries were enriched using two rounds of consecutive hybridization capture enrichment (‘1240k’ strategy29,30) targeting 1,233,013 SNPs and the mitochondrial genome or, ‘Twist Ancient DNA’ (Supplementary Table 1), a custom probe panel synthesized by Twist Biosciences. This custom panel targets the very same 1,233,013 SNPs as well as additional SNPs and tiling regions (Twist probes targeting the mitochondrial genome were spiked in) and was performed for only one round of enrichment using reagents and buffers provided by Twist Biosciences. Captured libraries were sequenced either on an Illumina NextSeq500 instrument with 2×76 cycles (2×7 cycles for the indices) or on an Illumina HiSeq X10 with 2×101 cycles (2×7 for the indices) (Supplementary Table 1). For this study, we restricted all our analysis to the 1,233,013 SNPs in common between ‘1240k’ and ‘Twist Ancient DNA’ and the mitochondrial genome.
Following the same procedure as in Olalde et al. 201931, we trimmed adapter sequences, merged paired-end sequences, aligned to both the human reference genome (hg19) and the mitochondrial genome (RSRS) using BWA v0.6.132, and removed PCR duplicate sequences. The computational pipelines are available on github (https://github.com/DReichLab/ADNA-Tools, https://github.com/DReichLab/adna-workflow).
We evaluated ancient DNA (aDNA) authenticity using several criteria:
A rate of cytosine deamination at the terminal nucleotide above 3%.
A ratio of Y to combined X+Y chromosome sequences below 0.03 or above 0.35. Intermediate values are indicative of the presence of DNA from two individuals of different sex.
For males with sufficient coverage, an X-chromosome contamination estimate33 below 5%.
An upper bound rate for the 95% confidence interval for the rate to the consensus mitochondrial sequence that exceeds 95%, as computed using contamMix-1.0.1034.
Out of a total of 74 samples, 8 did not have any library passing these criteria and were discarded, keeping 156 libraries from 66 samples for further analysis (Supplementary Table 1). We retained for analysis one sample (I30332) with 42,000 SNPs recovered that did not have enough data to test for mitochondrial or X-chromosome contamination. Given that it did not display evidence of contamination according to the other two authenticity criteria, we decided to include this sample in the kinship analyses but to be cautious in the interpretation of results.
Genetic sex, mitochondrial and Y-chromosome haplogroup determination
To determine genetic sex, we looked for the presence or absence of Y-chromosome by computing the ratio of the number of Y-chromosomal 1240k positions with available data divided by the number of X- and Y-chromosomal 1240k positions with available data. Individuals with a ratio >0.35 were considered genetic males and individuals with a ratio<0.03 were considered genetic females (Supplementary Table 1). To check for sex-chromosome aneuploidies, we computed the mean coverage on X- and Y-chromosomal 1240k positions, and normalised these values by the autosomal coverage on 1240k positions for each individual. We did not find any evidence for sex-chromosome aneuploidies in any individual.
To determine mitochondrial haplogroups (Supplementary Table 1), we constructed a consensus sequence with samtools and bcftools32, restricting to sequences with mapping quality >30 and base quality >30. We then called haplogroups with Haplogrep235.
We determined Y-chromosome haplogroups (Supplementary Table 1) based on the nomenclature of the International Society of Genetic Genealogy (http://www.isogg.org) version 14.76 (25 April 2019), restricting to sequences with mapping quality ≥ 30 and bases with quality ≥ 30.
Biological kinship estimation
We estimated pairwise allelic mismatch rates in the autosomes31,36,37 for each pair of libraries (n=156) deriving from 66 different samples, randomly sampling one DNA sequence at each ‘1240k’ polymorphic position and masking the two terminal nucleotides of each sequence to reduce the effects of post-mortem deamination. We then computed relatedness coefficients r for each pair (Supplementary Table 4):
with x being the mismatch rate of the pair under analysis and b the mismatch rate expected for two unrelated individuals from Neolithic Britain (0.2504; see Supplementary Information Section 2.2). We also computed 95% confidence intervals using block jackknife standard errors over 5 Megabase (Mb) blocks38.
A total of 105 pairs of libraries stemming from 44 pairs of samples had relatedness coefficients larger than 0.85, indicating that they share their entire genome and that they derived from the same individual. To increase resolution in the kinship analysis, we merged the data from samples deriving from the same individual and from libraries deriving from the same sample, keeping 35 unique individuals for further analysis. We gave a unique identifier to each of these 35 individuals (Supplementary Table 1) based on their burial location and genetic sex (e.g., NC1m = male individual 1 from the north chamber)
We recomputed the mismatch rates and relatedness coefficients r on the merged dataset and annotated degrees of relationship (Supplementary Table 5 and Extended Data Fig. 2). Following a similar approach as in Monroy Kuhn et al. 201839, we used cutoffs lying halfway between the expected relatedness coefficients for different degrees of genetic relationships: 1 for identical twins or samples deriving from the same individuals, 0.5 for first-degree relationships (parent-offspring and siblings), 0.25 for second-degree relationships (grandparent-grandchild, uncle/aunt-nephew/niece, half-siblings, double cousins), 0.125 for third-degree relatives (first cousins, great-grandparent-great-grandchild, half uncle/aunt-nephew/niece, etc) and 0.0625 for fourth-degree relationships.
Additionally, we determined the type of relationship (siblings or parent-offspring) connecting first-degree relatives based on uniparental markers (mtDNA and Y-chromosome) and the DNA sharing along the chromosomes. To analyse DNA sharing patterns along the chromosomes, we computed allelic mismatch rates patterns across sliding windows of 20 Mb, moving by 1 Mb each step (Supplementary Table 6), and visually identified the presence (indicative of a sibling relationship) or absence (indicative of a parent-offspring relationship) of regions with zero or two chromosomes sharing for each first-degree relative pair with sufficient coverage. We illustrate this approach in Extended Data Fig. 3a and annotate the type of relationship for each first-degree pair (Supplementary Table 5).
Family tree reconstruction
We attempted to reconstruct the family tree relating 27 close biological relatives using the pairwise degrees of genetic relatedness (Extended Data Fig. 2) through a process of triangulation that allowed us to discard most tree topologies relating these individuals (Supplementary Information Section 2.3). To aid this process, we also incorporated information regarding:
The types of first-degree relationships (Supplementary Table 5).
The mtDNA and Y-chromosome lineages transmitted through maternal and paternal lines (Supplementary Table 1).
Genetic sex (Supplementary Table 1).
Presence or absence of runs of homozygosity (ROH) indicative of inbreeding (Extended Data Fig. 9b).
Age-at-death as determined through osteological analysis (Supplementary Table 1).
After this procedure, we kept two possible tree topologies differing on whether NC1m is the father (Fig. 1c) or the son of SC3m (Extended Data Fig. 4). To disambiguate between these two scenarios, we studied the co-localization of break points of shared DNA segments between individual SC3m and each of his second-degree relatives NC4m, NE2m, SC2m and SP1m (Supplementary Information Section 2.4; Extended Data Fig. 5). This allowed us to obtain a unique family pedigree relating most of the Hazleton North individuals (Fig. 1c).
Testing the validity of the proposed family tree
We validated the family tree in Fig 1c using three independent lines of evidence (Supplementary Information Section 2.5):
We computed pairwise mismatch rates and relatedness coefficients on the X-chromosome (Supplementary Table 5) following the same formula: r = 1 − (2*(x−(b/2))/b). For male-male comparisons, we adjusted the formula as follows to account for the fact that males have only one X-chromosome: r = 1 − (x/b). We plotted relatedness coefficients in the X-chromosome for first and second-degree pairs (Extended Data Fig. 6a), grouping these pairs based on whether they are expected to share X-chromosome DNA according to the tree structure proposed in Fig. 1c. We found that X-chromosome sharing patterns perfectly fit the proposed tree structure.
For each first- or second-degree pair with more than 100,000 overlapping SNPs, we computed allelic mismatch rate values across sliding windows of 20 Mb, moving by 1 Mb each step (Supplementary Table 6). We plotted these values along the chromosomes and visually identified contiguous regions where the allelic mismatch rate is consistent with one shared chromosome (Extended Data Fig. 3b). We annotated in Supplementary Table 5 the number of such segments identified for each first and second-degree relative pair. We next plotted the number of IBD segments for first- and second-degree relationships (Extended Data Fig. 6b), again grouping the pairs according to their type of relationship in the proposed tree (Fig. 1c). We recovered the expected pattern40,41 of a higher number of IBD segments in avuncular and maternal half-sibling pairs as compared to grandparent-grandchild and paternal half-sibling pairs, adding further support to the proposed tree structure.
We replicated our results using the software NgsRelate v.242 that uses genotype likelihoods and population allele frequencies to estimate Cotterman coefficients k0, k1 and k2, which correspond to the probability of sharing 0, 1 and 2 alleles in identity by descent. From these coefficients, the software computes the Theta coefficient (θ) which is equivalent to the relatedness coefficient r. To run NgsRelate, we first created genotype likelihoods directly from the bam alignment files using ANGSD v0.92333. We included Hazleton North individuals as well as the set of 53 Neolithic individuals from other sites in Britain. We then ran NgsRelate providing as input the genotype likelihood file and allele frequencies estimated only on the Neolithic set from Britain, to avoid possible bias in allele frequencies stemming from the presence of a high number of closely related individuals at Hazleton North. We observed a strong correlation between both methodologies (Extended Data Fig 7)
Principal component analysis (PCA)
To obtain an overview of the ancestry of the Hazleton North individuals, we ran a principal component analysis using the ‘smartpca’ program in EIGENSOFT43. We merged the genomic data from the Hazleton North individuals with other ancient Neolithic and Bronze Age individuals from Britain and Ireland reported in previous publications2–4,8,9,44, as well as with 1109 present-day West Eurasian individuals genotyped on the Affymetrix Human Origins Array43,45,46, restricting to 591,642 SNPs that overlap between the 1240k capture and the Human Origins Array. We projected ancient individuals onto the components computed on present-day individuals with lsqproject:YES and shrinkmode:YES, and plotted the first two principal components (Extended Data Fig. 9a). The Hazleton individuals form a homogeneous cluster within the genomic diversity of contemporaneous Neolithic individuals from England, Scotland and Ireland, indicating that they derived from a very similar pool of ancestors as other Neolithic groups across Britain. We do not detect individuals shifted towards smaller values on PC1 that would suggest recent admixture with Mesolithic hunter-gatherers.
Genetic inbreeding analysis
To study the presence of inbreeding in the Hazleton North group, we use the software hapROH47 that detects runs of homozygosity in ancient individuals. Runs of homozygosity are regions of an individual’s genome where the maternal and paternal chromosomes are identical because they derive from a recent common ancestor. The number and length of these segments in a given individual inform about the degree of biological relationship between the parents. We ran hapROH using standard parameters on the Hazleton individuals with data for more than 400,000 SNPs covered (Supplementary Table 1 and Extended Data Fig. 9b). The software also computes the ROH expected for offspring of close relatives in outbred populations, and for individuals from populations with small effective population size47. The lack of long ROH in all but one individual (Extended Data Fig. 9b) indicates that the Hazleton community effectively avoided reproductive unions between close relatives. Only one individual (SE6f) had a long ROH of 31 cM, which could be compatible with offspring of second or third cousins. This individual does not belong to the family pedigree.
Data availability
The aligned sequences are available through the European Nucleotide Archive, accession PRJEB46958; the genotype dataset is available as supplementary material.
Extended Data
Extended Data Figure 1. The Hazleton North chambered tomb.
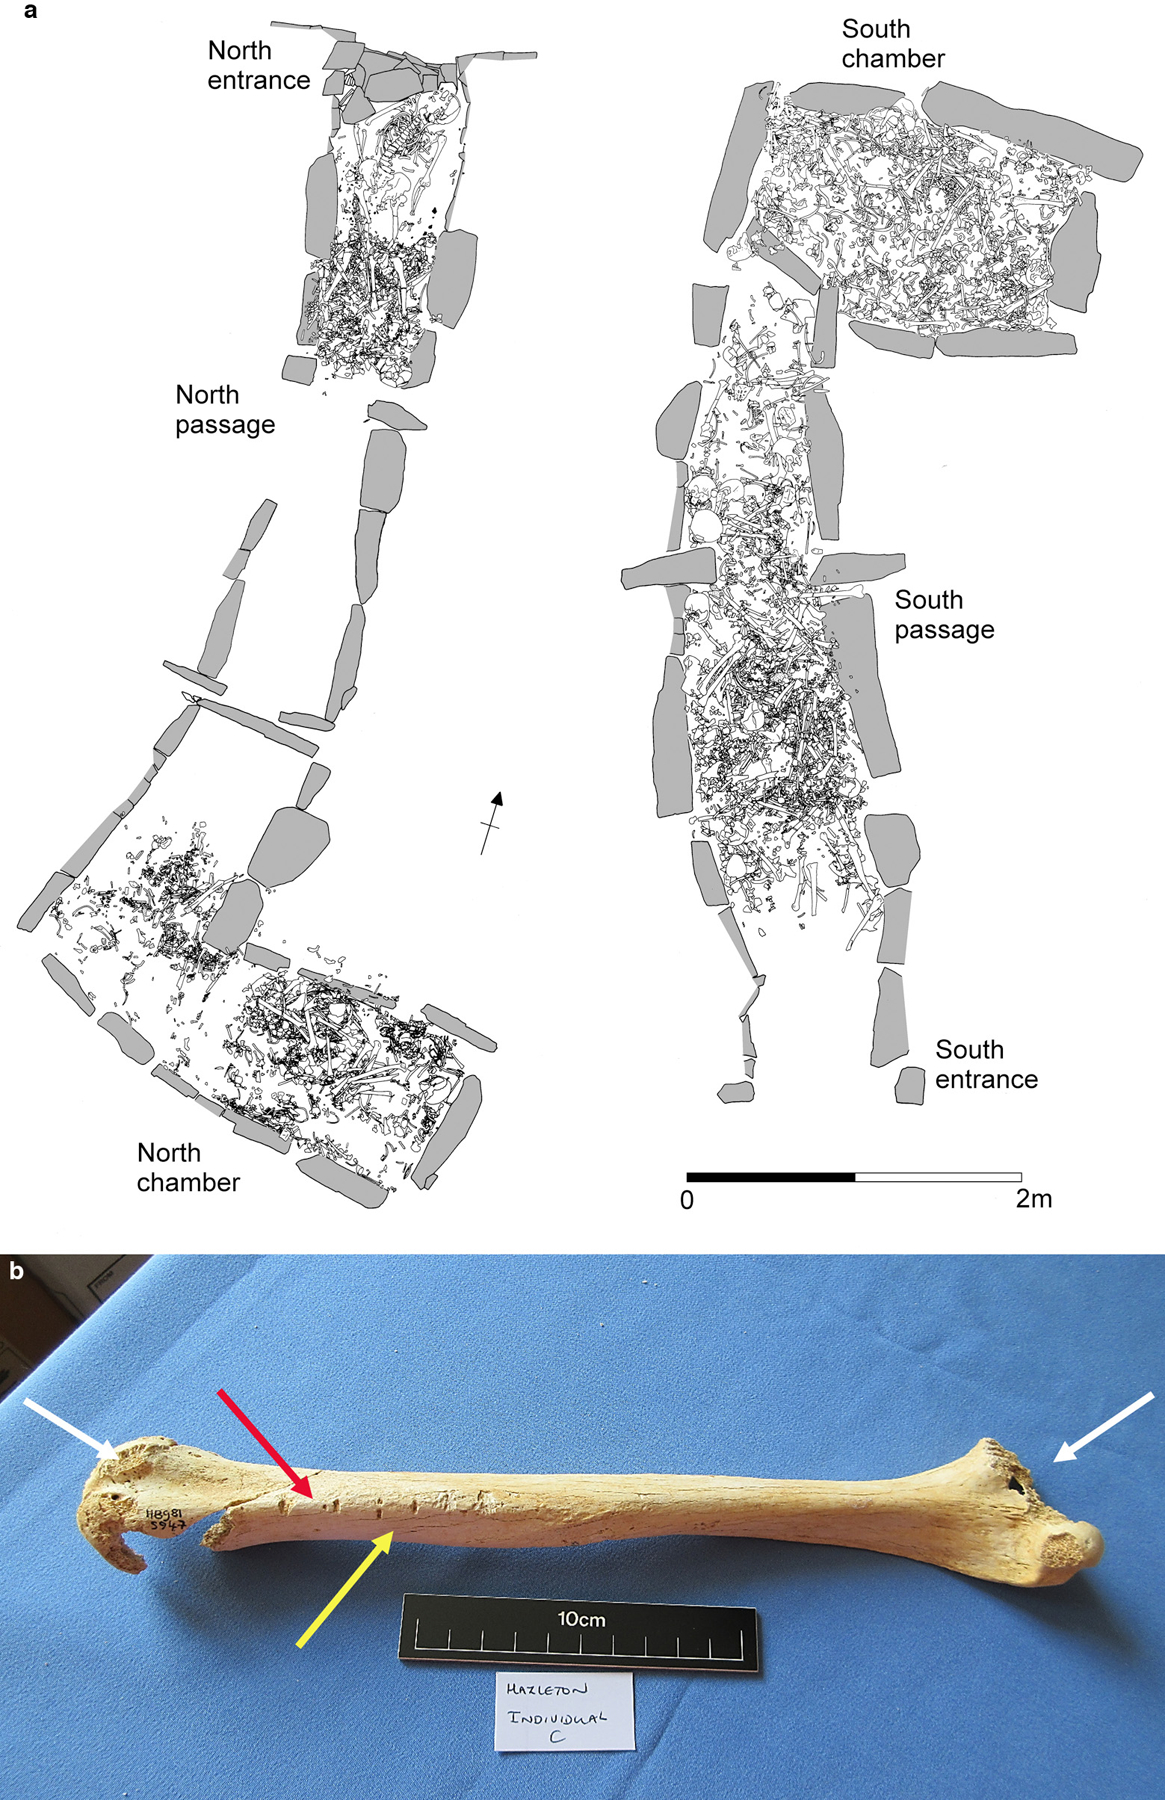
a, Distribution of human remains in both chambers (adapted from1). b, Right humerus from Individual C showing helical fracture (red arrow), tooth marks (yellow arrow) and gnawed proximal and distal ends (white arrows).
Extended Data Figure 2. Degrees of biological relatedness among individuals at Hazleton North.
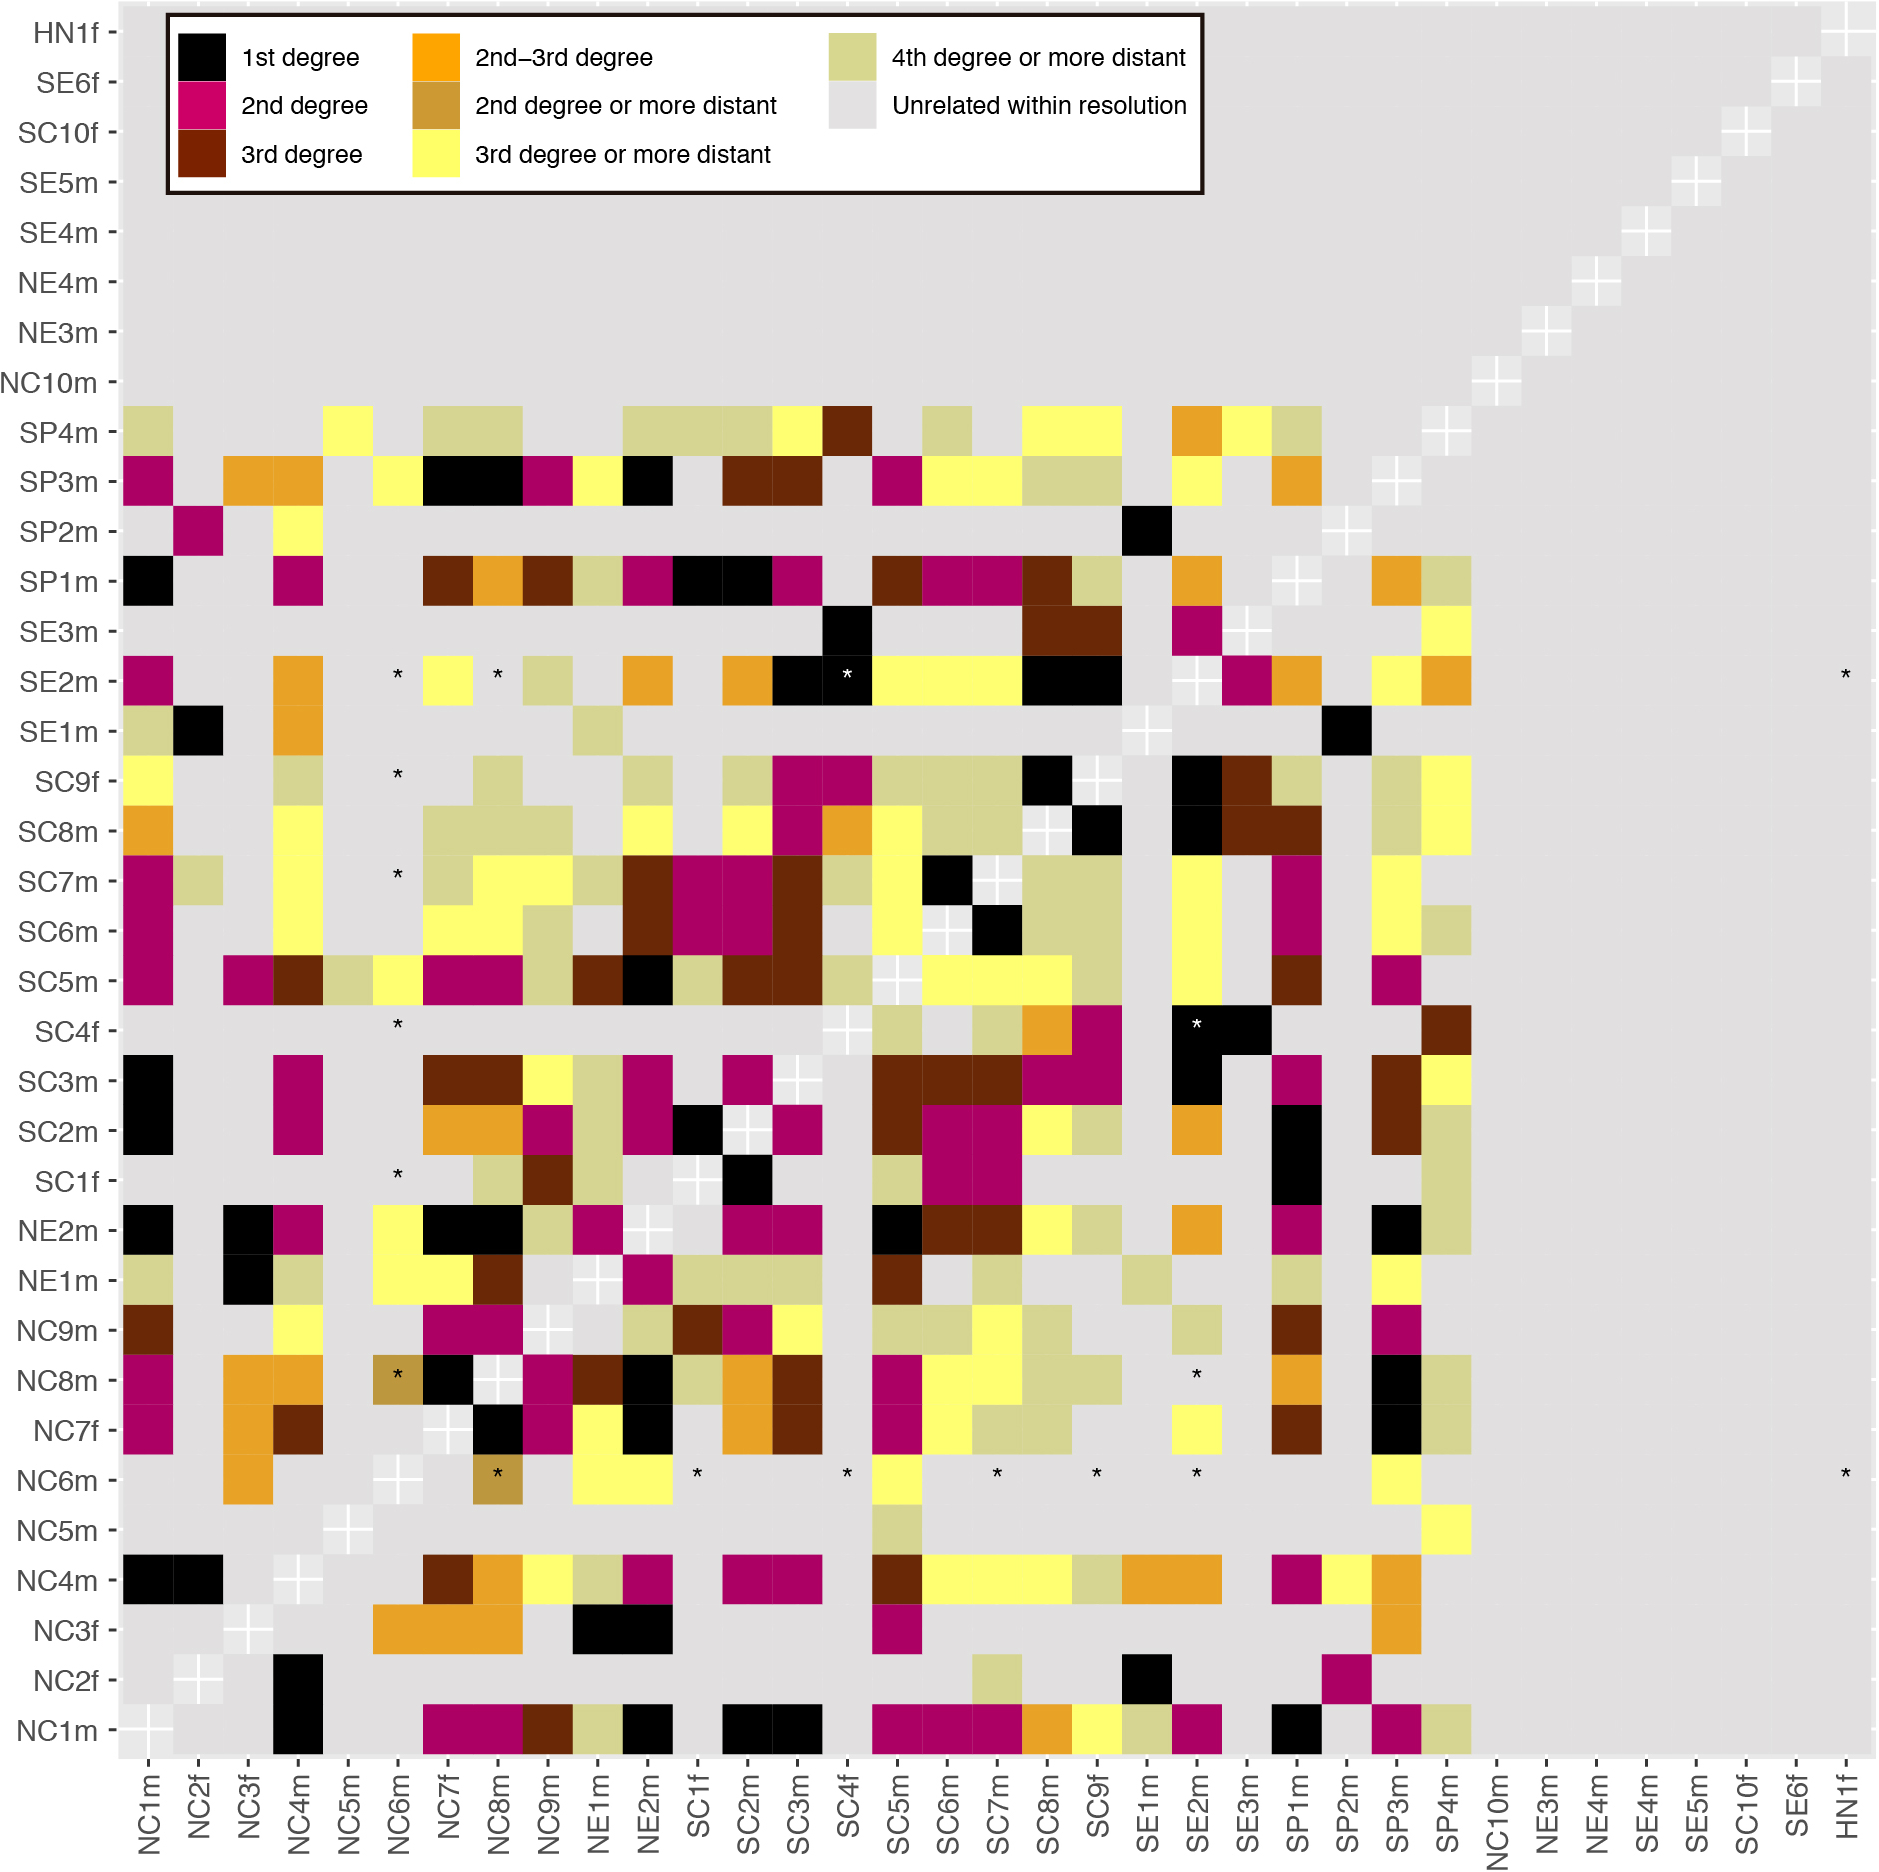
(Supplementary Information section 2.2). Pairs with fewer than 15,000 overlapping SNPs are indicated with an asterisk.
Extended Data Figure 3. Using allelic mismatch rates patterns along the chromosomes to differentiate types of relationships for individuals sharing the same amount of DNA.
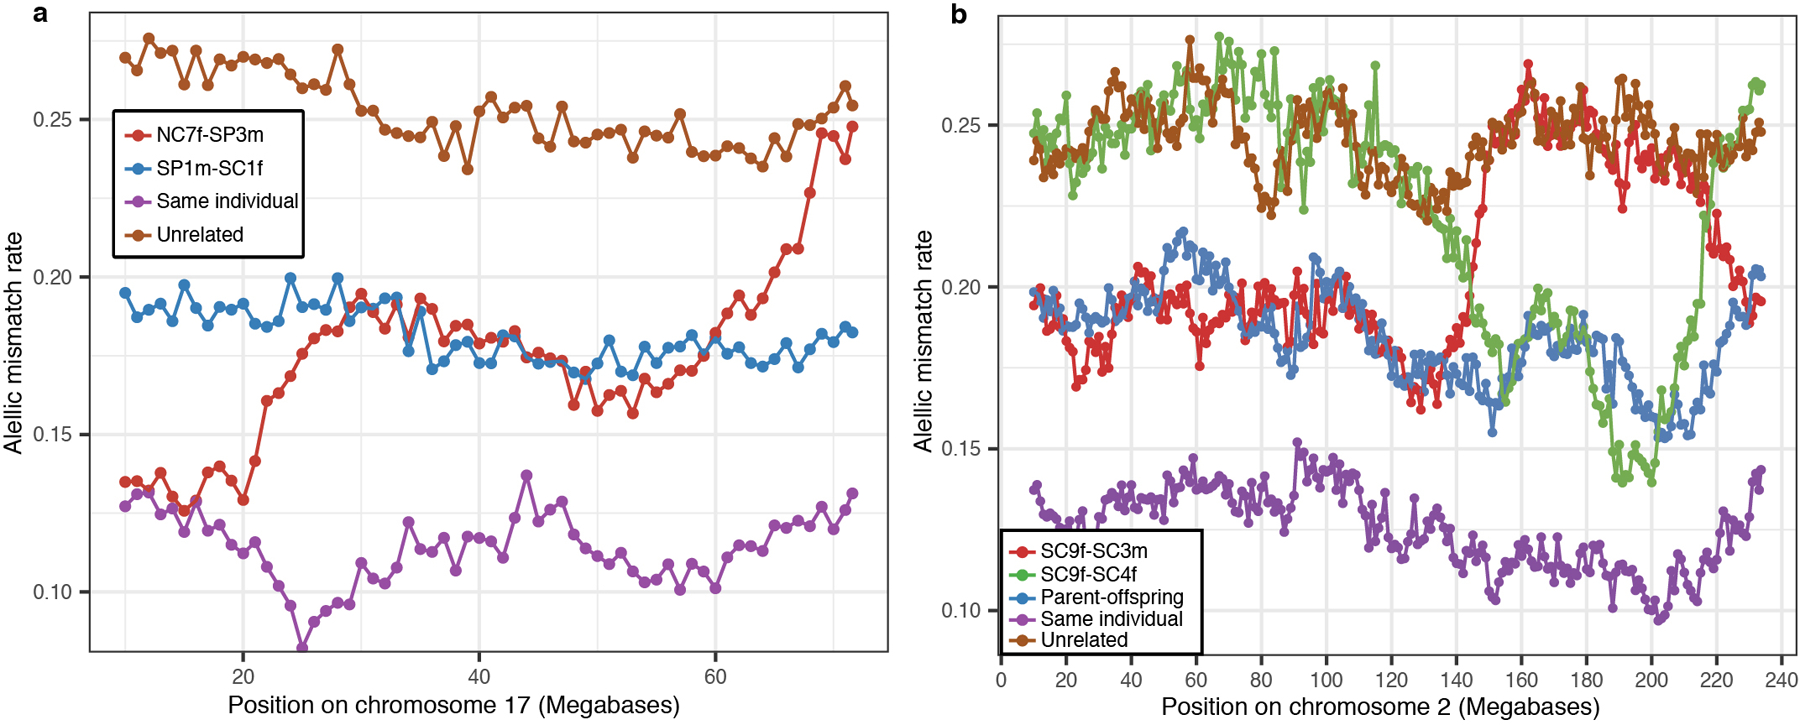
a, Differentiating between parent-offspring and sibling relationships. Allelic mismatch rate values across sliding windows of 20 Mb, moving by 1 Mb each step. As an example, we show values at chromosome 17 and include for reference a comparison between two unrelated Neolithic individuals from Britain (in brown), and a comparison between one individual and himself (in purple) to show how mismatch rates behave when two chromosomes are shared. The mismatch rate pattern for SP1m-SC1f is compatible with one chromosome shared along the entire chromosome 14 (in fact, along all autosomal chromosomes (Supplementary Table 6)), indicating a parent-offspring relationship. In contrast, the NC7f-SP3m comparison shows regions on chromosome 17 where no chromosome is shared (~65–70 Mb), other regions where two chromosomes are shared (~0–25 Mb) and other regions where one chromosome is shared (~25–60 Mb), compatible with a sibling relationship. b, Comparing DNA sharing patterns between SC9f and her paternal grandparents. We show mismatch rate values at chromosome 2 and include for reference a parent-offspring comparison (SE1m-SP2m; in blue) to show how mismatch rates behave when one chromosome is shared. Two recombination events (one at ~145 Mb and other at ~220 Mb) in SC9f’s father’s gamete result in SC9f’s sharing one chromosome with SC3m from the start of the chromosome to ~145 Mb, one chromosome with SC4f from 145 to 220 Mb and one chromosome with SC3m from 220 Mb to the end of the chromosome. This pattern of sharing one chromosome with either SC3m or SC4f at every location of the genome is characteristic of comparisons between a grandchild and his/her two grandparents and is also observed in the other autosomal chromosomes.
Extended Data Figure 4. Alternative family tree fitting all the genetic evidence except the IBD breakpoints co-localization analysis.
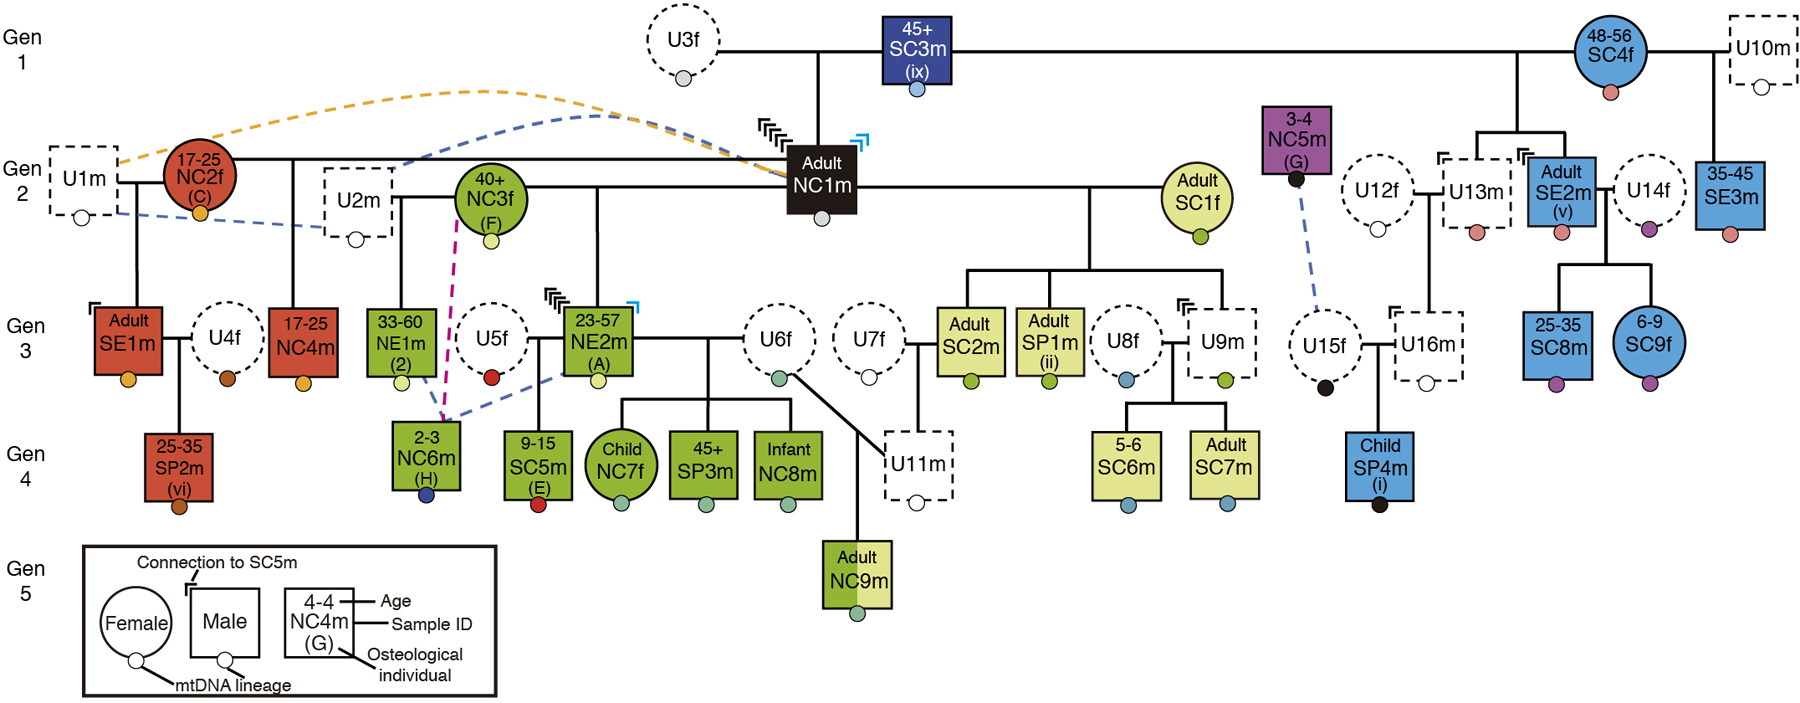
(Supplementary Section 2.4, Extended Data Figure 5). Individuals are coloured according to the female sub-lineage they belong to (NC1m and NC5m do not belong to any of the four major sub-lineages and are thus given a different color).
Extended Data Figure 5. Using co-localization of IBD breakpoints to disambiguate between family tree in Fig. 1c and family tree in Extended Data Fig. 4.
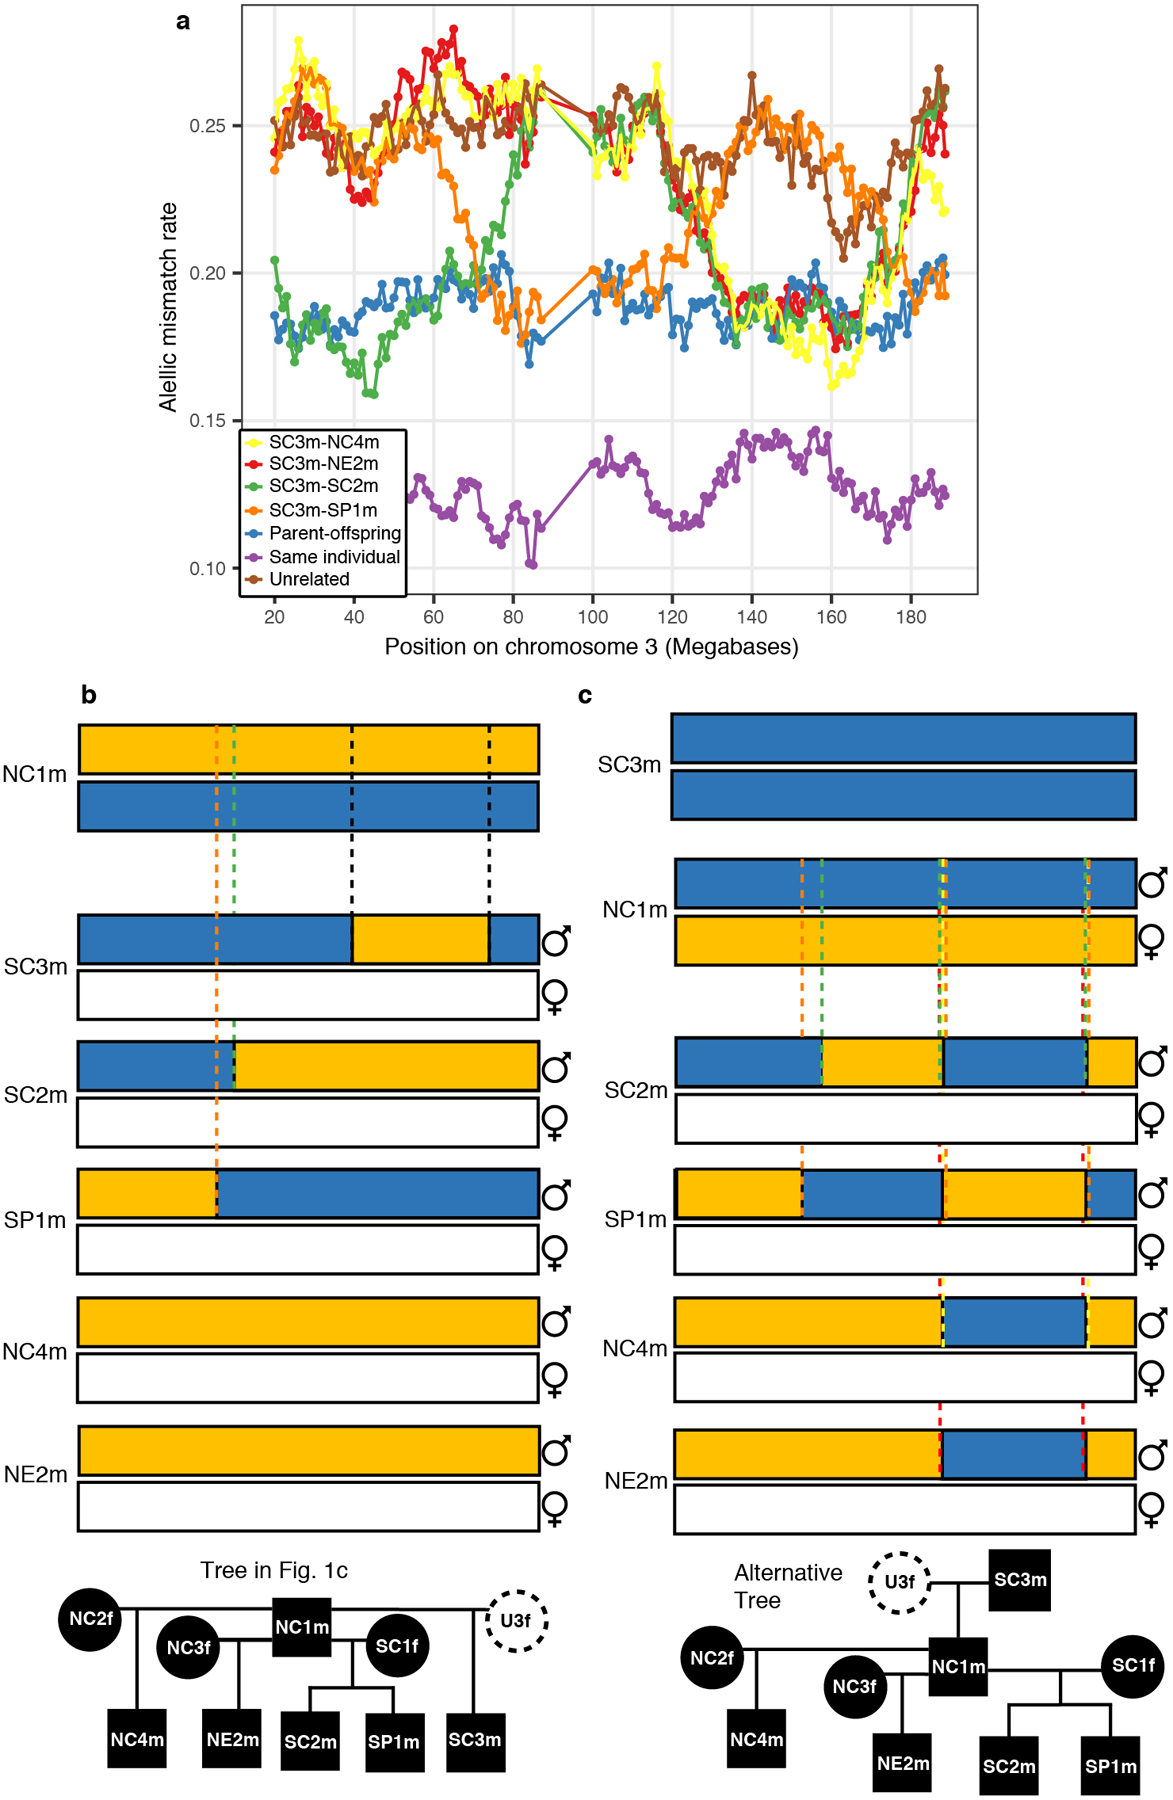
a, We show mismatch rate values across sliding windows of 20 Mb on chromosome 3, moving by 1 Mb each step, for comparisons between SC3m and his four second-degree relatives. Recombination events on chromosome 3 needed to explain the observed mismatch rate patterns under b, the scenario of tree in Fig 1c. where 4 recombination events are required or c, the scenario of the tree in Extended Data Fig.4 where 10 recombination events are required including the extremely implausible occurrence of two recombination events at the same genomic locations in four different gametes.
Extended Data Figure 6. Testing the validity of the family pedigree in Fig. 1c using X-chromosome relatedness and number of shared IBD segments.
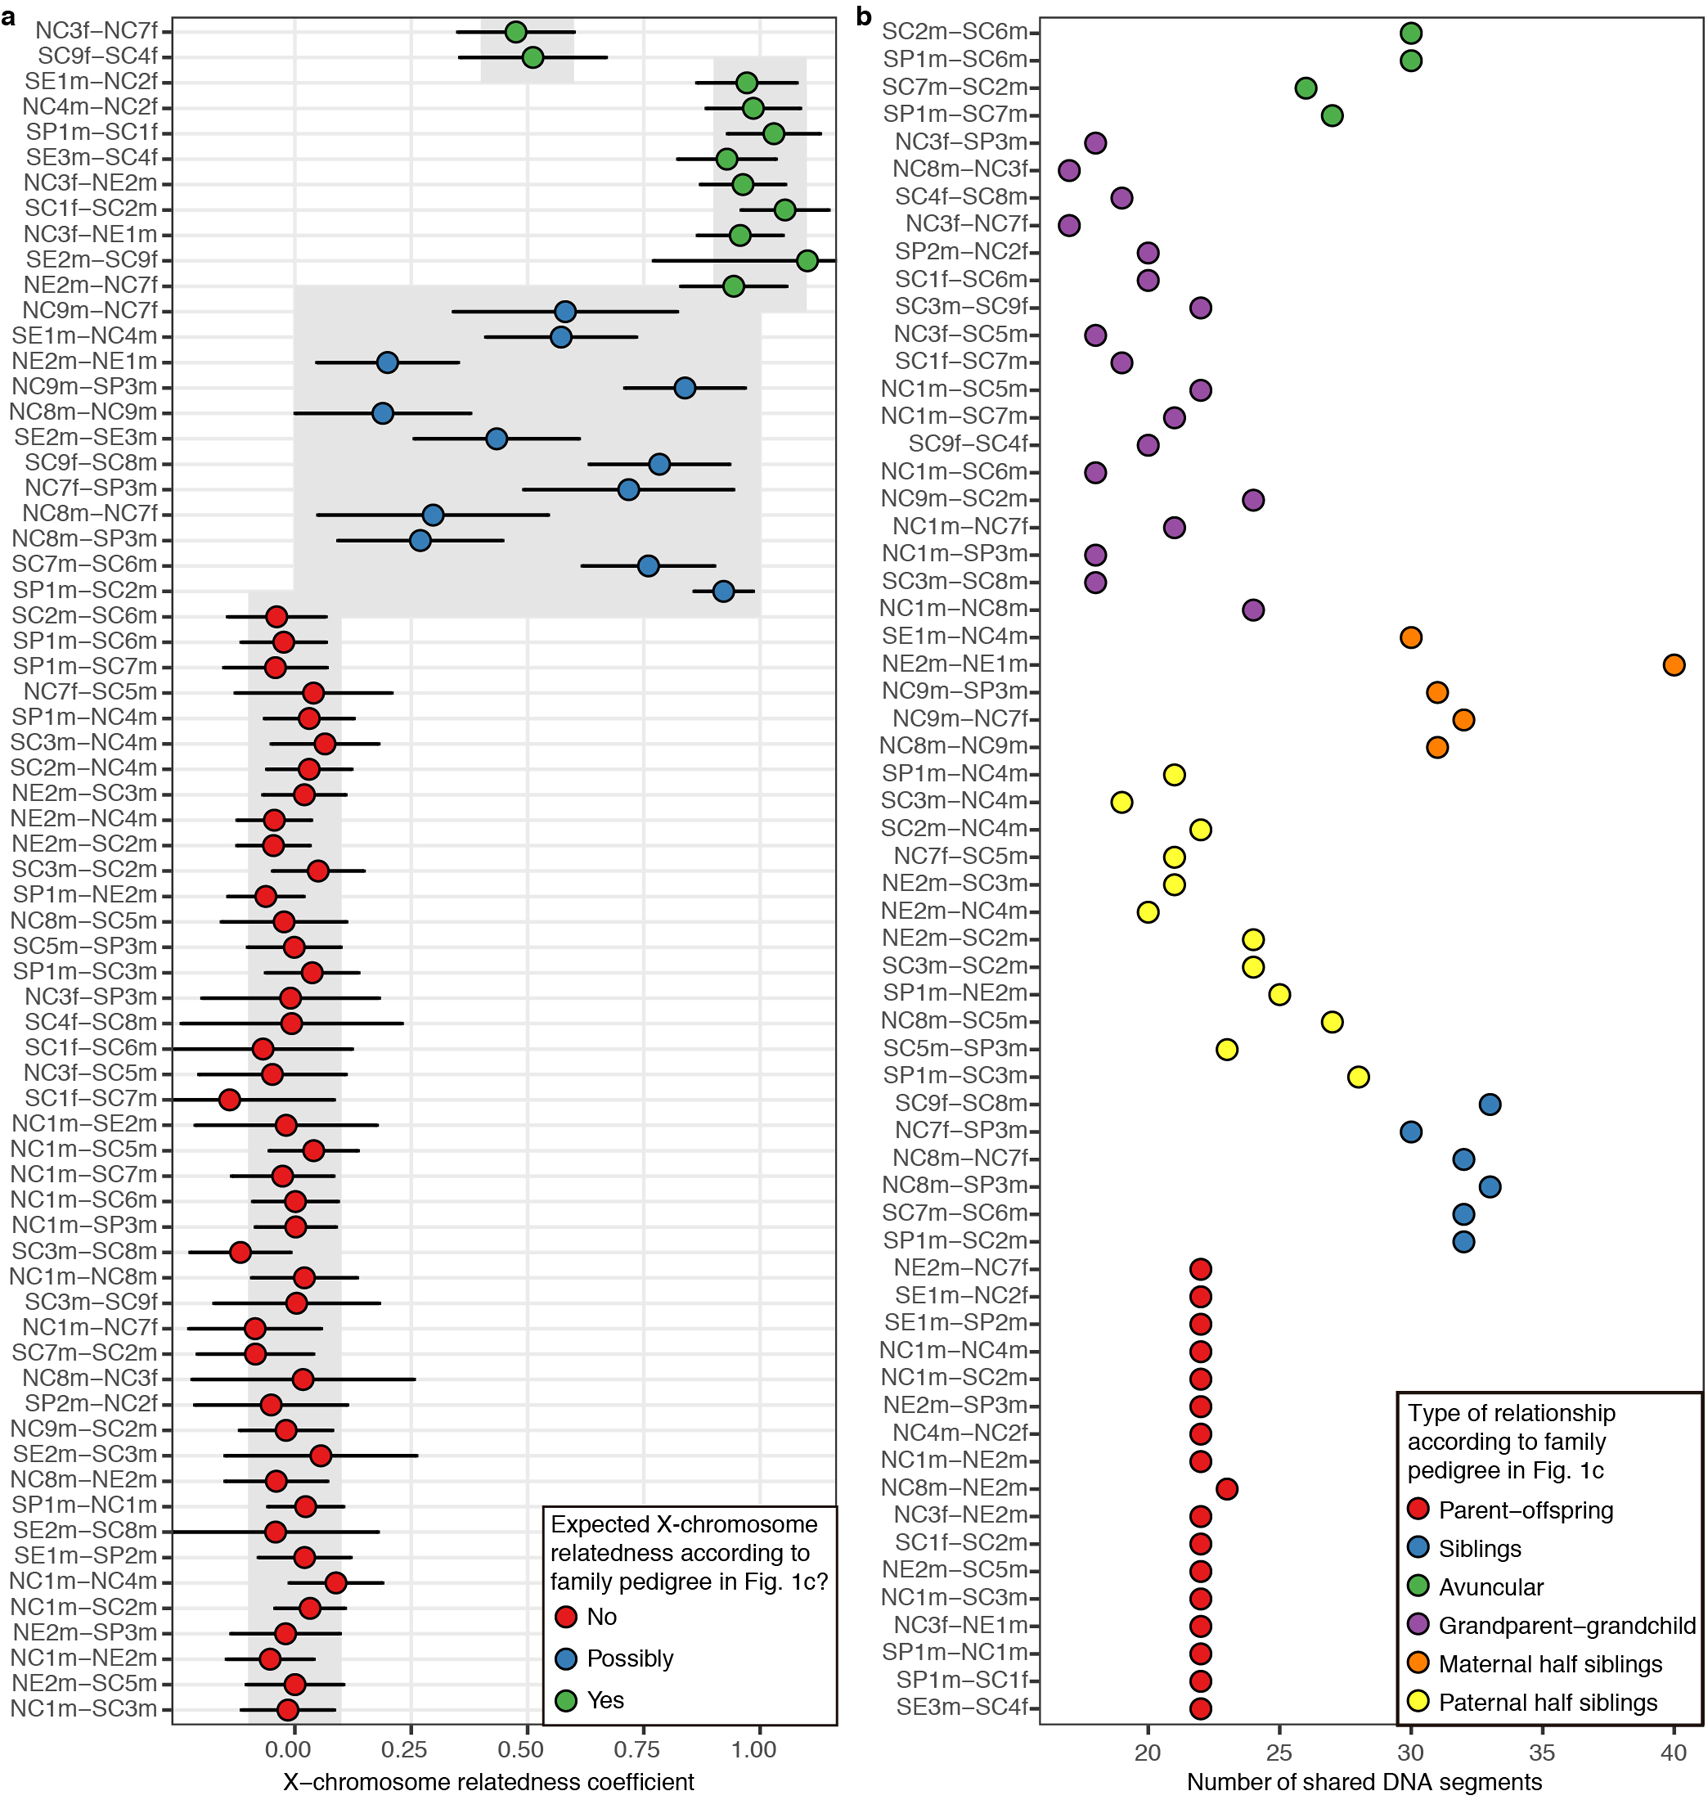
a, Relatedness coefficients in the X-chromosome for first and second degree relationships with more than 300 overlapping SNPs. For each comparison, expected values according to the type of relation in the family tree in Fig. 1c are shown in grey boxes. Bars represent 95% confidence intervals. b, Number of shared IBD segments for first- and second-degree relationships. Pairs are grouped according to their type of relation in the family tree in Fig. 1c.
Extended Data Figure 7. Testing the consistency of the kinship results using NgsRelate42.
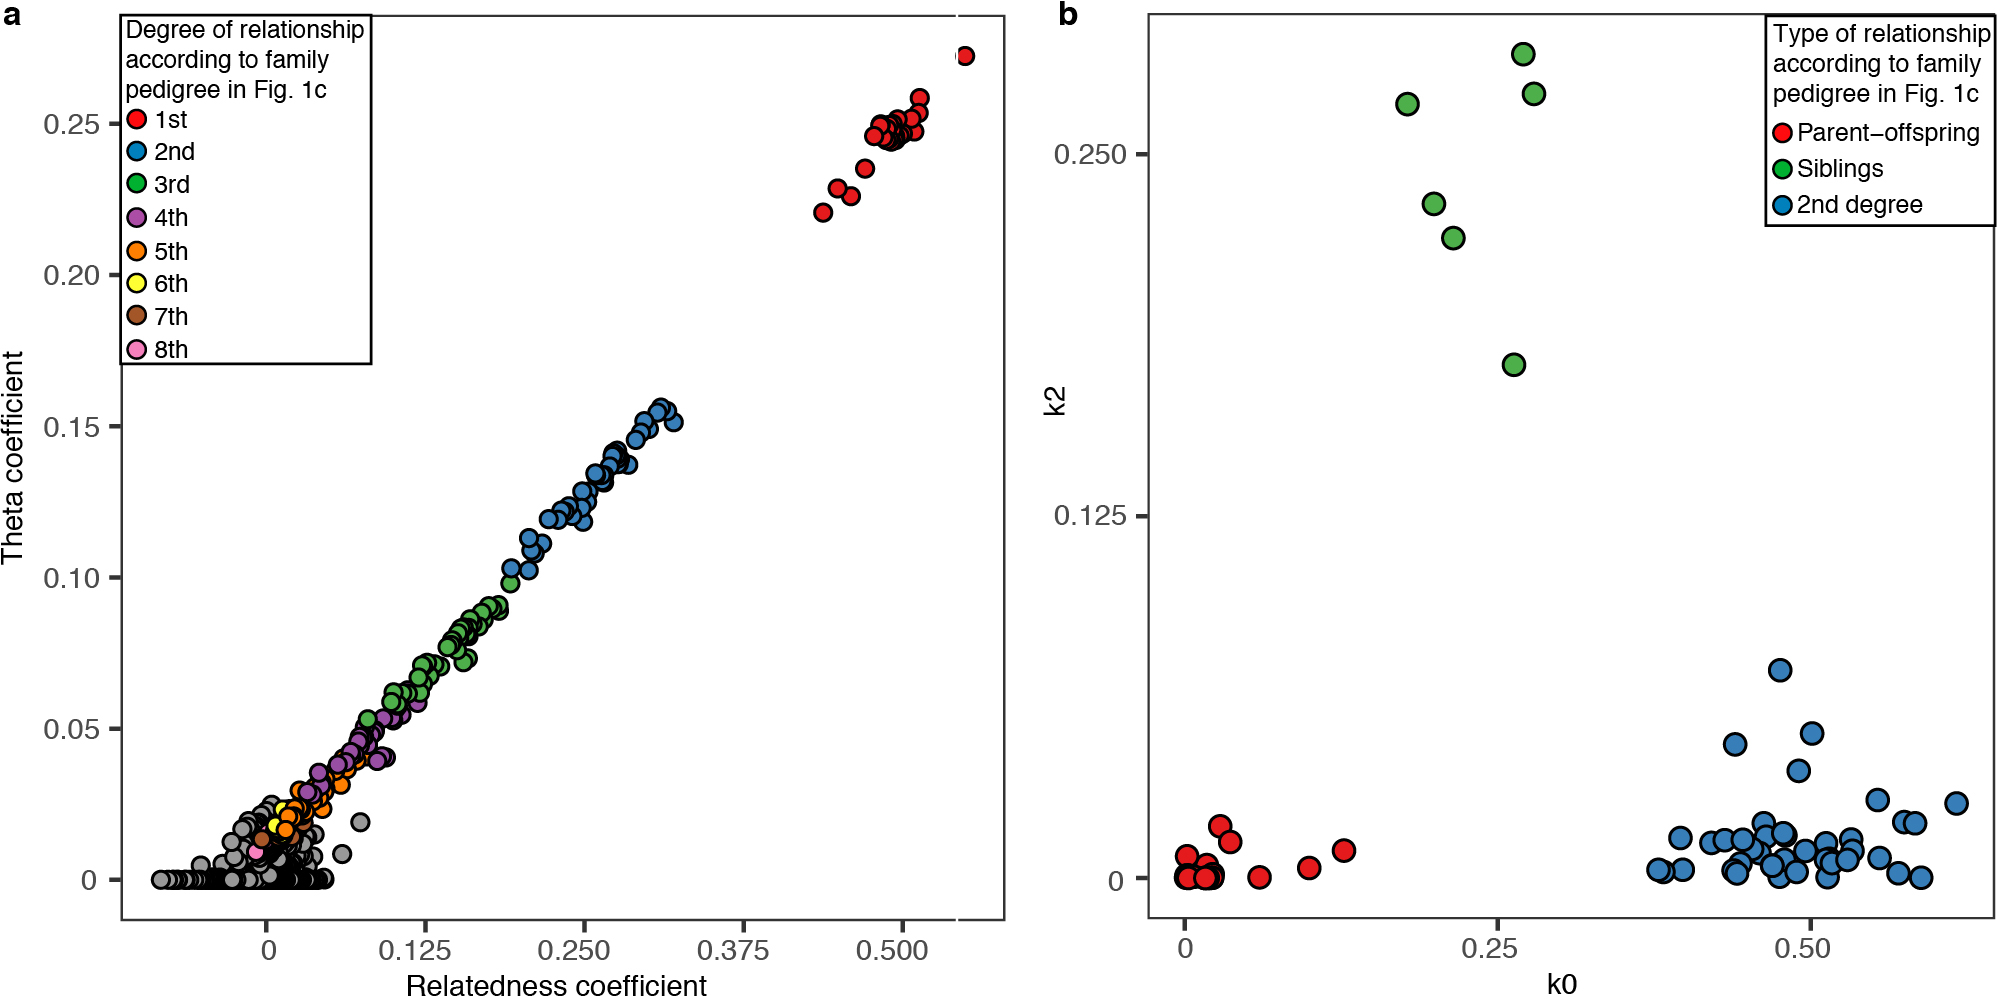
a, Correlation between the relatedness coefficient r and the Theta coefficient computed with NgsRelate, restricting to comparisons with more than 15,000 overlapping SNPs. b, Cotterman coefficients k0 and k2 for first and second degree relationships, as computed with NgsRelate.
Extended Data Figure 8. Comparing autosomal relatedness between reproductive partners, different male reproductive partners of a female and different female reproductive partners of a male.
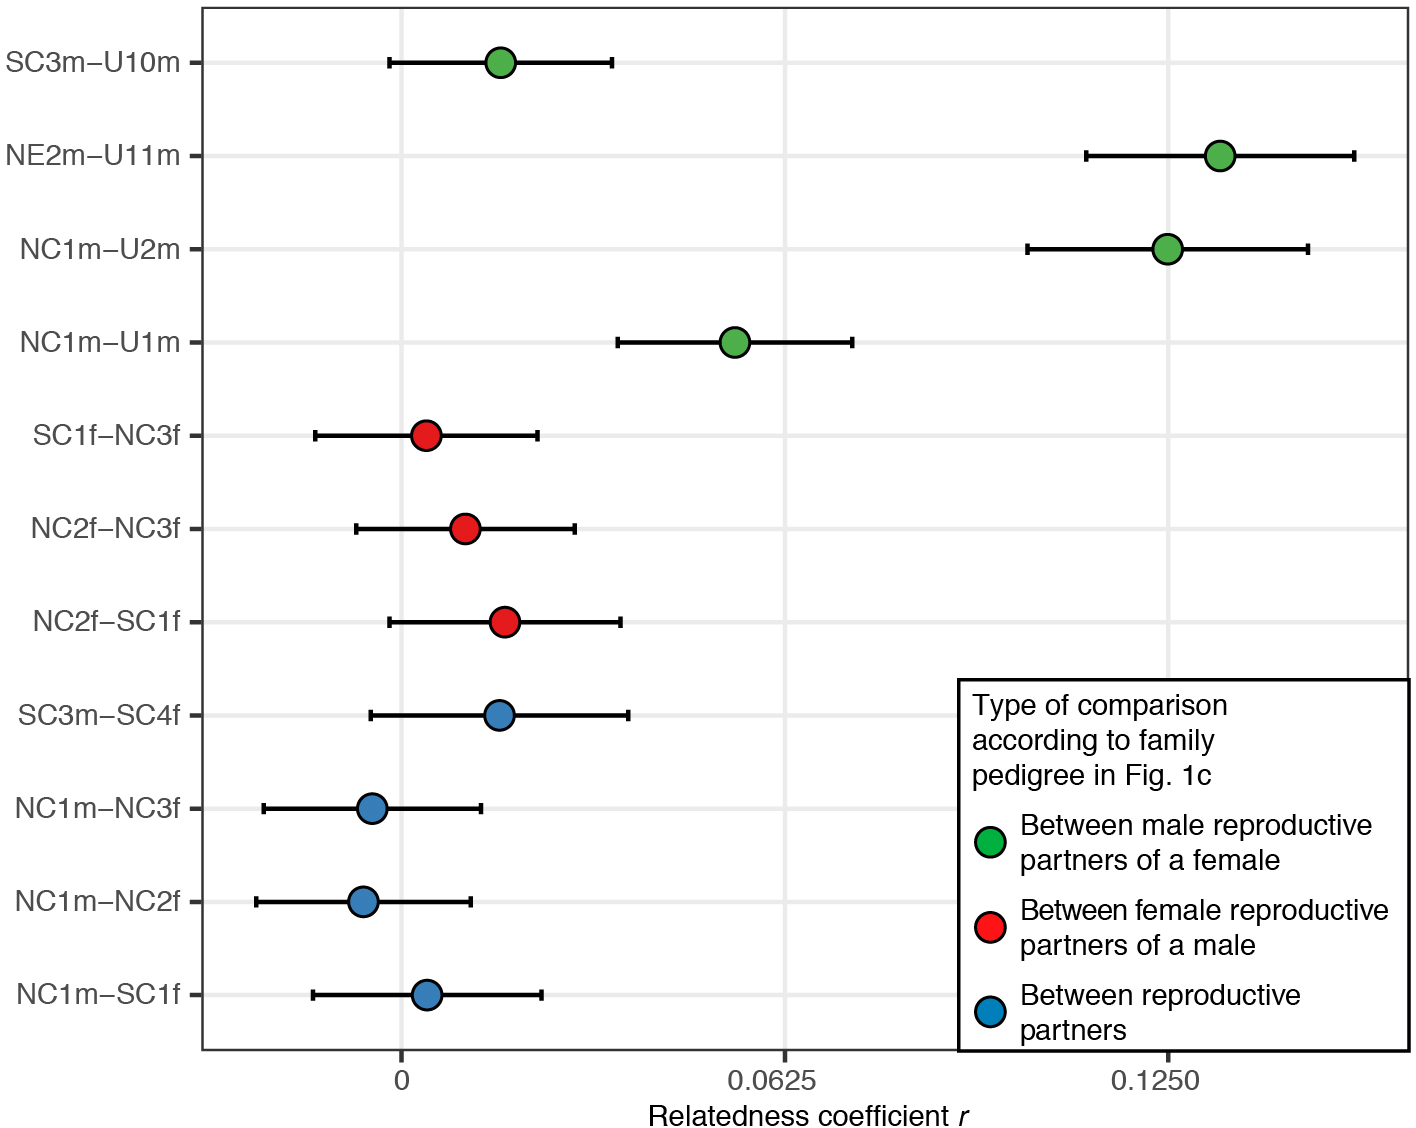
To estimate relatedness coefficients between unsampled and sampled male reproductive partners of a female, we doubled the relatedness coefficient obtained between the son of the unsampled male and the sampled male, to account for the fact that a son is one degree of relationship further away from their father’s relatives as compared to his father. Bars represent 95% confidence intervals.
Extended Data Figure 9. Principal Component Analysis and inbreeding analysis.
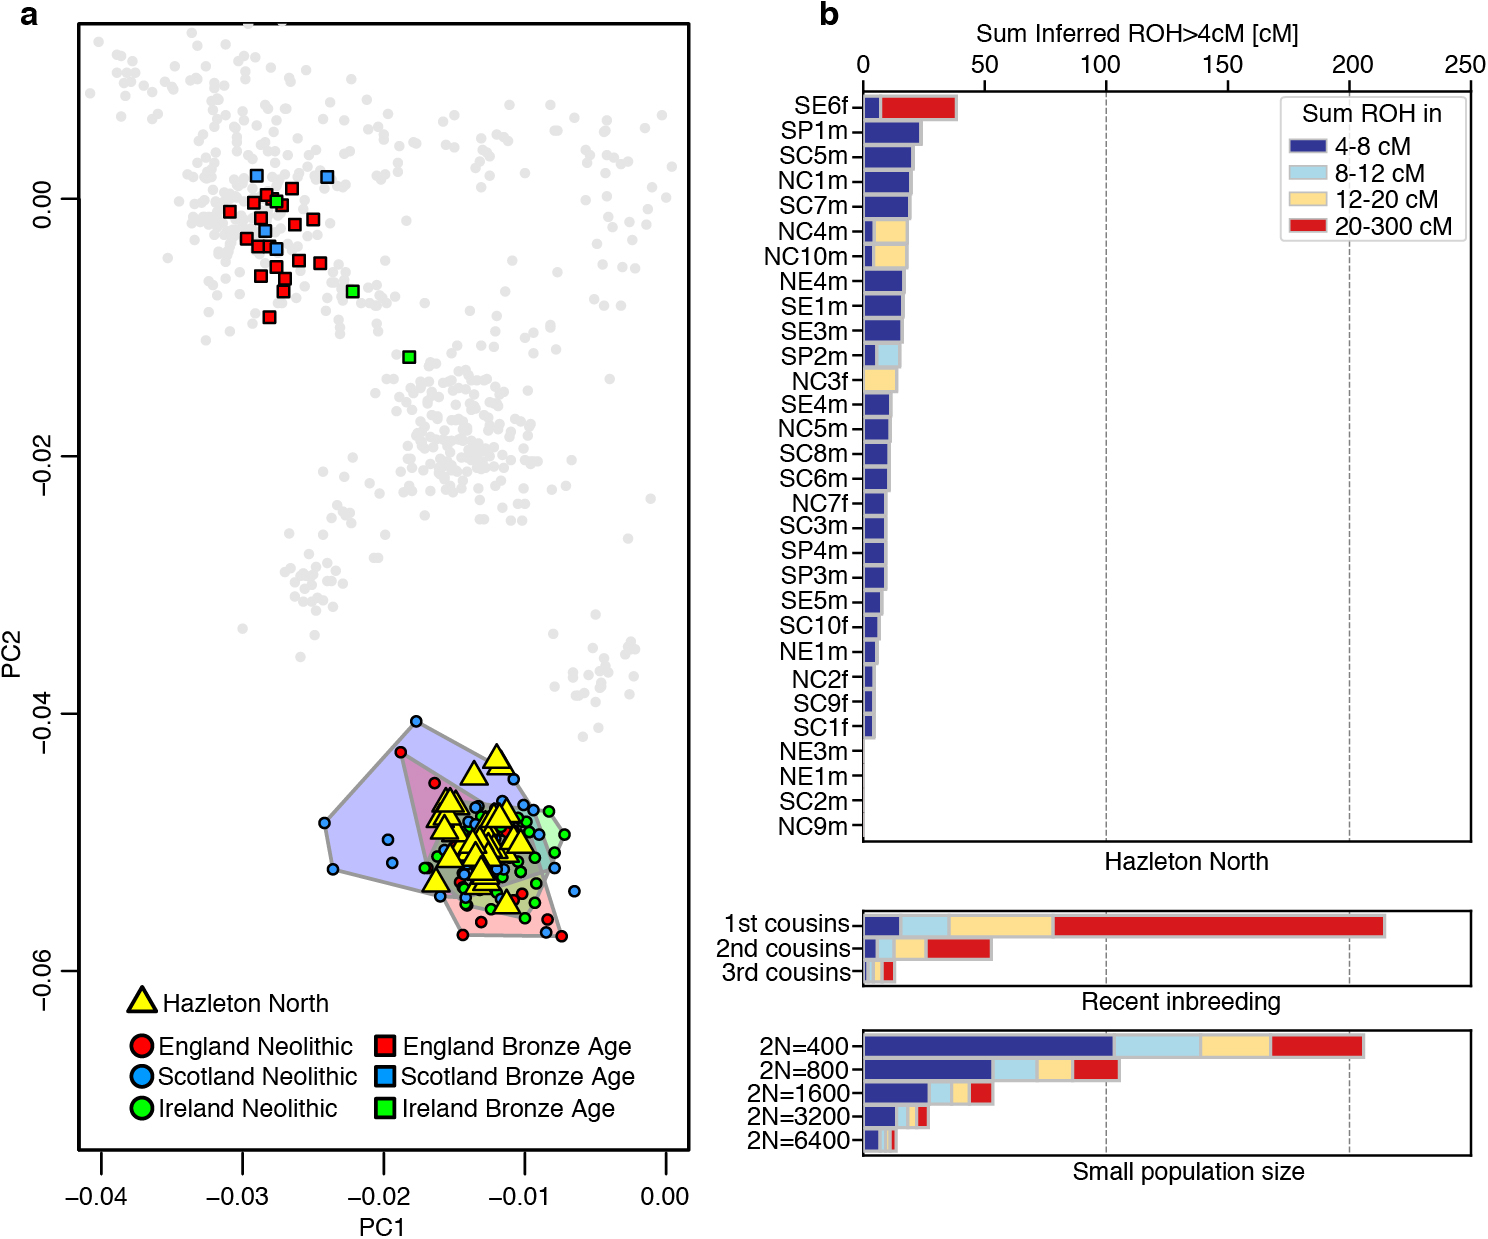
a, Principal component analysis of Hazleton North individuals and other ancient individuals from Britain and Ireland. Ancient individuals were projected onto the principal components computed on a set of present-day West Eurasians genotyped on the Human Origins Array (not shown in the figure). Individuals with fewer than 15,000 SNPs on the Human Origins dataset were excluded for this analysis. b, Runs of homozygosity (ROH) in different length categories for the Hazleton North individuals with higher than 400,000 SNPs covered. ROH were computed using hapROH47. On the right, we plot the expected ROH length distribution for the offspring of closely related parents in outbred populations and for individuals from populations with small effective population size47.
Extended Data Table 1.
Key details for sampled individuals.
| Unique identifier | Age-at-death | MtDNA haplogroup | Taphonomy & pathology | Main lineage key relationships |
|---|---|---|---|---|
|
| ||||
| NC1m | Adult | N1b1b | - | Father of SC2m & SP1m by SC1f; father of NC4m with NC2f(C); father of NE2m(A) with NC3f(F); father of SC3m(ix) by U3f. |
| NC2f(C) | 17–25 | U8b1b | Gn; CO, PH | Mother of NC4m by NC1m; mother of SE1m by U1m. |
| NC3f(F) | 40+ | K1a3a1 | OA, ankle trauma | Mother of NE2m(A) by NC1m & NE1m(2) by U2m. |
| NC4m | 17–25 | U8b1b | - | Son of NC2f(C) & NC1m; half-brother of SE1m. |
| NC5m(G) | 3–4 | T2e1 | Gn | Fourth degree relative of SP4m. |
| NC6m(H) | 2–3 | J2b1a | Gn; DA | Second-degree relative of NC3f(F); third degree relative of NE2m(A) & NE1m(2) |
| NC7f | Child | K1b1a | - | Daughter of NE2m(A) & U6f; sister of SP3m & NC8m; half-sister of SC5m(E). |
| NC8m | Infant, 18–24 months | K1b1a | - | Son of NE2m(A) & U6f; brother of NC7f & SP3m; half-brother of SC5m(E). |
| NC9m | Adult | K1b1a | - | Son of U6f & U11m. |
| NC10m | Adult | U3a1 | - | None |
| NE1m(2) | 33–60 | K1a3a1 | AMTL, OA, OD, TB?, DA | Son of NC3f(F) and U2m; half-brother of NE2m(A); ‘stepson’ of NC1m. |
| NE2m(A) | 23–57 | K1a3a1 | Gn; DISH, SA, OA | Son of NC1m & NC3f(F); half-brother of NE1m(2); father of SC5m by U5f & of NC7f, SP3m & NC8m by U6f. |
| NE3m(B) | 3–6 mths | V | - | None |
| NE4m(1) | c. 40 | K1a4 | Fr. L fibula, OA, DA, AMTL | None |
| SC1f | Adult | K2b1 | - | Mother of SC2m and SP1m by NC1m. |
| SC2m | Adult | K2b1 | - | Son of NC1m & SC1f, brother of SP1m. |
| SC3m(ix) | 45+ | W5 | Skull fr., OA, PD, DA, AMTL | Son of NC1m & U3f; father of U13m & SE2m(v) by SC4f. |
| SC4f | 48–56 | K1d | - | Mother of SE2m(v) & U13m by SC3m(ix); mother of SE3m by U10m. |
| SC5m(E) | 9–15 | H1 | - | Son of NE2m(A) & U5f; half-brother of SP3m, NC8m & NC7f. |
| SC6m | 5–6 | U5b1+16189+@16192 | Scurvy | Son of U8f & U9m, brother of SC7m. |
| SC7m | Adult | U5b1+16189+@16192 | - | Son of U8f & U9m; brother of SC6m. |
| SC8m | 25–35 | J1c1b1 | PD | Son of U14f and SE2m; sister of SC9f. |
| SC9f | 6–9 | J1c1b1 | Scurvy | Daughter of U14f and SE2m; sister of SC8m. |
| SC10f(viii) | 23–35 | K1b1a1d | CO, PH, AMTL | None |
| SE1m | Older adult | U8b1b | - | NC1m reproduced with his mother NC2f(C); father of SP2m(vi) by U4f; ‘stepson’ of NC1m. |
| SE2m(v) | Adult | Too little data | - | Son of SC4f & SC3m(ix); father of SC8m & SC9f. |
| SE3m | 35–45 | K1d | - | SC3m(ix) reproduced with his mother SC4f; ‘stepson’ of SC3m. |
| SE4m(D) | Adult | J1c1 | Fr. R ulna; polio?, twisted spine | None |
| SE5m | Adult | U5a2d | - | None |
| SE6f | Adult | U5b1+16189 | - | None |
| SP1m(ii) | 33–45 | K2b1 | - | Son of NC1m & SC1f, brother of SC2m. |
| SP2m(vi) | 25–35 | H5 | - | Son of SE1m (who was ‘stepson’ of NC1m). |
| SP3m | 45+ | K1b1a | PD, AMTL, DA | Son of NE2m(A) & U6f; brother of NC7f & NC8m; half-brother of SC5m(E). |
| SP4m(i) | Child | T2e1 | - | Son of U16m & U15f. |
| HN1f | - | K1b1a1 | - | None |
The individual code consists of the location of the remains, then a number for the individual within that location, and finally their sex. For those with an osteological code, this value is provided in parentheses. Full details, including bone element numbers, radiocarbon dates and stable isotope data are provided in Supplementary Table 1. Fr. = fracture; Gn. = gnawed by canids; AMTL = ante-mortem tooth loss; DA = dental abscess; DISH = Diffuse Idiopathic Skeletal Hyperostosis CO = cribra orbitalia; OA = osteoarthritis; OD = osteochondritis dissecans; PH = porotic hyperostosis; SA = septic arthritis.
Extended Data Table 2.
Statistically significant patterns in genetic data.
| Finding | Falsified null hypothesis | Data | P-value |
|---|---|---|---|
|
| |||
| Bias against female burial | Number of females and males buried at Hazleton not significantly different | 9 vs 26 | 0.00599 |
| Strict patrilineality | Number of matrilineal and patrilineal transmissions not significantly different | 0 vs 15 | 0.000061 |
| Strict bias against burial of adult daughters | Number of female and male adult offspring of unions in pedigree not significantly different | 0 vs 14 | 0.00012 |
| Differences in south/north placement in tomb of the four maternal sub-lineages | No association of tomb half and female sub-lineage | NC2f (2 south; 2 north) NC3f (2 south; 7 north) SC1f (5 south; 0 north) U3f (7 south; 0 north) |
0.00110 |
| Members of NC2f’s and NC3f’s sub-lineages stopped being buried in the north chamber later in the tomb’s use-life, possibly due to the wall collapse blocking access to the north chamber | No decrease in north chamber burials among members of NC2f’s and NC3f’s sub-lineages with a likely later death | Earlier death (6 north chamber; 0 other) Later death (1 north chamber; 6 other) |
0.00408 |
Two-sided binomial tests for rows 1–3, Fisher’s exact tests for row 4 (two-sided) and row 5 (one-sided). See Supplementary Section 3 and Supplementary Table 3 for details.
Supplementary Material
Acknowledgments
This work was supported by NIH grant GM100233, by the Allen Discovery Center program, a Paul G. Allen Frontiers Group advised program of the Paul G. Allen Family Foundation, by John Templeton Foundation grant 61220, by a gift from Jean-François Clin, and by the Howard Hughes Medical Institute. I.O. is supported by a Ramón y Cajal grant from Ministerio de Ciencia e Innovación, Spanish Government (RYC2019-027909-I). We thank James Harris and Alison Brookes at the Corinium Museum for providing permission to sample skeletal material from Hazleton North; Tom Booth, Alissa Mittnik, Harald Ringbauer and Alasdair Whittle for valuable discussions; and Nicole Adamski, Rebecca Bernardos, Guillerma Bravo, Kimberly Callan, Elizabeth Curtis, Ann Marie Lawson, Matthew Mah, Swapan Mallick, Adam Micco, Lijun Qiu, Kristin Stewardson, Anna Wagner, J. Noah Workman, and Fatma Zalzala for laboratory and bioinformatic work.
Footnotes
Competing interests The authors declare no competing interests.
References
- 1.Saville A Hazleton North, Gloucestershire, 1979–82 : the excavation of a Neolithic long cairn of the Cotswold-Severn group. (Historic Buildings & Monuments Commission for England, 1990). [Google Scholar]
- 2.Brace S et al. Ancient genomes indicate population replacement in Early Neolithic Britain. Nat. Ecol. Evol. 3, 765–771 (2019). [DOI] [PMC free article] [PubMed] [Google Scholar]
- 3.Olalde I et al. The Beaker phenomenon and the genomic transformation of northwest Europe. Nature 555, 190–196 (2018). [DOI] [PMC free article] [PubMed] [Google Scholar]
- 4.Cassidy LM et al. A dynastic elite in monumental Neolithic society. 582, (2020). [DOI] [PMC free article] [PubMed] [Google Scholar]
- 5.Mittnik A et al. Kinship-based social inequality in Bronze Age Europe. Science 366, 731–734 (2019). [DOI] [PubMed] [Google Scholar]
- 6.Yaka R et al. Variable kinship patterns in Neolithic Anatolia revealed by ancient genomes. Curr. Biol. 31, 2455–2468.e18 (2021). [DOI] [PMC free article] [PubMed] [Google Scholar]
- 7.Amorim CEG et al. Understanding 6th-Century Barbarian Social Organization and Migration through Paleogenomics. Nat. Commun. 9, (2018). [DOI] [PMC free article] [PubMed] [Google Scholar]
- 8.Sánchez-Quinto F et al. Megalithic tombs in western and northern Neolithic Europe were linked to a kindred society. Proc. Natl. Acad. Sci. U. S. A. 116, 9469–9474 (2019). [DOI] [PMC free article] [PubMed] [Google Scholar]
- 9.Scheib CL et al. East Anglian early Neolithic monument burial linked to contemporary Megaliths. Ann. Hum. Biol. 46, 145–149 (2019). [DOI] [PMC free article] [PubMed] [Google Scholar]
- 10.Schneider DM A critique of the study of kinship. (Ann Arbor : University of Michigan Press, 1984). [Google Scholar]
- 11.Carsten J After Kinship. (Cambridge University Press, 2003). doi: 10.1017/CBO9780511800382 [DOI] [Google Scholar]
- 12.Brück J Ancient DNA, kinship and relational identities in Bronze Age Britain. Antiquity 95, 228–237 (2021). [Google Scholar]
- 13.Meadows J, Barclay A & Bayliss A A short passage of time: The dating of the hazleton long cairn revisited. Cambridge Archaeol. J. 17, 45–64 (2007). [Google Scholar]
- 14.Rowley-Conwy P & Legge T Subsistence practices in western and northern Europe. In The Oxford Handbook of Neolithic Europe (eds. Fowler C, Hofmann D & Harding J) 429–446. (Oxford University Press, 2015). [Google Scholar]
- 15.Cuthbert GS Enriching the neolithic : The forgotten people of the barrows. (University o, 2018). [Google Scholar]
- 16.Rogers J et al. The human skeletal material. In Hazleton North: The excavation of a Neolithic long cairn of the Cotswold-Severn group 182–198 (Liverpool University Press, 1990). [Google Scholar]
- 17.Hedges R, Saville A & O’Connell T Characterizing the diet of individuals at the Neolithic chambered tomb of Hazleton North, Gloucestershire, England, using stable isotopic analysis. Archaeometry 50, 114–128 (2008). [Google Scholar]
- 18.Charlton S et al. New insights into Neolithic milk consumption through proteomic analysis of dental calculus. Archaeol. Anthropol. Sci. 11, 6183–6196 (2019). [Google Scholar]
- 19.Neil S, Evans J, Montgomery J & Scarre C Isotopic evidence for residential mobility of farming communities during the transition to agriculture in Britain. R. Soc. Open Sci 3, (2016). [DOI] [PMC free article] [PubMed] [Google Scholar]
- 20.Smith M & Brickley M People of the Long Barrows: Life, Death and Burial in Earlier Neolithic Britain. (The History Press, 2009). [Google Scholar]
- 21.Surowiec A, Snyder KT & Creanza N A worldwide view of matriliny: Using cross-cultural analyses to shed light on human kinship systems. Philos. Trans. R. Soc. B Biol. Sci 374, (2019). [DOI] [PMC free article] [PubMed] [Google Scholar]
- 22.Fowler C Social arrangements: kinship, descent and affinity in the mortuary architecture of Early Neolithic Britain and Ireland. Archaeol. Dialogues (In Press, 2021). [Google Scholar]
- 23.Robb J & Harris OJT Becoming gendered in european prehistory: Was neolithic gender fundamentally different? Am. Antiq. 83, 128–147 (2018). [Google Scholar]
- 24.Stone L & King DE Kinship and Gender: An Introduction. (Routledge, 2018). [Google Scholar]
- 25.Robb J What can we really say about skeletal part representation, MNI and funerary ritual? A simulation approach. J. Archaeol. Sci. Reports 10, 684–692 (2016). [Google Scholar]
- 26.Rohland N, Glocke I, Aximu-Petri A & Meyer M Extraction of highly degraded DNA from ancient bones, teeth and sediments for high-throughput sequencing. Nat. Protoc. 13, 2447–2461 (2018). [DOI] [PubMed] [Google Scholar]
- 27.Gansauge MT, Aximu-Petri A, Nagel S & Meyer M Manual and automated preparation of single-stranded DNA libraries for the sequencing of DNA from ancient biological remains and other sources of highly degraded DNA. Nat. Protoc. 15, 2279–2300 (2020). [DOI] [PubMed] [Google Scholar]
- 28.Rohland N, Harney E, Mallick S, Nordenfelt S & Reich D Partial uracil – DNA – glycosylase treatment for screening of ancient DNA. Philos. Trans. R. Soc. London B 370, (2015). [DOI] [PMC free article] [PubMed] [Google Scholar]
- 29.Fu Q et al. An early modern human from Romania with a recent Neanderthal ancestor. Nature 524, 216–219 (2015). [DOI] [PMC free article] [PubMed] [Google Scholar]
- 30.Fu Q et al. DNA analysis of an early modern human from Tianyuan Cave, China. Proc. Natl. Acad. Sci. U. S. A. 110, 2223–7 (2013). [DOI] [PMC free article] [PubMed] [Google Scholar]
- 31.Olalde I et al. The genomic history of the Iberian Peninsula over the past 8000 years. Science 363, 1230–1234 (2019). [DOI] [PMC free article] [PubMed] [Google Scholar]
- 32.Li H & Durbin R Fast and accurate short read alignment with Burrows–Wheeler transform. Bioinformatics 25, 1754–1760 (2009). [DOI] [PMC free article] [PubMed] [Google Scholar]
- 33.Korneliussen TS, Albrechtsen A & Nielsen R ANGSD : Analysis of Next Generation Sequencing Data. BMC Bioinformatics 15, 1–13 (2014). [DOI] [PMC free article] [PubMed] [Google Scholar]
- 34.Fu Q et al. A revised timescale for human evolution based on ancient mitochondrial genomes. Curr. Biol. 23, 553–9 (2013). [DOI] [PMC free article] [PubMed] [Google Scholar]
- 35.Weissensteiner H et al. HaploGrep 2: mitochondrial haplogroup classification in the era of high-throughput sequencing. Nucleic Acids Res. 44, W58–63 (2016). [DOI] [PMC free article] [PubMed] [Google Scholar]
- 36.Kennett DJ et al. Archaeogenomic evidence reveals prehistoric matrilineal dynasty. Nat. Commun. 8, 14115 (2017). [DOI] [PMC free article] [PubMed] [Google Scholar]
- 37.van de Loosdrecht M et al. Pleistocene North African genomes link Near Eastern and sub-Saharan African human populations. Science 360, 548–552 (2018). [DOI] [PubMed] [Google Scholar]
- 38.Busing FMTA, Meijer E & Van Der Leeden R Delete- m Jackknife for Unequal m. Stat. Comput. 9, 3–8 (1999). [Google Scholar]
- 39.Monroy Kuhn JM, Jakobsson M & Günther T Estimating genetic kin relationships in prehistoric populations. PLoS One 13, 1–21 (2018). [DOI] [PMC free article] [PubMed] [Google Scholar]
- 40.Williams C et al. A rapid, accurate approach to inferring pedigrees in endogamous populations. 1–27 (2020). [Google Scholar]
- 41.Kong A et al. Fine-scale recombination rate differences between sexes, populations and individuals. Nature 467, 1099–1103 (2010). [DOI] [PubMed] [Google Scholar]
- 42.Hanghøj K, Moltke I, Andersen PA, Manica A & Korneliussen TS Fast and accurate relatedness estimation from high-throughput sequencing data in the presence of inbreeding. Gigascience 8, 1–9 (2019). [DOI] [PMC free article] [PubMed] [Google Scholar]
- 43.Patterson N et al. Ancient admixture in human history. Genetics 192, 1065–93 (2012). [DOI] [PMC free article] [PubMed] [Google Scholar]
- 44.Cassidy LM et al. Neolithic and Bronze Age migration to Ireland and establishment of the insular Atlantic genome. Proc. Natl. Acad. Sci. U. S. A. 113, 1–6 (2016). [DOI] [PMC free article] [PubMed] [Google Scholar]
- 45.Lazaridis I et al. Ancient human genomes suggest three ancestral populations for present-day Europeans. Nature 513, 409–413 (2014). [DOI] [PMC free article] [PubMed] [Google Scholar]
- 46.Biagini SA et al. People from Ibiza: an unexpected isolate in the Western Mediterranean. Eur. J. Hum. Genet. 941–951 (2019). [DOI] [PMC free article] [PubMed] [Google Scholar]
- 47.Ringbauer H, Novembre J & Steinrücken M Parental relatedness through time revealed by runs of homozygosity in ancient DNA. Nat. Commun. 12, 5425 (2021) [DOI] [PMC free article] [PubMed] [Google Scholar]
Associated Data
This section collects any data citations, data availability statements, or supplementary materials included in this article.
Supplementary Materials
Data Availability Statement
The aligned sequences are available through the European Nucleotide Archive, accession PRJEB46958; the genotype dataset is available as supplementary material.


