

Abstract
Objectives:
Less than half of US adults with hypertension have controlled blood pressure (BP). Higher body mass index (BMI) is associated with an increased risk for hypertension, but the association between BMI and BP control is not well characterized. We examined hypertension awareness, antihypertensive medication use, and BP control, by BMI category.
Methods:
Data for 3,568 US adults aged ≥18 years with hypertension (BP ≥140/90 mmHg or taking antihypertensive medication) from the 2015–2018 National Health and Nutrition Examination Survey were analyzed. BMI was categorized as normal (<25 kg/m2), overweight (25-<30 kg/m2), class 1 obesity (30-<35 kg/m2), or class 2 or 3 obesity (≥35 kg/m2). Hypertension awareness and antihypertensive medication use were self-reported. BP control was defined as BP <140/90 mmHg using the average of up to three measurements.
Results:
Among US adults with hypertension, 15.6% had normal BMI, 31.3% had overweight, 26.2% had class 1 obesity, and 26.8% had class 2 or 3 obesity. Among those with normal BMI, overweight, class 1 obesity, and class 2 or 3 obesity: 67.9%, 76.8%, 84.0%, and 87.8% were aware they had hypertension, respectively; 88.1%, 88.1%, 90.9%, and 90.2% of those aware were taking antihypertensive medication, respectively; 63.5%, 65.9%, 71.1%, and 64.1% of those taking antihypertensive medication had controlled BP, respectively; and 37.1%, 44.3%, 53.8%, and 50.8% of those with hypertension had controlled BP, respectively.
Conclusions:
US adults with hypertension and normal BMI were less likely to be aware they had hypertension and have controlled BP compared to those with overweight or obesity.
Keywords: blood pressure, hypertension, body mass index, obesity
INTRODUCTION
Hypertension is a leading preventable cause of death and disability in the US and worldwide [1,2]. Nearly one-third of US adults have hypertension, defined by systolic blood pressure (SBP) ≥140 mmHg, diastolic blood pressure (DBP) ≥ 90 mmHg, or taking antihypertensive medication, and only 43.7% of those with hypertension have controlled blood pressure (BP), defined by SBP <140 mmHg and DBP <90 mmHg [3]. Over 70% of US adults are overweight or obese, defined by a body mass index (BMI) of 25 to <30 kg/m2 or BMI ≥30 kg/m2, respectively [4]. Overweight and obesity increase the risk of developing hypertension through multiple pathophysiologic mechanisms [5–7] and the prevalence of hypertension increases at higher levels of BMI [8,9].
Antihypertensive medication reduces cardiovascular disease (CVD) risk to a similar extent in adults with normal weight, overweight and obesity [10]. Therefore, achieving BP control is important for adults with hypertension, irrespective of BMI. However, several studies have reported hypertension may be diagnosed and treated less often in individuals with normal BMI than those with overweight or obesity [8,11,12]. In adults with obesity, the pharmacodynamics and pharmacokinetics of certain medications may be altered, potentially resulting in more drug classes being needed to control BP at higher levels of BMI [6,13].
Identifying the association of weight status with awareness, treatment, and control of hypertension may reveal gaps in care. We used data from the 2015–2018 National Health and Nutrition Examination Survey (NHANES) to examine hypertension awareness, antihypertensive medication use among those aware of their hypertension, BP control among those taking antihypertensive medication, and BP control among all adults with hypertension by level of BMI including those with normal weight, overweight, and obesity.
METHODS
Data source
NHANES is a population-based survey conducted by the National Center for Health Statistics of the Centers for Disease Control and Prevention that uses stratified, multistage probability sampling to produce nationally representative estimates of the health and nutritional status of the civilian, noninstitutionalized US population [14]. Since 1999–2000, the survey has been conducted in 2-year cycles. To obtain stable prevalence estimates, we pooled data from 2015–2016 and 2017–2018 for this analysis. NHANES was approved by the National Center for Health Statistics Institutional Review Board and written informed consent was obtained from all participants.
Study population
The population for the current analysis included participants aged ≥18 years who completed the in-home interview and physical examination (N=11,268). We excluded participants who were pregnant (N=125), did not have at least one valid BP measurement (N=467), and were missing information on antihypertensive medication use (N=19). We also excluded individuals missing information on other covariates, except income for which we denoted missing as an indicator due to the large number of missing observations (N=1,407). The final analytic sample included 9,250 participants.
BP measurement
BP was measured using a standardized protocol during the NHANES examination by trained study physicians [15]. After five minutes of seated rest, up to three BP measurements were taken using a mercury sphygmomanometer and appropriately sized cuff. A fourth attempt was made if an earlier measurement was interrupted or incomplete. We calculated the mean SBP and DBP for each participant using all available measurements [16]. Study physicians were certified to measure BP after completing a training program, which included practice listening to Korotkoff sounds using a standardized audio-video tape presentation and practice measuring BP on volunteers, and were recertified quarterly [15].
The subpopulation with hypertension was defined as those who had SBP ≥140 mmHg, DBP ≥90 mmHg, or self-reported taking antihypertensive medication (N=3,568). In supplemental analyses, we defined the population with hypertension as those who had SBP ≥130 mmHg, DBP ≥80 mmHg, or self-reported taking antihypertensive medication, based on the 2017 American College of Cardiology (ACC)/American Heart Association (AHA) guideline definition (N=4,871) [17].
Outcomes
Outcomes were hypertension awareness, antihypertensive medication use among those who were aware of their hypertension, and BP control among those who were taking antihypertensive medication and among the overall population with hypertension. Among those with hypertension, awareness was defined by an affirmative response to the question, “Have you ever been told by a doctor or other healthcare professional that you had hypertension, also called high blood pressure?” Among those who were aware of their hypertension, antihypertensive medication use was defined by affirmative responses to the questions, “Because of your high blood pressure/hypertension, have you ever been told to take prescribed medicine?” and “Are you now taking prescribed medicine for high blood pressure?” BP control was defined as SBP <140 mmHg and DBP <90 mmHg in the primary analyses and SBP <130 mmHg and DBP <80 mmHg in the supplemental analyses.
Body mass index
Height and weight were measured during the NHANES examination following a standardized protocol using calibrated equipment. BMI was calculated as weight in kilograms divided by height in meters squared. We defined normal BMI as <25 kg/m2, overweight as 25 to <30 kg/m2, class 1 obesity as 30 to <35 kg/m2, class 2 obesity as 35 to <40 kg/m2, and class 3 obesity as ≥40 kg/m2 [18]. To increase the stability of our estimates, we combined class 2 and class 3 obesity into one category.
Participant characteristics
We included variables we hypothesized might confound the association between BMI and the outcomes. Demographic characteristics, socioeconomic factors, health care access, and health behaviors were self-reported. Age was categorized as 18–44, 45–64, 65–74, and ≥75 years. Sex was categorized as male or female. Race/ethnicity was categorized as non-Hispanic white, non-Hispanic Black, Hispanic, non-Hispanic Asian, or other. Measures of socioeconomic status included education categorized as less than high school graduate, high school degree or GED, or more than high school degree, and income-to-poverty ratio categorized as not in poverty (>1.3), borderline poverty (>1–1.3), poverty (<1), or unknown. Family income-to-poverty ratio was calculated in NHANES by dividing each participant’s family income in the past year by the poverty threshold in the US Department of Health and Human Services poverty guideline, which is based on family size and geographic region of residence for the specific survey year. Measures of health care access included having health insurance, having a usual site to receive health care, and the number of health care visits in the past year categorized as 0, 1–3, ≥4. Health behaviors included current smoking, alcohol use categorized as never, former, or current drinker, and physical activity categorized as performing any moderate to vigorous work or leisure time activity.
Diabetes diagnosis was based on self-report. Chronic kidney disease (CKD) was defined as having creatinine-based estimated glomerular filtration rate (eGFR) <60 mL/min/1.73m2 using the 2021 Chronic Kidney Disease Epidemiology Collaboration (CKD-EPI) equation [19] or urinary albumin-to-creatinine ratio ≥30 mg/g. Cardiovascular disease was based on self-reported history of coronary heart disease, heart failure, myocardial infarction, or stroke.
Analysis
We calculated the proportion of adults with hypertension in each BMI category by age group (18–44, 45–64, 65–74, and ≥75 years). Among adults with hypertension, we estimated the BMI distribution and calculated characteristics of individuals in each BMI category. We calculated the mean SBP and DBP by BMI category among those with hypertension overall, as well as by awareness, treatment, and control status.
In each BMI category, we calculated the age-adjusted proportion and the number of adults with hypertension, aware of their hypertension, taking antihypertensive medication among those who were aware, and with controlled BP among those taking antihypertensive medication and among those with hypertension overall. Age adjustment was performed by direct standardization using the age distribution of adults with hypertension in 2015–2018 as the standard. The age categories used were 18–44 (12.9%), 45–64 (46.6%), 65–74 (23.0%), and ≥75 years (17.5%). In addition, we estimated these proportions within each age group, as well as by sex and race/ethnicity.
Among those with hypertension, we used Poisson regression with robust variance estimates to calculate prevalence ratios (PR) for hypertension awareness, antihypertensive medication use among those who were aware they had hypertension, and BP control among those who were taking antihypertensive medication and among the overall population with hypertension associated with normal weight, overweight and class 2 or 3 obesity compared to those with class 1 obesity. In an initial model, we adjusted for age. In a second model, we additionally adjusted for sex, race/ethnicity, education, and income-to-poverty ratio. In a third model, we adjusted for the variables in the second model and insurance status, having a usual health care site, and health care visits in the past year. In a fourth model, we adjusted for the variables in the third model and alcohol use, physical activity, current smoking, diabetes, CKD and CVD.
We conduced all analyses using Stata version 15.1 (StataCorp, College Station, TX) using survey commands to account for the complex survey design to produce nationally representative prevalence estimates for the non-institutionalized US population [20,21]. Estimates which did not meet the National Center for Health Statistics data presentation standards based on the minimum denominator sample size for proportions and the absolute and relative width of the confidence intervals were suppressed [22]. We used a 2-sided p-value of 0.05 to define statistical significance. Population totals were estimated after adjusting the total weights for the NHANES participants with non-missing data to the 2017–2018 civilian noninstitutionalized population from the American Community Survey [23].
RESULTS
Hypertension prevalence by age group and BMI category
The prevalence of hypertension was higher across increasing categories of age and BMI (Figure 1). Among adults with normal BMI, the prevalence of hypertension was 2.4% among those aged 18–44 years and 71.7% among those aged ≥75 years. The prevalence of hypertension among adults with class 2 or 3 obesity was 21.5% for those aged 18–44 years and 88.7% for those aged ≥75 years.
Figure 1. Percentage of US adults with hypertension by age group and BMI category, NHANES 2015–2018.

The vertical bars represent the prevalence of hypertension among each category of age and BMI. The lines indicate 95% confidence intervals.
Abbreviations: BMI, body mass index.
Characteristics of US adults with hypertension by BMI category
Among adults with hypertension, 15.6% had normal BMI, 31.3% had overweight, 26.2% had class 1 obesity, and 26.8% had class 2 or class 3 obesity, representing 12.8, 25.7, 21.5, and 22.0 million individuals, respectively (Table 1). Compared to those in higher BMI categories, those with normal BMI were more likely to be aged ≥75 years, female, non-Hispanic Asian, to have less than a high school education, and to be a current smoker, and less likely to be Hispanic, have ≥4 health care visits in the past year, and have diabetes.
Table 1.
Characteristics of US adults with hypertension by BMI category, NHANES 2015–2018.
| Normal BMI | Overweight | Class 1 Obesity | Class 2 or 3 Obesity | |
|---|---|---|---|---|
| Row % (SE) | 15.6 (1.0) | 31.3 (1.3) | 26.2 (1.2) | 26.8 (1.3) |
| Number of NHANES participants | 625 | 1,154 | 865 | 924 |
| Weighted N, US adults in millions (SE) | 12.8 (0.8) | 25.7 (1.1) | 21.5 (1.0) | 22.0 (1.0) |
| Characteristics, % (SE) | ||||
| Age group, years | ||||
| 18–44 | 19.7 (2.1) | 18.7 (1.6) | 23.3 (1.8) | 30.7 (2.0) |
| 45–64 | 43.8 (2.0) | 43.5 (2.1) | 44.7 (2.2) | 47.5 (2.1) |
| 65–74 | 15.9 (2.1) | 21.1 (1.5) | 20.4 (1.8) | 14.4 (1.6) |
| ≥75 | 20.6 (1.9) | 16.7 (1.4) | 11.6 (1.3) | 7.4 (1.1) |
| Female | 54.1 (2.6) | 41.8 (1.6) | 43.6 (2.2) | 54.3 (2.4) |
| Race/ethnicity | ||||
| Non-Hispanic White | 65.0 (2.7) | 65.2 (2.9) | 67.4 (2.9) | 64.8 (3.0) |
| Non-Hispanic Black | 12.1 (1.6) | 10.5 (1.5) | 11.7 (1.7) | 16.3 (2.1) |
| Hispanic | 7.5 (1.2) | 13.9 (1.7) | 14.1 (1.8) | 13.2 (1.6) |
| Non-Hispanic Asian | 11.5 (1.7) | 6.5 (0.9) | 3.0 (0.6) | 0.8 (0.2) |
| Other | 3.8 (1.1) | 4.0 (0.9) | 3.8 (1.0) | 5.0 (0.9) |
| Education | ||||
| <High school | 15.7 (1.6) | 13.4 (1.5) | 12.4 (1.3) | 11.3 (1.0) |
| High school/GED | 27.1 (2.5) | 23.8 (1.5) | 25.7 (1.6) | 28.6 (1.6) |
| >High school | 57.2 (2.7) | 62.7 (2.4) | 61.8 (1.8) | 60.1 (2.0) |
| Income-to-poverty ratio | ||||
| Not in poverty | 69.2 (2.2) | 74.3 (2.0) | 77.2 (1.6) | 72.0 (2.1) |
| Borderline poverty | 6.4 (0.8) | 6.3 (0.7) | 5.3 (0.7) | 6.0 (0.7) |
| Poverty | 12.6 (1.3) | 9.9 (1.1) | 10.0 (1.2) | 13.0 (1.4) |
| Unknown | 11.8 (1.6) | 9.5 (1.3) | 7.5 (0.9) | 9.1 (1.5) |
| Insured | 88.0 (2.7) | 89.9 (1.2) | 92.4 (0.9) | 87.6 (1.9) |
| Usual health site | 83.1 (2.2) | 86.1 (1.1) | 90.5 (1.1) | 88.7 (1.5) |
| Health care visits in past year | ||||
| 0 | 13.0 (1.6) | 13.8 (1.3) | 10.9 (1.3) | 11.7 (1.3) |
| 1–3 | 49.4 (2.6) | 43.7 (2.0) | 45.0 (2.3) | 42.0 (1.7) |
| ≥4 | 37.6 (2.2) | 42.5 (2.0) | 44.0 (2.2) | 46.4 (2.2) |
| Current smoking | 27.5 (2.7) | 15.5 (1.6) | 15.4 (1.2) | 13.5 (1.5) |
| Alcohol use | ||||
| Never drinker | 11.2 (1.1) | 9.2 (1.2) | 9.3 (0.8) | 9.0 (1.3) |
| Former drinker | 18.0 (1.5) | 20.4 (1.5) | 18.8 (1.9) | 19.4 (1.6) |
| Current drinker | 70.8 (2.1) | 70.5 (2.0) | 71.9 (1.7) | 71.6 (2.0) |
| Any moderate-vigorous physical activity | 72.6 (2.1) | 73.4 (1.2) | 71.4 (1.6) | 67.0 (2.3) |
| Diabetes | 8.7 (1.4) | 15.1 (1.3) | 21.2 (1.5) | 26.5 (1.8) |
| Chronic kidney disease | 20.8 (2.1) | 22.2 (1.7) | 23.0 (1.7) | 26.1 (1.9) |
| Cardiovascular disease | 12.8 (1.2) | 12.3 (1.4) | 14.3 (1.9) | 14.1 (1.6) |
Abbreviations: BMI, body mass index; NHANES, National Health and Nutrition Examination Survey; SE, standard error.
Moderate-vigorous physical activity includes work and leisure time activities. Diabetes is based on self-report. Chronic kidney disease is defined as creatinine-based eGFR <60 mL/min/1.73m2 using the 2021 Chronic Kidney Disease Epidemiology Collaboration (CKD-EPI) equation or urinary albumin-to-creatinine ratio ≥30 mg/g. Cardiovascular disease is based on self-reported history of coronary heart disease, heart failure, myocardial infarction, or stroke.
BP levels and BP control outcomes by BMI category
Among adults with hypertension, the mean SBP was 142.6, 138.2, 134.6, and 137.6 mmHg and the mean DBP was 74.6, 74.7, 75.0, and 75.7 mmHg among those with normal BMI, overweight, class 1 obesity, and class 2 or 3 obesity, respectively (Table 2). Among adults with hypertension, 67.9% with normal BMI, 76.8% with overweight, 84.0% with class 1 obesity, and 87.8% with class 2 or 3 obesity were aware of their hypertension (Table 3). Among those aware of their hypertension, 88.1% with normal BMI, 88.1% with overweight, 90.9% with class 1 obesity, and 90.2% with class 2 or 3 obesity were taking antihypertensive medication. Among adults who were taking antihypertensive medication, 63.5% with normal BMI, 65.9% with overweight, 71.1% with class 1 obesity, and 64.1% with class 2 or 3 obesity had controlled BP. Among all adults with hypertension, 37.1% with normal BMI, 44.3% with overweight, 53.8% with class 1 obesity, and 50.8% with class 2 or 3 obesity had controlled BP.
Table 2.
Mean systolic and diastolic blood pressure among US adults with hypertension overall and among those who were unaware, aware, taking and not taking antihypertensive medication, and with and without controlled blood pressure by BMI category.
| Mean SBP, mmHg (SE) | Normal BMI | Overweight | Class 1 Obesity | Class 2 or 3 Obesity |
|---|---|---|---|---|
| Hypertension overall | 142.6 (1.0) | 138.2 (1.1) | 134.6 (0.9) | 137.6 (0.8) |
| Unaware | 149.2 (1.0) | 149.0 (1.6) | 145.7 (1.3) | 147.8 (1.4) |
| Aware but not taking antihypertensive medication | 150.1 (1.8) | 151.5 (2.7) | 151.9 (2.3) | 155.5 (2.5) |
| Taking antihypertensive medication with uncontrolled BP | 160.6 (1.0) | 152.6 (0.9) | 151.0 (1.3) | 152.9 (0.8) |
| Mean DBP, mmHg (SE) | ||||
| Hypertension overall | 74.6 (1.2) | 74.7 (0.8) | 75.0 (0.7) | 75.7 (0.8) |
| Unaware | 78.9 (1.3) | 81.8 (1.4) | 83.0 (1.6) | 86.4 (1.4) |
| Aware but not taking antihypertensive medication | 90.0 (4.2) | 84.6 (1.9) | 82.4 (2.2) | 87.4 (1.5) |
| Taking antihypertensive medication with uncontrolled BP | 75.0 (1.8) | 75.2 (1.0) | 77.3 (1.7) | 78.4 (1.4) |
Abbreviations: BMI, body mass index; BP, blood pressure; DBP, diastolic blood pressure; SBP, systolic blood pressure; SE, standard error.
Table 3.
Age-standardized proportion of hypertension awareness, antihypertensive medication use, and blood pressure control among US adults with hypertension by BMI category.
| Age-standardized % (SE) | Normal BMI | Overweight | Class 1 Obesity | Class 2 or 3 Obesity |
|---|---|---|---|---|
| Aware | 67.9 (2.9) | 76.8 (1.5)a | 84.0 (2.0)ab | 87.8 (1.4)ab |
| Treated among aware | 88.1 (2.3) | 88.1 (2.1) | 90.9 (1.8) | 90.2 (1.7) |
| Controlled among treated | 63.5 (4.3) | 65.9 (2.9) | 71.1 (1.7) | 64.1 (1.8)c |
| Controlled overall | 37.1 (2.8) | 44.3 (2.7) | 53.8 (2.3)ab | 50.8 (2.1)a |
| N in millions (SE) | ||||
| Total with hypertension | 12.8 (0.8) | 25.7 (1.1) | 21.5 (1.0) | 22.0 (1.0) |
| Unaware | 4.0 (0.3) | 5.7 (0.4) | 3.5 (0.5) | 3.2 (0.4) |
| Aware but untreated | 0.8 (0.1) | 2.1 (0.4) | 1.6 (0.3) | 2.1 (0.4) |
| Treated but uncontrolled | 3.3 (0.3) | 6.5 (0.6) | 4.7 (0.3) | 5.9 (0.3) |
| Total with uncontrolled BP | 8.1 (0.4) | 14.3 (0.7) | 9.8 (0.5) | 11.1 (0.4) |
| Total with controlled BP | 4.7 (0.4) | 11.4 (0.7) | 11.7 (0.5) | 10.8 (0.4) |
Abbreviations: BMI, body mass index; BP, blood pressure; SE, standard error.
Age-standardized to the population with hypertension in 2015–2018: ages 18–44 (12.9%), ages 45–64 (46.6%), ages 65–74 (23.0%), and ages ≥75 (17.5%).
P <0.05 compared to normal BMI.
P <0.05 compared to overweight.
P <0.05 compared to Class 1 obesity.
Among adults who were 45–64, 65–74, and ≥75 years of age, those with normal BMI were less likely to be aware they had hypertension compared to those in higher BMI categories (Figure 2). Among adults aged 65–74 years, BP control was less common among those with normal BMI than those in higher BMI categories and among adults aged ≥75 years, BP control was less common among those with normal BMI or overweight than those with class 1 obesity or class 2 or 3 obesity. Results by sex and race/ethnicity are presented in Supplemental Tables 1 and 2, respectively.
Figure 2. Hypertension awareness, antihypertensive medication use, and blood pressure control among US adults with hypertension by age group and BMI category.
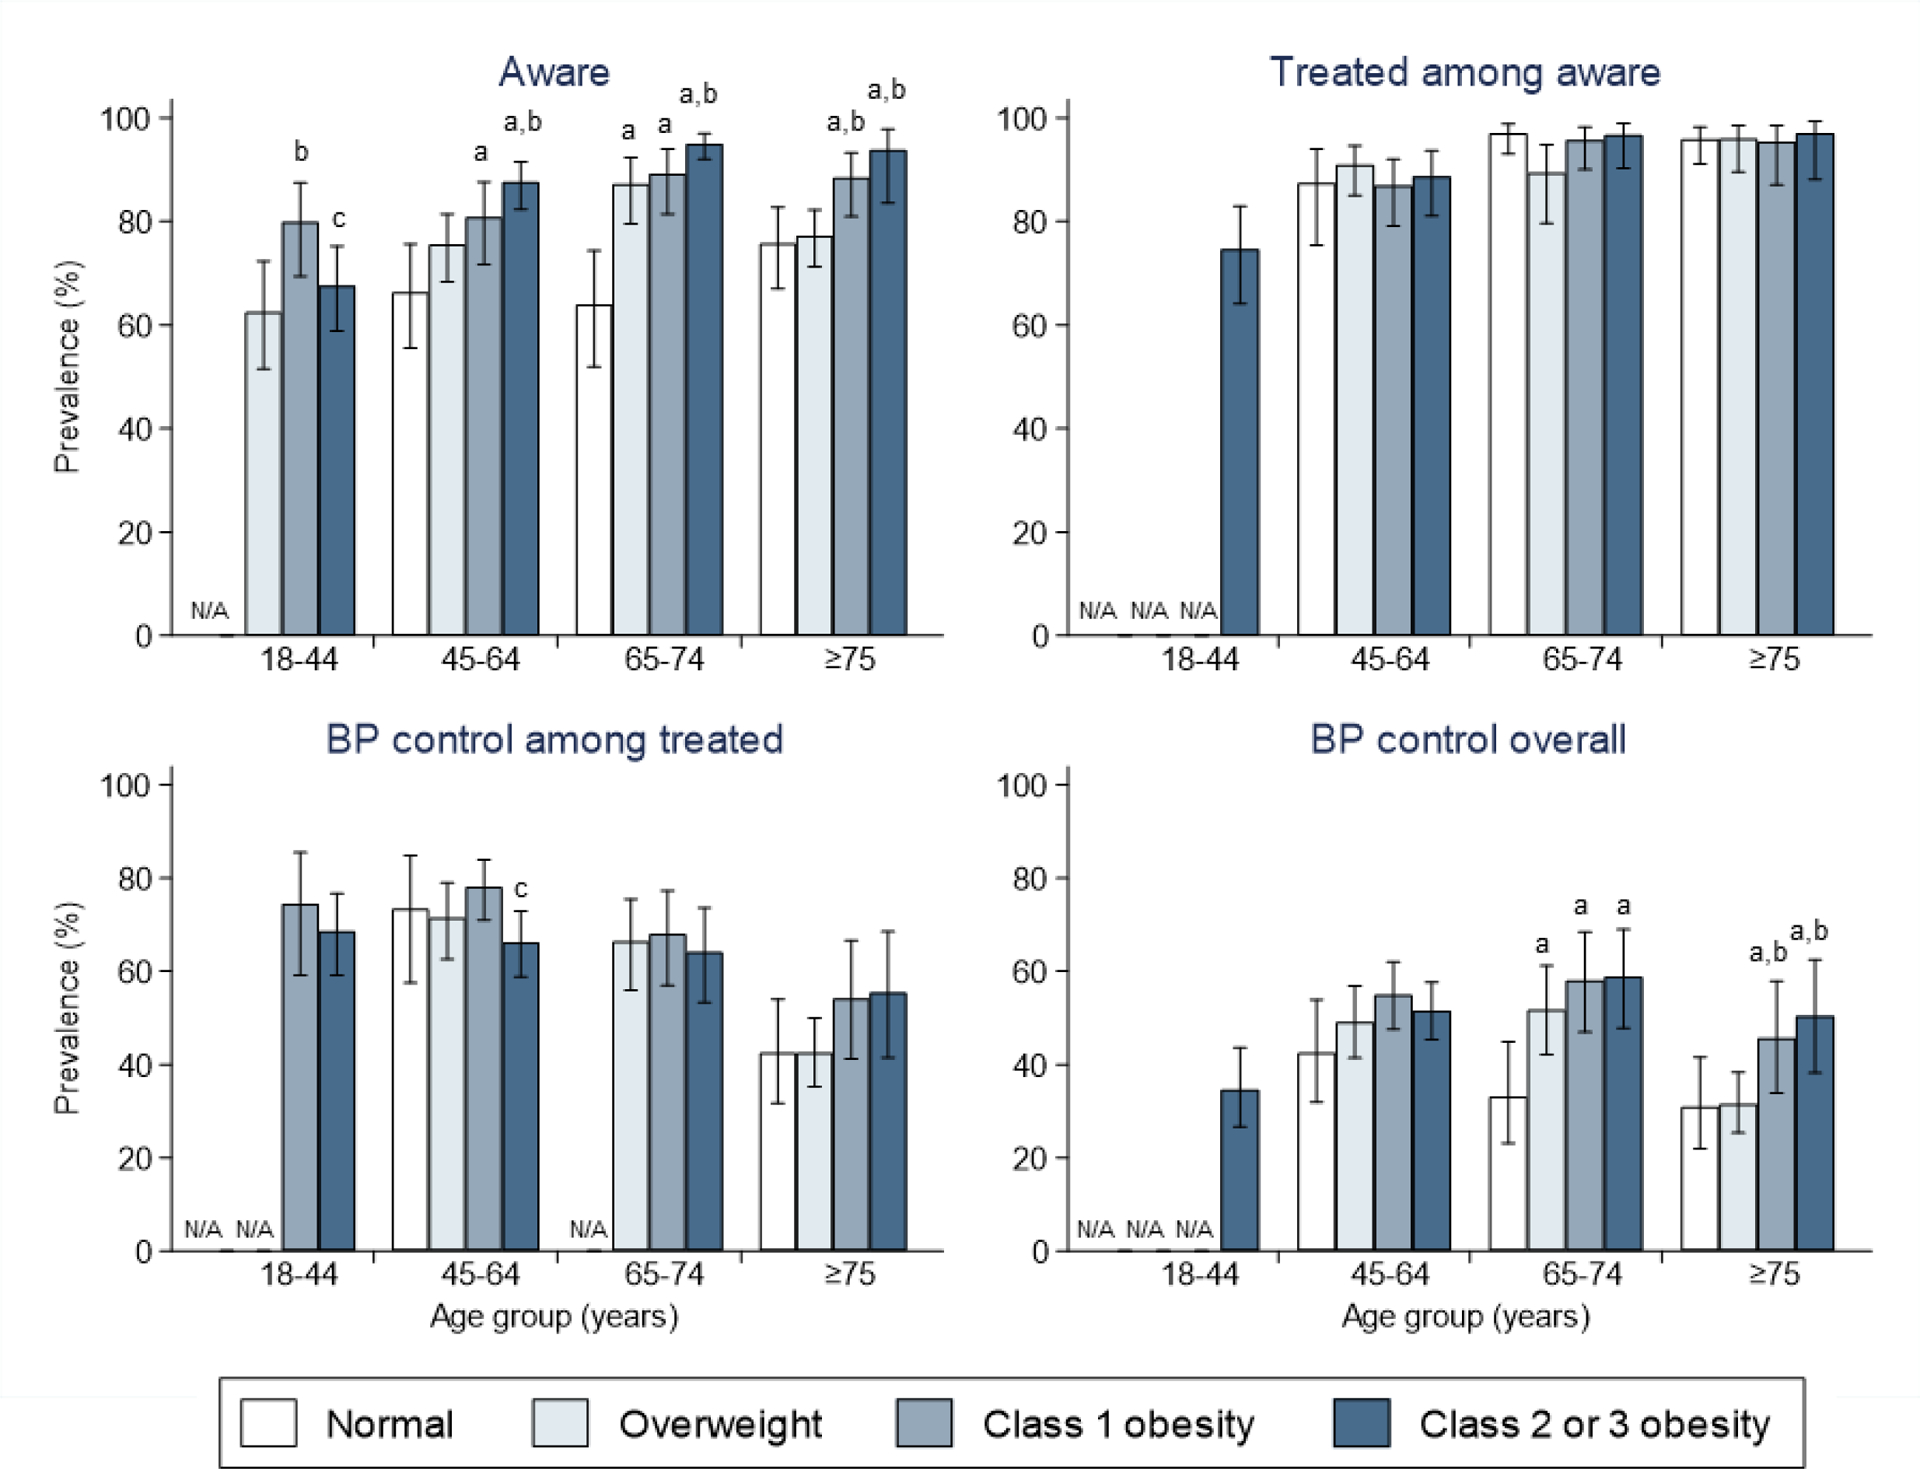
The vertical bars represent the prevalence of hypertension among each category of age and BMI. The lines indicate 95% confidence intervals.
Abbreviations: BMI, body mass index, BP, blood pressure. N/A indicates results are not presented because there were fewer than 30 individuals in the denominator or the estimate was considered unreliable based on the width of the absolute or relative confidence interval.
a P <0.05 compared to normal BMI.
b P <0.05 compared to overweight.
c P <0.05 compared to Class 1 obesity.
Prevalence ratios for BP control outcomes
After adjustment for demographic characteristics, socioeconomic status, health care access, health behaviors, and other comorbidities, hypertension awareness was lower among those with normal BMI than those with class 1 obesity (PR: 0.84, 95% confidence interval [CI]: 0.77–0.91) (Table 4, right-hand column). \Among all adults with hypertension, those with normal BMI were less likely than those with class 1 obesity to have controlled BP (PR: 0.76, 95% CI: 0.64–0.90).
Table 4.
Adjusted prevalence ratios for hypertension awareness, antihypertensive medication use, and blood pressure control among US adults with hypertension by BMI category.
| Prevalence ratio (95% CI) | Model 1 | Model 2 | Model 3 | Model 4 |
|---|---|---|---|---|
| Awareness | ||||
| Normal BMI | 0.81 (0.74–0.88) | 0.80 (0.74–0.87) | 0.83 (0.77–0.90) | 0.84 (0.77–0.91) |
| Overweight | 0.92 (0.86–0.97) | 0.92 (0.87–0.98) | 0.94 (0.89–0.99) | 0.95 (0.90–1.01) |
| Class 1 Obesity | Ref | Ref | Ref | Ref |
| Class 2 or 3 Obesity | 1.04 (0.98–1.11) | 1.04 (0.97–1.11) | 1.04 (0.98–1.10) | 1.03 (0.98–1.09) |
| Treated among aware | ||||
| Normal BMI | 0.98 (0.92–1.04) | 0.97 (0.91–1.03) | 0.99 (0.94–1.05) | 1.00 (0.95–1.06) |
| Overweight | 0.97 (0.91–1.04) | 0.97 (0.91–1.04) | 0.99 (0.92–1.06) | 1.00 (0.93–1.07) |
| Class 1 Obesity | Ref | Ref | Ref | Ref |
| Class 2 or 3 Obesity | 0.99 (0.94–1.05) | 0.99 (0.93–1.05) | 1.00 (0.95–1.05) | 1.00 (0.95–1.05) |
| Controlled among treated | ||||
| Normal BMI | 0.88 (0.75–1.03) | 0.89 (0.76–1.04) | 0.90 (0.77–1.06) | 0.91 (0.78–1.06) |
| Overweight | 0.92 (0.83–1.03) | 0.92 (0.83–1.03) | 0.93 (0.84–1.03) | 0.93 (0.85–1.03) |
| Class 1 Obesity | Ref | Ref | Ref | Ref |
| Class 2 or 3 Obesity | 0.89 (0.82–0.97) | 0.90 (0.83–0.98) | 0.91 (0.84–0.99) | 0.92 (0.84–1.00) |
| Controlled overall | ||||
| Normal BMI | 0.69 (0.58–0.83) | 0.69 (0.58–0.82) | 0.74 (0.63–0.88) | 0.76 (0.64–0.90) |
| Overweight | 0.82 (0.72–0.95) | 0.83 (0.72–0.95) | 0.87 (0.77–0.99) | 0.89 (0.78–1.00) |
| Class 1 Obesity | Ref | Ref | Ref | Ref |
| Class 2 or 3 Obesity | 0.92 (0.81–1.05) | 0.92 (0.81–1.05) | 0.95 (0.84–1.07) | 0.94 (0.84–1.06) |
Abbreviations: BMI, body mass index; CI, confidence interval. Bold text indicates p-value <0.05.
Model 1: Adjusted for age
Model 2: Model 1 + sex, race/ethnicity, education, income-to-poverty ratio
Model 3: Model 2 + insurance, usual source of care, health care visits in the past year
Model 4: Model 3 + alcohol use, physical activity, current smoking, diabetes, chronic kidney disease, cardiovascular disease
Supplemental analysis based on the 2017 ACC/AHA guideline
The prevalence of hypertension, defined by the 2017 ACC/AHA BP guideline, was higher at older age and at higher BMI levels (Supplemental Figure 1). Among adults with hypertension by this definition, 17.7% had normal BMI, 30.5% had overweight, 26.1% had class 1 obesity, and 25.7% had class 2 or class 3 obesity, representing 20.8, 35.8, 30.6, and 30.1 million adults, respectively (Supplemental Table 3). Mean SBP and DBP overall and by awareness, treatment, and BP control are presented in Supplemental Table 4. Among all adults with hypertension, 13.2% with normal BMI, 19.6% with overweight, 24.3% with class 1 obesity, and 24.4% with class 2 or 3 obesity had controlled BP, defined by <130/80 mmHg (Supplemental Table 5). Hypertension awareness was less common among those with normal BMI compared to overweight, class 1 obesity, or class 2 or 3 obesity and antihypertensive medication use among those who were aware of their hypertension was less common in those with normal BMI compared to those with class 2 or 3 obesity. Results stratified by age are presented in Supplemental Figure 2, while results stratified by sex and race/ethnicity are presented in Supplemental Table 6 and Supplemental Table 7, respectively. After multivariable adjustment, adults with normal BMI (PR: 0.75; 95% CI:0.69–0.83) and with overweight (PR: 0.93; 95% CI: 0.87–0.99) were less likely to be aware of their hypertension than those with class 1 obesity and those with normal BMI (PR: 0.63; 95% CI: 0.50–0.79) were less likely to have BP controlled to <130/80 mmHg than those with class 1 obesity (Supplemental Table 8).
DISCUSSION
In this nationally representative study of US adults, the prevalence of hypertension was higher with increasing BMI categories. However, hypertension was common at all levels of BMI. US adults with normal BMI were less likely than those with overweight or obesity to be aware they had hypertension. Also, adults with normal BMI were less likely to have controlled BP compared to those in the higher BMI categories, which appeared to be explained by lower levels of awareness. These data suggest the need to improve BP control across the full spectrum of BMI, including normal weight individuals.
The results in the current study extend a prior analysis of data collected between 1999 and 2010 and indicate that low hypertension awareness among those with normal BMI remains present, [8] highlighting the need to increase screening and diagnosis in this population. The US Preventive Services Task Force (USPSTF) recommends annual screening for adults ages 40 years and older and younger adults who are at increased risk for hypertension, including those with overweight or obesity, and less frequent screening (i.e., every 3–5 years) for adults aged 18–39 years who are not at increased risk for hypertension [24]. Among adults ≥45 years of age in the current analysis, hypertension awareness was lower among those with normal BMI versus overweight or obesity, which contributed to a lower likelihood of BP control in this group. Overall, there were 4.0 million US adults based on the primary definition of hypertension and 10.7 million adults based on the 2017 ACC/AHA definition of hypertension with normal BMI who were unaware they had hypertension.
In a prior study, higher BMI was associated with a higher likelihood of a recorded diagnosis of hypertension in a patient’s electronic medical record among individuals with two or more SBP readings ≥140 mmHg or DBP readings ≥90 mmHg or taking antihypertensive medication [11]. In another study, lower BMI was associated with greater diagnostic inertia, meaning they were not scheduled for a follow-up visit with BP readings or were not recommend future BP checks [25]. In the current analysis, the mean SBP among those with normal BMI who were unaware of their hypertension was 149.2 mmHg, based on the average of multiple research-grade measurements. Some participants may have had white coat hypertension. However, given the mean SBP was substantially above the SBP threshold used to define hypertension, it is unlikely that a high proportion of participants had white coat hypertension [26,27]. Future studies examining clinicians’ perceptions of high BP and CVD risk among normal weight individuals could inform approaches for increasing hypertension awareness in this population. Future research could also examine patient perceptions of their risk for hypertension by BMI. A study which identified patients with an elevated BP measurement in the past year and recalled them for further evaluation found patients with normal weight were less likely to return for a follow-up visit than those with obesity [12].
The proportion of adults aware of their hypertension who were taking antihypertensive medication was high in each BMI category. However, a low proportion of those taking antihypertensive medication in each BMI category had controlled BP. The mean SBP for those taking antihypertensive medication but with uncontrolled BP was >160 mmHg in those with normal BMI and >150 mmHg in the other BMI categories. A meta-analysis using individual patient data from randomized controlled trials included in the Blood Pressure Lowering Treatment Trialists’ Collaboration found no evidence the reduction in CVD risk for a given decrease in SBP with antihypertensive medication differs by BMI [10]. Additionally, post hoc analyses of the Antihypertensive and Lipid Lowering Treatment to Prevent Heart Attack Trial (ALLHAT) and the Systolic Blood Pressure Reduction Intervention Trial (SPRINT) found similar reductions in CVD risk by BMI [28–30]. Although future studies may identify different effects of antihypertensive regimens across BMI levels, existing research suggests guideline-recommended therapy effectively reduces CVD risk regardless of BMI.
The current study has certain strengths. We used nationally representative data from two recent NHANES survey cycles to provide contemporary estimates of BP control by BMI category. NHANES uses standardized procedures to measure BP and the study methodology remained consistent across survey cycles. There are also limitations to consider in the interpretation of these results. Although up to 3 BP readings were obtained at a single study visit, guidelines recommend using the mean of multiple blood pressure readings obtained at 2 or more visits to diagnose hypertension [17]. Further, out-of-office BP measurements, which are recommended to confirm a diagnosis of hypertension and identify masked hypertension [17], were not performed in NHANES. Therefore, the hypertension status for some participants may have been misclassified. Additionally, we did not have information on the blood pressure guidelines being used to direct the treatment of hypertension for NHANES participants. In addition to the two blood pressure targets examined in this study, some participants’ clinicians may have been following the 2014 Report From the Panel Members Appointed to the Eighth Joint National Committee which recommended higher blood pressure goals for adults aged ≥60 years without diabetes or CKD [31]. We relied on self-reported measures of antihypertensive treatment and several patient characteristics. Data were not available to determine whether participants were using lifestyle modifications to lower their BP.
Conclusion
The present study highlights barriers to BP control by BMI. US adults with normal BMI were less likely to be aware of their hypertension than those with overweight or obesity. Among those taking antihypertensive medication, there were gaps in BP control at all levels of BMI. Interventions to address these barriers have the potential to improve BP control among US adults with hypertension.
Supplementary Material
Funding:
Dr. Foti was supported by National Institutes of Health (NIH)/National Heart, Lung, and Blood Institute (NHLBI) grant T32 HL007024. Dr. Hardy was supported by NIH/NHLBI grant R01 HL139716. Dr. Chang was supported by NIH/National Institute of Diabetes and Digestive and Kidney Diseases (NIDDK) grant K23 DK106515. Dr. Selvin was supported by NIH/NHLBI grant K24 HL152440.
Footnotes
Conflicts of interest: NONE
Supplemental Digital Content
Supplemental Digital Content 1.docx
REFERENCES
- 1.Stanaway JD, Afshin A, Gakidou E, Lim SS, Abate D, Abate KH, et al. Global, regional, and national comparative risk assessment of 84 behavioural, environmental and occupational, and metabolic risks or clusters of risks for 195 countries and territories, 1990–2017: A systematic analysis for the Global Burden of Disease Study 2017. Lancet 2018; 392:1923–1994. [DOI] [PMC free article] [PubMed] [Google Scholar]
- 2.Forouzanfar MH, Liu P, Roth GA, Ng M, Biryukov S, Marczak L, et al. Global Burden of Hypertension and Systolic Blood Pressure of at Least 110 to 115 mm Hg, 1990–2015. JAMA 2017; 317:165. [DOI] [PubMed] [Google Scholar]
- 3.Muntner P, Hardy ST, Fine LJ, Jaeger BC, Wozniak G, Levitan EB, et al. Trends in Blood Pressure Control Among US Adults With Hypertension, 1999–2000 to 2017–2018. JAMA Published Online First: 9 September 2020. doi: 10.1001/jama.2020.14545 [DOI] [PMC free article] [PubMed] [Google Scholar]
- 4.Fryar C, Carroll M, Afful J. Prevalence of Overweight, Obesity, and Extreme Obesity Among Adults Aged 20 and Over: United States, 1960–1962 Through 2017–2018.; 2020. https://www.cdc.gov/nchs/data/hestat/obesity-adult-17-18/obesity-adult.htm (accessed 15 Mar2021).
- 5.Landsberg L, Aronne LJ, Beilin LJ, Burke V, Igel LI, Lloyd-Jones D, et al. Obesity-Related Hypertension: Pathogenesis, Cardiovascular Risk, and Treatment. J Clin Hypertens 2013; 15:14–33. [DOI] [PMC free article] [PubMed] [Google Scholar]
- 6.Cohen JB. Hypertension in Obesity and the Impact of Weight Loss. Curr. Cardiol. Rep 2017; 19:98. [DOI] [PMC free article] [PubMed] [Google Scholar]
- 7.Hall ME, Cohen JB, Ard JD, Egan BM, Hall JE, Lavie CJ, et al. Weight-Loss Strategies for Prevention and Treatment of Hypertension: A Scientific Statement From the American Heart Association. Hypertension Published Online First: 20 September 2021. doi: 10.1161/HYP.0000000000000202 [DOI] [PubMed] [Google Scholar]
- 8.Saydah S, Bullard KM, Cheng Y, Ali MK, Gregg EW, Geiss L, et al. Trends in cardiovascular disease risk factors by obesity level in adults in the United States, NHANES 1999–2010. Obesity 2014; 22:1888–1895. [DOI] [PMC free article] [PubMed] [Google Scholar]
- 9.Brown CD, Higgins M, Donato KA, Rohde FC, Garrison R, Obarzanek E, et al. Body Mass Index and the Prevalence of Hypertension and Dyslipidemia. Obes Res 2000; 8:605–619. [DOI] [PubMed] [Google Scholar]
- 10.Agodoa L, Estacio R, Schrier R, Lubsen J, Chalmers J, Cutler J, et al. Effects of blood pressure lowering on cardiovascular risk according to baseline body-mass index: A meta-analysis of randomised trials. Lancet 2015; 385:867–874. [DOI] [PubMed] [Google Scholar]
- 11.Banerjee D, Chung S, Wong EC, Wang EJ, Stafford RS, Palaniappan LP. Underdiagnosis of hypertension using electronic health records. Am J Hypertens 2012; 25:97–102. [DOI] [PMC free article] [PubMed] [Google Scholar]
- 12.Meador M, Lewis JH, Bay RC, Wall HK, Jackson C. Who Are the Undiagnosed? Disparities in Hypertension Diagnoses in Vulnerable Populations. Fam Community Health 2020; 43:35–45. [DOI] [PMC free article] [PubMed] [Google Scholar]
- 13.Egan BM, Zhao Y, Axon RN, Brzezinski WA, Ferdinand KC. Uncontrolled and apparent treatment resistant hypertension in the United States, 1988 to 2008. Circulation 2011; 124:1046–1058. [DOI] [PMC free article] [PubMed] [Google Scholar]
- 14.NHANES - National Health and Nutrition Examination Survey Homepage. https://www.cdc.gov/nchs/nhanes/index.htm (accessed 27 Oct2021). [Google Scholar]
- 15.Centers for Disease Control and Prevention (CDC), National Center for Health Statistics (NCHS). National Health and Nutrition Examination Survey (NHANES) Physician Examination Procedures Manual. Hyattsville, MD:; 2015. https://wwwn.cdc.gov/nchs/data/nhanes/2015-2016/manuals/2015_Physician_Examination_Procedures_Manual.pdf [Google Scholar]
- 16.Crim MT, Yoon SS, Ortiz E, Wall HK, Schober S, Gillespie C, et al. National Surveillance Definitions for Hypertension Prevalence and Control Among Adults. Circ Cardiovasc Qual Outcomes 2012; 5:343–351. [DOI] [PMC free article] [PubMed] [Google Scholar]
- 17.Whelton PK, Carey RM, Aronow WS, Casey DE, Collins KJ, Dennison Himmelfarb C, et al. 2017 ACC/AHA/AAPA/ABC/ACPM/AGS/APhA/ASH/ASPC/NMA/PCNA Guideline for the Prevention, Detection, Evaluation, and Management of High Blood Pressure in Adults: A Report of the American College of Cardiology/American Heart Association Task Force on Clinical Pr. Hypertens (Dallas, Tex 1979) 2017;:HYP.0000000000000065. [DOI] [PubMed] [Google Scholar]
- 18.Defining Adult Overweight and Obesity | Overweight & Obesity | CDC. https://www.cdc.gov/obesity/adult/defining.html (accessed 9 Apr2021).
- 19.Inker LA, Eneanya ND, Coresh J, Tighiouart H, Wang D, Sang Y, et al. New Creatinine- and Cystatin C–Based Equations to Estimate GFR without Race. https://doi.org/101056/NEJMoa2102953 Published Online First: 23 September 2021. doi: 10.1056/NEJMOA2102953 [DOI] [PMC free article] [PubMed]
- 20.StataCorp. Stata Statistical Software: Release 15. 2017.
- 21.StataCorp. Stata 15 Stata Survey Data Reference Manual. 2017.
- 22.Parker J, Talih M, Malec D, et al. National Center for Health Statistics Data Presentation Standards for Proportions. Vital Heal Stat 2017; 2.https://www.cdc.gov/nchs/data/series/sr_02/sr02_175.pdf [PubMed] [Google Scholar]
- 23.National Center for Health Statistics. NHANES Response Rates and Population Totals. https://wwwn.cdc.gov/nchs/nhanes/ResponseRates.aspx (accessed 4 Jan2019).
- 24.Krist AH, Davidson KW, Mangione CM, Cabana M, Caughey AB, Davis EM, et al. Screening for Hypertension in Adults. JAMA 2021; 325:1650. [DOI] [PubMed] [Google Scholar]
- 25.Gil-Guillén V, Orozco-Beltrán D, Pérez RP, Alfonso JL, Redón J, Pertusa-Martínez S, et al. Clinical inertia in diagnosis and treatment of hypertension in primary care: Quantification and associated factors. Blood Press 2010; 19:3–10. [DOI] [PubMed] [Google Scholar]
- 26.Roerecke M, Kaczorowski J, Myers MG. Comparing Automated Office Blood Pressure Readings With Other Methods of Blood Pressure Measurement for Identifying Patients With Possible Hypertension. JAMA Intern Med 2019; 179:351. [DOI] [PMC free article] [PubMed] [Google Scholar]
- 27.Sheppard JP, Stevens R, Gill P, Martin U, Godwin M, Hanley J, et al. Predicting out-of-office blood pressure in the clinic (PROOF-BP): Derivation and validation of a tool to improve the accuracy of blood pressure measurement in clinical practice. Hypertension 2016; 67:941–950. [DOI] [PMC free article] [PubMed] [Google Scholar]
- 28.Reisin E, Graves JW, Yamal JM, Barzilay JI, Pressel SL, Einhorn PT, et al. Blood pressure control and cardiovascular outcomes in normal-weight, overweight, and obese hypertensive patients treated with three different antihypertensives in ALLHAT. J Hypertens 2014; 32:1503–1513. [DOI] [PMC free article] [PubMed] [Google Scholar]
- 29.Oxlund CS, Pareek M, Rasmussen BSB, Vaduganathan M, Biering-Sørensen T, Byrne C, et al. Body Mass Index, Intensive Blood Pressure Management, and Cardiovascular Events in the SPRINT Trial. Am J Med 2019; 132:840–846. [DOI] [PubMed] [Google Scholar]
- 30.Fugar S, Okoh AK, Dodoo C, Kolkailah AA, Okyne E, Özturk E, et al. Effect of intensive and standard blood pressure control on cardiovascular outcomes based on body mass index: sub-analysis of the sprint trial. J Hum Hypertens 2020; 34:778–786. [DOI] [PubMed] [Google Scholar]
- 31.James PA, Oparil S, Carter BL, Cushman WC, Dennison-Himmelfarb C, Handler J, et al. 2014 Evidence-Based Guideline for the Management of High Blood Pressure in Adults. JAMA 2014; 311:507–520. [DOI] [PubMed] [Google Scholar]
Associated Data
This section collects any data citations, data availability statements, or supplementary materials included in this article.