

SUMMARY
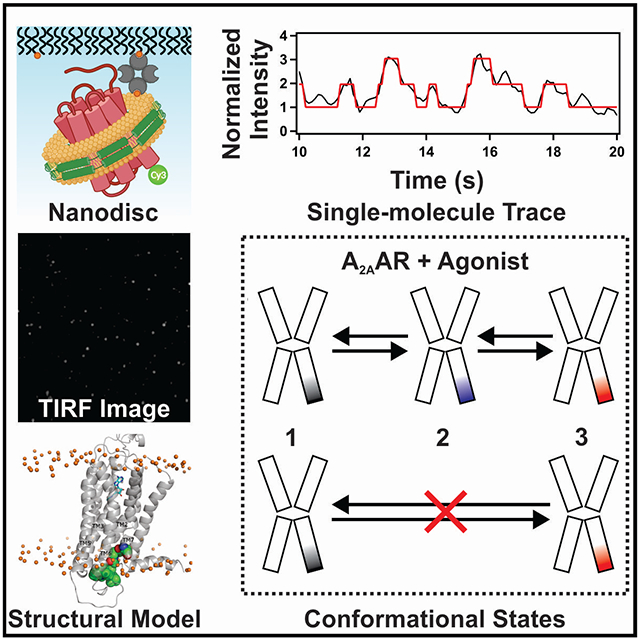
A more complete depiction of protein energy landscapes includes the identification of different function-related conformational states and the determination of the pathways connecting them. We used total internal reflection fluorescence (TIRF) imaging to investigate the conformational dynamics of the human A2A adenosine receptor (A2AAR), a class A GPCR, at the single-molecule level. Slow, reversible conformational exchange was observed among three different fluorescence emission states populated for agonist-bound A2AAR. Transitions among these states predominantly occurred in a specific order, and exchange between inactive and active-like conformations proceeded through an intermediate state. Models derived from molecular dynamics simulations with available A2AAR structures rationalized the relative fluorescence emission intensities for the highest and lowest emission states but not the transition state. This suggests that the functionally-critical intermediate state required to achieve activation is not currently visualized among available A2AAR structures.
Graphical Abstract
eTOC Blurb
Wei et al. use single-molecule fluorescence to observe slow exchange among at least three conformations of the agonist-bound A2A adenosine receptor. Transitions from inactive to active-like conformations are sequential and must proceed through an intermediate state not currently represented among available structures.
INTRODUCTION
Time-dependent fluctuations of the atomic coordinates of proteins, i.e. conformational dynamics, are inherently related to their biological functions, as demonstrated over 40 years ago by NMR spectroscopy (Wagner et al., 1976; Wüthrich and Wagner, 1975) and subsequent additional biophysical methods. An understanding of protein conformational dynamics is necessary to develop fundamental mechanistic insights into processes such as protein-substrate and protein-protein interactions in biological systems.
These same molecular recognition processes give rise to the physiological activities of G protein-coupled receptors (GPCRs), sensory proteins that bind an enormous range of endogenous and exogenous ligands, including many hormones, neurotransmitters, and clinical drugs (Hauser et al., 2017). Chemical information contained in bound ligands is relayed to the GPCR intracellular surface through conformational dynamics that enable receptors to recognize intracellular partner proteins and initiate signaling cascades. Information on function-related dynamics has predominantly been provided by spectroscopic methods, which complement GPCR structures from x-ray crystallography and cryogenic electron microscopy (cryo-EM) (Bostock et al., 2019; Shimada et al., 2019). Many spectroscopic methods, including NMR spectroscopy, typically observe average properties of proteins from a large ensemble of molecules. These spectroscopic methods can identify multiple, simultaneously-populated conformational states. However, when more than two states are observed, information on the pathways connecting different states and, importantly, the order in which they are populated must come from single-molecule measurements (Aviram et al., 2018; Chung et al., 2012; Kim and Chung, 2020; Schuler et al., 2002).
We used single-molecule fluorescence to study the conformational dynamics of the human A2A adenosine receptor (A2AAR), a representative class A GPCR. A2AAR has been the focus of a growing number of NMR spectroscopic studies (Clark et al., 2017; Eddy et al., 2018; Eddy et al., 2017; Eddy et al., 2021; Huang et al., 2021; Mizumura et al., 2020; Sušac et al., 2018; Ye et al., 2018; Ye et al., 2016), which provide a rich set of literature data as a background for the further development of additional biophysical methods to study GPCRs. Thus, it seemed to be a logical next step to extend single-molecule fluorescence experiments developed to study the β2-adrenergic receptor (Gregorio et al., 2017; Lamichhane et al., 2015; Lamichhane et al., 2020) to A2AAR as a second member of class A GPCRs.
Using single-molecule total internal reflection fluorescence (TIRF) imaging, we observed relatively slower (kex ≤ 10 s−1) exchange processes in A2AAR with a fluorophore covalently attached to helix 7 at the intracellular surface. Our data complement other A2AAR studies that investigated relatively faster time scales using single-molecule Förster resonance energy transfer (FRET), which measured ligand efficacy-dependent changes for sub-millisecond to ~3 millisecond molecular motions of A2AAR in detergent micelles (Fernandes et al., 2021) and in lipid nanodiscs (Maslov et al., 2020). In the present study, measurements of slower exchange processes provide an exciting window into A2AAR function-related conformational dynamics.
RESULTS
A2AAR sample preparation and TIRF imaging experimental design
For single-molecule fluorescence imaging experiments, a variant of human A2AAR containing a single cysteine replacement at position 289 located at the intracellular surface of helix 7, A2AAR[A289C], was expressed in Pichia pastoris using previously described protocols (see Star Methods) (Eddy et al., 2017). The location of the introduced cysteine was selected based on literature data from 19F NMR studies of A2AAR (Sušac et al., 2018), which demonstrated that NMR spectra of A2AAR labeled with 19F-2,2,2-trifluoroethanethiol at the same position were sensitive to differences in the efficacies of bound ligands (Sušac et al., 2018). C289 was the only cysteine available for chemical conjugation. Purified A2AAR[A289C] was reconstituted into lipid nanodiscs containing a 65:30:5 molar ratio mixture of POPC, POPS, and biotinylated POPE lipids, respectively, and labeled with the Cy3 fluorophore at position 289, yielding homogeneous sample preparations (Figure S1). A2AAR[A289C] labeled with Cy3 in lipid nanodiscs retained nearly native ligand binding affinities for antagonists and agonists, as measured by radioligand binding experiments on the same samples measured in single-molecule fluorescence experiments (Figure S1). In the following sections, Cy3-labeled A2AAR[A289C] is referred to as A2AAR-Cy3.
To investigate the conformational dynamics of A2AAR at the single-molecule level, we immobilized nanodiscs containing A2AAR-Cy3 on a microscope slide and monitored them under TIRF illumination following protocols established in single-molecule fluorescence experiments with the β2-adrenergic receptor (Lamichhane et al., 2015; Lamichhane et al., 2020). The resolution of the camera used in TIRF imaging experiments enabled observations of changes in fluorescence emission on the time scale of ≥ 100 milliseconds, correlating to rates of exchange processes of kex ≤ 10 s−1. Control experiments were performed to characterize the specific immobilization of biotin-labeled nanodiscs to a PEG-coated quartz slide surface using biotin-streptavidin interactions (Figure S2). Fluorescence time trajectories were measured for A2AAR-Cy3 with no ligand added during the sample preparation, i.e., apo A2AAR-Cy3 (Figure 1A), and for A2AAR-Cy3 in complexes with the antagonist ZM241385 and agonists NECA (Figure 1B) and CGS21680. Following protocols validated in earlier TIRF studies with GPCRs (Lamichhane et al., 2015; Lamichhane et al., 2020), subsequent analysis focused on data from dynamic molecules from folded and functional receptors. Approximately 40% to 50% of the trajectories showed dynamic behavior, comparable to earlier studies with β2AR in lipid nanodiscs, where approximately 60% of the molecules showed dynamic behavior (Leitz et al., 2006; Rouck et al., 2017).
Figure 1. Single-molecule fluorescence intensity trajectories and histograms compiled from a collection of individual A2AAR molecules.

(A) An example of single-molecule fluorescence intensity trajectory from immobilized apo A2AAR-Cy3 in lipid nanodiscs. Repeated intensity jumps are observed predominantly between two fluorescence intensity states at ~200 a.u. and ~400 a.u. before photobleaching. The trajectory shows raw intensities without normalization or fitting with a Hidden Markov model. Loss of intensity fluctuations after a single-step photobleaching transition (black arrow) indicates a single receptor molecule is observed.
(B) Single-molecule fluorescence intensity trajectory of A2AAR in complex with the agonist NECA. Intensity jumps are observed among three intensity states at ~200 a.u., ~400 a.u. and ~600 a.u. Same presentation details as in (A). The selected trace shows the range of transitions between different events, including several transitions to State 3 before photobleaching.
(C) Histogram compiled from 239 receptor molecules of A2AAR where no ligand was added to the sample (apo). The dashed black and blue lines represent fits to two gaussian populations centered around the normalized intensities of 1 and 2. Fluorescence intensities are normalized to the mean intensity of the low-intensity state. The composite fit representing the sum of the two gaussian fitted curves is shown as the solid black line. Error bars represent the standard error calculated for each bar of the histogram.
(D) Histogram compiled from 229 receptor molecules of A2AAR in complex with the agonist NECA. The dotted black and blue lines represent fits to two gaussian populations centered around the normalized intensities of 1 and 2, and the red dotted curve represents a fit to a third gaussian population centered around the normalized intensity of 3. The composite fit representing the sum of the three gaussian fitted curves is shown as the solid black line. Other presentation details same as in (C).
(E) Histogram compiled from 288 receptor molecules of A2AAR in complex with the antagonist ZM241385. Same presentation details as in (C).
(F) Histogram compiled from 315 receptor molecules of A2AAR in complex with the agonist CGS21680. Same presentation details as in (D)
See also Figures S1 and S2
Two predominant fluorescence emission states are observed with apo and antagonist-bound A2AAR in lipid nanodiscs
The majority of apo A2AAR-Cy3 trajectories showed dynamic behavior where the fluorescence intensity reversibly fluctuated primarily between two intensity states (Figures 1A and S3). We normalized the fluorescence intensities with the mean intensity of the lowest intensity states at each point and compiled traces of 239 individual molecules to generate a histogram (Figure 1C). The histogram shows two distinct peaks centered around two different intensity states with relative areas of 62% and 38% that we assigned as State 1 and State 2, respectively (Figure 1C).
Similar to apo A2AAR-Cy3, the majority of A2AAR-Cy3 molecules in complex with the antagonist ZM241385 also showed dynamic behavior with fluorescence intensities that fluctuated between two intensity states (Figure 1E) with the same mean fluorescence emission intensities observed for apo A2AAR-Cy3. The resulting histogram generated from single-molecule traces of 288 molecules of A2AAR-Cy3 in complex with ZM241385 showed two distinct states centered around the same intensity values as apo A2AAR-Cy3 with relative areas of 59% for State 1 and 41% for State 2, comparable to observations with apo A2AAR-Cy3 (Figure 1, C and E). For both apo and antagonist-bound A2AAR-Cy3, we also observed a relatively small population of transitions to an even higher third intensity state (Figure 2, C and E); however, the number of these transitions was not sufficient to populate this state on the histogram.
Figure 2. Structural models and representative fluorescence intensity trajectories from individual Cy3-labeled A2AAR single molecules in complex with different ligands and with no ligand added (apo).

(A) A structural model of A2AAR in complex with the antagonist ZM241385 is shown in grey ribbon representation. ZM241385 is shown in cyan stick representation, and the Cy3 fluorophore covalently attached to position C289 is shown in red space-filling representation. Cy3 is positioned near the interface between the lipid bilayer and surrounding aqueous solution and is expected to exhibit a lower fluorescence emission due to a larger magnitude of conformational flexibility.
(B) A structural model of A2AAR in complex with the agonist NECA is shown in grey ribbon representation. NECA is shown in cyan stick representation, and the Cy3 fluorophore covalently attached to position C289 is shown in green space-filling representation. Cy3 is located near the intracellular surface and surrounded by transmembrane helices (TM) 2, 3, 6 and 7, as well as ICL1 and ICL2, as annotated. In this position, the rate of isomerization of Cy3 fluorophore decreases, leading to an expected increase in fluorescence emission.
(C) A structural model of A2AAR in a tertiary complex with the agonist NECA and GαS. A2AAR is shown in grey ribbon representation, NECA is shown in cyan stick representation, and GαS is shown in blue ribbon representation.
(D) A dynamic trajectory of A2AAR-Cy3 without ligand added (apo). The Cy3 intensity is normalized by the mean value of the lowest intensity state. The intensity trajectories (black) are fitted by a three-state Hidden Markov model (red). The trace shows a few transitions to state 3 that are very short in duration.
(E) A dynamic trajectory of the A2AAR with agonist, NECA. The trace for A2AAR in complex with an agonist shows more frequent transitions to a third, higher intensity state and also show that the molecule spends a longer time in the third state as compared to traces with no ligand and antagonist (ZM241385).
(F) A dynamic trajectory of A2AAR in complex with the antagonist ZM241385. Similar to the apo trace, the signal only spends a short time in state 3.
(G) A dynamic trajectory of the A2AAR with agonist CGS21680. Same presentation details as in (E).
(H) An expanded view of the trajectory from 38 to 48 seconds from the section in panel (E) indicated by orange vertical dashed lines. The expanded view shows clear transitions between states 1 to 2 and states 2 to 3 and also shows a rare direct transition from state 3 to state 1.
(I) An expanded view of the trajectory from 10 to 20 seconds from the section in panel (F) marked by blue vertical dashed lines. Multiple sequential transitions between states 1 to 2 and states 2 to 3 are shown.
See also Figures S3 and S4
Three fluorescence emission states are observed with agonist-bound A2AAR in lipid nanodiscs
Single-molecule fluorescence traces of A2AAR-Cy3 in complexes with the agonists NECA and CGS21680 showed dynamic behavior for a majority of the observed molecules. In traces of agonist-bound A2AAR-Cy3, three distinct emissions intensities were observed (Figure 1B). For the A2AAR-Cy3 complex with NECA, traces from 229 molecules were compiled into a histogram (Figure 1D), which showed distinct changes compared with the histograms for apo and antagonist-bound A2AAR-Cy3. Compared to apo and antagonist-bound A2AAR-Cy3, the histogram for A2AAR-Cy3 in complex with NECA showed a decrease in the population of State 1 (49%), an increase in the population of State 2 (39%) and the emergence of a third peak, which we defined as “State 3” (12%) (Figure 1D). Single-molecule experiments with A2AAR-Cy3 in complex with a second agonist, CGS21680, showed similar behavior to the complex with NECA. A histogram compiled from traces of 315 molecules of A2AAR-Cy3 in complex with CGS21680 showed three distinct states with relative areas of 46%, 39% and 15% calculated for States 1, 2 and 3, respectively (Figure 1F).
Structural models of A2AAR-Cy3 provide a rational for two of the observed fluorescence intensities
Because the Cy3 fluorescence emission intensity depends on the local environment of the fluorophore, changes in the fluorescence emission are strongly correlated with changes in protein structure and the environment of Cy3 (Hwang et al., 2011; Lamichhane et al., 2015; Lamichhane et al., 2020; Stennett et al., 2015). To investigate the structural basis for the observed different fluorescence intensities of A2AAR-Cy3 complexes, we generated three computational models of A2AAR-Cy3 by covalently docking the fluorophore to representative crystal structures of human A2AAR and followed this with extensive atomistic MD simulations (see STAR Methods). From these models, we investigated the range of possible orientations of Cy3 and the local environment around the dye, which can control the conformational degrees of freedom of the dye and influence fluorescence emission intensities.
Three structures were chosen as representatives for generating the initial models: A2AAR in complex with the antagonist ZM241385 (PDB ID 4EIY) (Liu et al., 2012), A2AAR in complex with the full agonist NECA (PDB ID 2YDV) (Lebon et al., 2011) and a tertiary complex with NECA and an engineered G protein, “mini GαS” (PDB ID 5G53) (Carpenter et al., 2016). For each case, the initial model was created by manually covalently docking Cy3 to the sidechain of C2897.54 and the corresponding system subjected to triplicate MD simulations, accounting for a total sampling time of 1.5 μs for each conformation. Evaluation of the trajectories included a cluster analysis of the conformations visited by the Cy3 molecule (Figure S4) and a contact map to detect and visualize potential interactions of Cy3 with nearby aromatic residues.
In all simulations of antagonist-bound A2AAR-Cy3, Cy3 is consistently oriented toward the intracellular interface between the membrane bilayer and surrounding aqueous solution (Figure 2A) and exhibited a relatively large degree of conformational freedom, as observed in the principal component analysis (PCA) and cluster analysis (Figure S4). A larger degree of conformational freedom of the dye results in lower fluorescence emission, and thus we assigned State “1” to the antagonist-bound conformation. This assignment is also consistent with the larger observed population of State 1 in the histograms of apo and antagonist-bound A2AAR-Cy3 (Figure 2, E and G).
In simulations of agonist-bound A2AAR-Cy3, Cy3 is located in a very different environment than for apo and antagonist-bound A2AAR-Cy3 and is observed to be surrounded by the intracellular ends of several transmembrane helices (TM) 2, 3, 6 and 7 and intracellular loops 1 and 2 (Figure 2B). In this environment, Cy3 shows a smaller degree of conformation freedom, which would result in higher fluorescence emission. We thus assigned State 3 to the agonist-bound A2AAR conformation based on the significantly increased transitions to State 3 for the agonist complexes. Comparing the conformation of the dye between agonist-bound and antagonist-bound A2AAR-Cy3, one can observe a clear dependence of the dye orientation on the global conformation of the receptor. In particular, the orientation of C2897.54, where the dye is covalently attached, strongly depends on the backbone configuration of helix 7, which changes between inactive and active conformations of A2AAR (Carpenter et al., 2016; Lebon et al., 2011; Xu et al., 2011). Thus, changes in the observed intensity of Cy3 related to differences in the efficacies of bound ligands could be assigned to large conformational changes in the structure of A2AAR-Cy3. As expected, no interconversion between structures was observed in our simulations, since the time scale of the atomistic MD simulations is orders of magnitude shorter than the time scales reported for the exchange between inactive and active conformational states (Horst et al., 2013; Sušac et al., 2018).
In MD simulations of A2AAR-Cy3 in a tertiary complex with the agonist NECA and mini GαS, Cy3 shows a similar local environment as described for the A2AAR-Cy3 complex with NECA (Figure 2, B and C). Based on this result, we expect that the fluorescence emission intensity of Cy3 is similar between the agonist-bound conformation and the tertiary conformation. From the above analysis, it follows that the fluorescence emission state defined as State 2 is likely not represented among currently available structures of A2AAR.
Transitions among fluorescence intensity states occur in a reversible sequential order
Fluorescence intensities for normalized single-molecule time trajectories were fit using a three-state hidden Markov model (McKinney et al., 2006). The fitted lines are shown by the red lines in Figure 2. Results from fitting the trajectories were consistent with the intensity histograms of Figure 1. For apo A2AAR-Cy3, the majority of molecules transitioned between two states, State 1 and State 2 (Figure S3A). A much smaller number of transitions to a higher intensity state, State 3 (Figure 2C and Table S1) were also observed but did not occur with sufficient frequency to populate the histogram (Figure 1C). The A2AAR-Cy3 complex with the antagonist ZM241385 showed behavior similar to apo A2AAR-Cy3, with the vast majority of transitions occurring between States 1 and 2 (Figure 2E). In contrast to these data, the A2AAR-Cy3 complexes with agonists NECA and CGS21680 showed more frequent transitions between State 2 and State 3 (Figure 2, E and G). For agonist-bound A2AAR, transitions to State 3 remained in State 3 for a longer duration than for apo and antagonist-bound A2AAR (Figure 2, E and G and Table S1).
To further visualize the frequencies of transitions and the connectivity of the three intensity states, we generated two-dimensional Transition Density Plots (TDP) by using transitions from the fitted traces (Figure 3). TDPs of apo A2AAR-Cy3 clearly showed two densities populated around normalized intensities 1 and 2 (Figure 3A), signifying frequent and prominent reversible transitions between State 1 and State 2. Similar transitions were also observed between States 1 and 2 in the TDP for the A2AAR-Cy3 complex with the antagonist ZM241385 (Figure 3B).
Figure 3. Transition density plots (TDPs) of A2AAR complexes with different ligands and without ligand.

The TDPs are generated from the normalized initial and final intensities. In these plots, ‘n’ represents the number of transitions used to prepare the TDPs. The gradient color scheme is indicated in the rightmost bar, where the arrowhead points toward relatively higher density, which relates to the frequency of observed transitions.
(A and B) The TDPs of apo and antagonist-bound A2AAR show that transition events predominantly occur between states 1 and 2.
(C and D) The TDPs of A2AAR in complexes with the agonists NECA and CGS21680 show that transition events occur between states 1 and 2 and between states 2 and 3 with measurable frequencies. Only negligible densities are observed between states 1 and 3, indicating that very few transitions occur directly between those two states.
TDPs of A2AAR-Cy3 complexes with the agonists NECA and CGS21680 were significantly different from apo and antagonist-bound A2AAR-Cy3 (Figure 3). In the presence of agonists, we observed that the receptor more frequently transitioned to State 3 and also spent a longer time at State 3 before returning to State 2 (Figure 3, C and D, and Table S1). TDPs for A2AAR-Cy3 complexes with the agonists NECA and CGS21680 revealed a third region with clear density at the intersection of States 2 and 3. We further analyzed the hidden Markov fitted time trajectories to quantify the relative number of sequential transitions between State 1, State 2 and State 3. Fewer than 2 % of the total transitions were occurred directly between State 1 and State 3. These rare transitions were observed for both agonist-bound and antagonist-bound A2AAR, however the addition of agonist did not increase the frequency of these rare transitions. This observation is reflected in the corresponding TDPs, which do not show measurable densities related to direct transitions between State 1 and State 3 (Figures 3, C and D). Overall, these data indicate that for agonist-bound A2AAR, transitions between State 1 and State 3 almost always proceed through State 2, which may be a potential intermediate state required for receptor activation.
DISCUSSION
We observed three distinct fluorescence emission states for agonist-bound A2AAR-Cy3 (Figures 1 and 2). These distinct fluorescence emission states corresponding to different local environments of the Cy3 fluorophore bound to position 289 in helix 7 (Figure 2, A-C). The three states are also observed for the complex with the antagonist ZM241385 and the apo receptor (Figure 2, C and D), though the population of the highest emission state for apo and antagonist-bound A2AAR was too low to visualize as a significant fraction of the total population in histograms (Figure 1). MD simulations of A2AAR-Cy3 indicate that due to steric hindrances, the fluorophore cannot change local environments without larger structural rearrangements of the receptor (Figure 2, A-C). Thus, the different emission states likely correlate with backbone rearrangements of the A2AAR transmembrane helices at the intracellular surface.
The observation of three distinct states is interesting when compared with earlier single-molecule fluorescence studies of the β2-adrenergic receptor, where two conformational states were observed in single-color TIRF experiments that used a similar experimental design as the present study (Lamichhane et al., 2015; Lamichhane et al., 2020). Two conformational states were also reported in single-molecule FRET experiments (Gregorio et al., 2017). The different number of observed emission states between A2AAR and β2AR, suggest potential differences in mechanisms of activation and indicate that further investigations of many more different class A GPCRs are needed to develop a more general understanding of GPCR function-related conformational dynamics.
Results from the Hidden Mark analysis revealed a correlation between the frequency of transitions between state 2 and state 3 and ligand efficacy. Relative to the apo receptor, we observed the number of molecules transitioning between states 2 to 3 increased significantly for complexes with agonists and did not significantly change for complexes with antagonists (Table S2). Intriguingly, the Hidden Mark analysis also showed only a slight correlation between ligand efficacy and frequency of transitions between states 1 and 2 (Table S2). Taken together, these results suggest the possibility of subtle differences in the conformation of state 2 for antagonist complexes and for agonist complexes that may not be visible at the intracellular surface of the protein but are related to different frequencies of transitions to state 3.
In the present study, the integration time of the camera used for data acquisition was 100 ms, so fluctuations in the fluorescence intensity must occur on time scales equal to or slower than 100 ms to be observed, corresponding to rates of exchange processes on the order of 10 s−1 or slower. These relatively slower processes are in line with rates of exchange between different conformational states measured in 19F-NMR experiments of A2AAR in detergent micelles containing DDM and CHS (Sušac et al., 2018). These slower rates and are also in line with rates of slow conformational exchange in β2AR estimated by 19F-NMR to be kex ≤ 10 s−1 (Horst et al., 2013). MD simulations in the present work could detect two different conformational states of A2AAR-Cy3 but are not sufficiently long to detect these slow transitions between different conformational states observed in single-molecule fluorescence data.
The present work complements other recent single-molecule studies of A2AAR that measured dynamic processes on relatively faster time scales. In a recent report of single-molecular FRET of A2AAR in detergent micelles containing LMNG and CHS, ligand-depending shifts and broadening of smFRET distributions were interpreted to suggest exchange between inactive and active conformations of A2AAR that occurred on a timescale of ~3 ms or kex ≥ ~30–40 s−1 (Fernandes et al., 2021). In a separate study, Maslov et al. reported observations of exchange processes on a similar time scale of sub-millisecond to low millisecond fluctuations with A2AAR in nanodiscs containing POPC and POPG lipids (Maslov et al., 2020). Both the Fernandes et al. and Maslov et al. studies utilized a diffusion-based experimental design in which the observation of FRET signals depends on the rate of diffusion of the receptors in aqueous solutions. This design would not permit observations of exchange processes with rates that are reported here. With the TIRF experimental design, molecules are tethered to the microscope slide, which allows one to monitor dynamics on relatively longer time scales. The relatively faster dynamics reported by Fernandes and Maslov may have also occurred with A2AAR samples in the present study but were not observed due to limitations of the time resolution of the camera.
One of the more surprising observations of this work is the reversible temporal ordering of the fluorescence emission states (Figure 4). This observation is reminiscent of single-molecule FRET data from a recent study of a class C GPCR dimer where receptor monomers were labeled with different fluorophores and FRET measurements were recorded between each monomer in a functional dimer (Liauw et al., 2021). In Liauw et al., FRET data were interpreted as evidence of “conformational checkpoints” that suggested an activation process involving step-wise interactions between monomers in the homodimer (Liauw et al., 2021). Here we observed a step-wise process involving conformational changes within a class A GPCR monomer. This observation creates a distinct framework for understanding GPCR activation processes and for resolving questions in future studies of how orthosteric ligands, allosteric modulators and mutations may potentially alter the order of these exchange processes.
Figure 4. Schematic of the temporal ordering observed for transitions among A2AAR conformational states.

For each receptor cartoon representation, the color of the rightmost intracellular helix corresponds to the color scheme used with the histograms shown in Figure 2 panels C-F.
(A) For apo A2AAR and antagonist-bound A2AAR, transitions are predominantly observed between states 1 and 2, indicated by the black arrows. Far fewer transitions are observed between states 2 and 3, indicated by the grey arrows.
(B) For agonist-bound A2AAR, transitions are observed between states 1 and 2 and between states 2 and 3 (black arrows).
(C) Transitions directly between states 1 and 3 are only very rarely observed, as indicated by the red ‘X’.
STAR METHODS
RESOURCE AVAILABILITY
Lead Contact
Lead Contact: Dr. Rajan Lamichhane (rajan@utk.edu). Further information and requests for resources or reagents should be directed to and will be fulfilled by the Lead Contact.
Materials Availability
All unique reagents generated in this study are available from the Lead Contact by request and with a completed Materials Transfer Agreement.
Data and Code Availability
All data reported in this paper will be shared by the lead contact upon request.
This paper does not report original code.
Any additional information required to reanalyze the data reported in this paper is available from the lead contact upon request.
EXPERIMENTAL MODEL AND SUBJECT DETAILS
Microbes
XL-10 E. coli cells were cultured in LB media, BL21 (DE3) cells were cultured in TB media, and the BG12 strain of P. pastoris was cultured in BMGY and BMMY media.
Cell lines
All cell lines used in this study were authenticated by the suppliers and were chosen to remain consistent with previous studies.
METHOD DETAILS
Mutagenesis
PCR-based site-directed mutagenesis (QuickChange II, Strategene, CA) was used to generate the A2AAR A289C variant used for single-molecule fluorescence experiments. Primers used for this effort are provided in the Key Resources Table.
KEY RESOURCES TABLE
| REAGENT or RESOURCE | SOURCE | IDENTIFIER |
|---|---|---|
| Antibodies | ||
| Monoclonal ANTI-FLAG® M2-Alkaline Phosphatase antibody produced in mouse | Sigma-Aldrich | Cat#A9469 |
| Bacterial and virus strains | ||
| XL10-Gold ultracompetent cells | Agilent | Cat#200314 |
| BL21 DE3 cells | Agilent | Cat#200132 |
| Chemicals, peptides, and recombinant proteins | ||
| n-Dodecyl-b-D-Maltopyranoside (DDM) | Anatrace | Cat#D310 |
| Cholesteryl hemisuccinate (CHS) | Sigma-Aldrich | Cat#C6512 |
| Adenosine 5’-triphosphate disodium salt hydrate (ATP) | Sigma-Aldrich | Cat#A2383 |
| DPN I | NEB | Cat#R0176S |
| YNB (without amino acids and ammonium salts) | RPI | Cat#Y20060 |
| Biotin | Sigma-Aldrich | Cat#B4639 |
| 4-(2-[7-Amino-2-(2-furyl)[1,2,4]triazolo[2,3-a][1,3,5]triazin-5-ylamino]ethyl)phenol (ZM241385) | Tocris | Cat#1036 |
| 5’-N-Ethylcarboxamidoadenosine (NECA) | Tocris | Cat#1691 |
| Xanthine amine congener (XAC) | Tocris | Cart#3200 |
| 4-[2-[[6-Amino-9-(N-ethyl-b-D-ribofuranuronamidosyl)-9H-purin-2-yl]amino]ethyl]benzenepropanoic acid hydrochloride (CGS21680) | Tocris | Cat#1063 |
| Theophylline | Sigma-Aldrich | Cat#T1633 |
| [3H]4-[2-[7-amino-2-(2-furyl)-1,2,4-triazolo[1,5-a][1,3,5]triazin-5-yl-amino]ethylphenol ([3H]ZM241385) | American Radiolabeled Chemicals | Cat#ART0884-50 |
| TALON Metal Affinity Resin | Gold bio | Cat#H-310-5 |
| 1-palmitoyl-2-oleoyl-glycero-3-phosphocholine (POPC) | Avanti | SKU#850457 |
| 1-palmitoyl-2-oleoyl-sn-glycero-3-phospho-L-serine (sodium salt) (POPS) | Avanti | SKU#840034 |
| 1,2-dipalmitoyl-sn-glycero-3-phosphoethanolamine-N-(cap biotinyl) (sodium salt) | Avanti | SKU#870277 |
| Cholic Acid, Sodium Salt | Anatrace | Cat#S1010S |
| Isopropyl β- d-1-thiogalactopyranoside (IPTG) | Goldbio | Cat#I2481C |
| Triton X-100 | Sigma-Aldrich | Cat#T8787 |
| SnakeSkin™ Dialysis Tubing, 10K MWCO, 22 mm | ThermoFischer Scientific | Cat#68100 |
| Bio-beads SM-2 Adosrbents | Biorad | Cat#1523920 |
| Glucose Oxidase | Sigma-Aldrich | Cat# G2133 |
| Streptavidin | Thermo Fisher | Cat# S888 |
| Cy3 maleimide, | GE Healthcare | PA23031 |
| mPEG-SVA, MW 5,000 | Laysan Bio | M-SVA |
| Biotin-PEG-SVA, MW 5,000 | Laysan Bio | BIO-SVA |
| Catalase from bovine liver | Sigma-Aldrich | Cat# C100 |
| Deposited data | ||
| Thermostabilized A2AAR in complex with NECA | Lebon et al. 2011 | PDB:2YDV |
| A2AAR in complex with NECA bound to an engineered G protein | Carpenter et al. 2016 | PDB:5G53 |
| A2AAR-BRIL bound to ZM241385 | Liu et al. 2012 | PDB:4EIY |
| Experimental models: Organisms/strains | ||
| P. pastoris: Bg12 | BioGrammatics | Cat#PS004-01 |
| Oligonucleotides | ||
| A2AAR_A289C_F:TCGGTTGTGAATCCCTTCATTTACTGCTACCGTATCCGCGAGTTCCGCCAG | This study | n/a |
| A2AAR_A289C_R:CTGGCGGAACTCGCGGATACGGTAGCAGTAAATGAAGGGATTCACAACCGA | This study | n/a |
| Recombinant DNA | ||
| Plasmid: human A2AAR (1-316) in pPIC9K | Eddy et al. 2018 | n/a |
| Plasmid: human A2AAR[A289C] | This study | n/a |
| Software and algorithms | ||
| GraphPad prism | GraphPad Software Inc. | https://www.graphpad.com |
| PyMOL | Pymol.org | https://pymol.org/2/ |
| GROMACS | Gromacs.org | https://www.gromacs.org/ |
| Maestro | Schrodinger | https://www.schrodinger.com/products/maestro |
| IDL | l3harrisgeospatial.com, Version 8.7 | https://www.l3harrisgeospatial.com |
| HaMMy | McKinney et al., 2006 | https://ha.med.jhmi.edu/resources |
| Igor Pro | Wavemetrics.com | https://www.wavemetrics.com/downloads |
| Single software | Ha Lab | https://ha.med.jhmi.edu/resources |
| Other | ||
| PD-10 column | Cytiva | Cat#17085101 |
| Vivaspin 20 ultrafiltration spin columns 30kDa MWCO | Cytiva | Cat#28932361 |
MSP1D1 expression and purification
MSP1D1 was expressed and purified similar to protocols described in previous studies (Bayburt and Sligar, 2010; Hagn et al., 2018). MSP1D1 encoded in the open reading frame of a pET28a vector (Invitrogen) was transformed into the BL21 (DE3) E. coli strain. A single transformed colony was inoculated into 5 mL Luria–Bertani (LB) broth containing 50 mg/mL kanamycin and incubated overnight at 37 °C with shaking. 1L Terrific Broth (TB) media was inoculated with the overnight culture and allowed to reach an optical density of 0.6-0.8, and protein expression was induced with 1 mM isopropyl β-D-1-thiogalactopyranoside (IPTG) and allowed to proceed for 4 hours at 37 °C. The cells were harvested by centrifugation at 4000 x g for 30 min, frozen in liquid nitrogen and stored at −80 °C for later use. The cell pellets were thawed and resuspended in lysis buffer (50 mM Tris-HCl, pH 8.0, 500 mM NaCl, 1% Triton X-100, and 1 mM EDTA) at 20 mL of buffer per gram of cell pellet and 100 μL of in-house prepared protease inhibitor solution was added. The resuspended cells were lysed with a single pass through a cell disruptor (Pressure Biosciences) operating at 20,000 psi. Insoluble material was separated by ultracentrifugation at 20,000 x g at 4 °C for 45 minutes, and the supernatant was applied to a Ni-NTA column equilibrated with 50 mM Tris-HCl, pH 8.0, 500 mM NaCl, and 1% (w/v) Triton X-100. The column was washed with 5 CV of wash buffer 1 (50 mM Tris-HCl, pH 8.0, 500 mM NaCl, and 1% (w/v) Triton X-100), washed with 5 CV of buffer 2 (50 mM Tris-HCl, pH 8.0, 500 mM NaCl, and 50 mM cholate), washed with 5 CV of buffer 3 (50 mM Tris-HCl, pH 8.0, and 500 mM NaCl) and washed with 5 CV of buffer 4 (50 mM Tris-HCl, pH 8.0, 500 mM NaCl, and 20 mM imidazole). MSP1D1 was eluted with 5 CV of buffer containing 50 mM Tris-HCl, pH 8.0, 500 mM NaCl, and 500 mM imidazole. Fractions containing MSP1D1 were pooled and dialyzed against 50 mM Tris-HCl, pH 8.0, 20 mM NaCl and 0.5 mM EDTA in dialysis tubing with a 10 kDa MWCO (Thermo-Fisher Scientific). MSP1D1 was then incubated with TEV protease at a 1:100 (TEV: MSP) molar ratio overnight at 4 °C. The protein solution was applied to a nickel column and the flow-through fraction containing purified MSP1D1 was collected. MSP1D1 was then transferred into a storage buffer containing 20 mM Tris, pH 7.5, 100 mM NaCl, and 0.5 mM EDTA by dialysis for 4 hours using dialysis tubing with a 10 kDa MWCO (Thermo-Fisher Scientific). MSP1D1 was concentrated to 1 mM, frozen in liquid nitrogen and stored at −80 °C for future use.
A2AAR Production
The gene encoding human A2AAR(1-316) containing a point mutation to remove the only glycosylation site (N154Q), an N-terminal FLAG tag, and a 10 X C-terminal His tag was cloned into a pPIC9K vector (Invitrogen) at the BamHI and NotI restriction sites. Alanine 289 was replaced with cysteine via site-directed mutagenesis, and the resulting plasmid was introduced by electroporation into the BG12 strain of Pichia pastoris (Biogrammatics). Transformed colonies were screened for optimal protein expression using a previously reported Western blot assay (Eddy et al., 2017) that utilizes an anti-FLAG monoclonal conjugated antibody to identify high-expressing clones. Once identified, glycerol stocks were prepared from high-expressing clones and stored at −80 °C. Small scale cultures containing 4 mL buffered minimal glycerol (BMGY) media in 15 mL culture tubes were inoculated from the glycerol stock and grown at 30 °C for 48 hours to reach an optical density of 9-10. These cultures were then used to inoculate 50 mL BMGY medium in a 250 mL baffled flask and incubated at 30 °C for approximately 60 hours to reach an optical density of 15-20. Subsequently, 2.8 L baffled flasks containing 500 mL BMGY media were inoculated with the 50 mL cultures and incubated at 30 °C for 48 hours to reach an optical density of 15-20. Cells were collected by centrifugation at 3000 x g for 15 minutes and resuspended in 500 mL of buffered minimal methanol (BMMY) medium without methanol and the temperature was lowered to 28 °C. These cultures were incubated for 6 hours to ensure complete metabolic digest of glycerol before methanol was added to a final concentration of 0.5% w/v to induce protein expression. Two additional 0.5% w/v aliquots of methanol were added at 12 hour intervals after initial induction. Expression proceeded for a total of 36 hours and then cells were harvested by centrifugation at 3000 x g for 15 minutes. The isolated cell pellets were frozen in liquid nitrogen and stored at −80 °C for later purification.
A2AAR Purification
Cell pellets containing A2AAR were resuspended in lysis buffer (50 mM sodium phosphate pH 7.0, 100 mM NaCl, 5% glycerol (w/v), and in-house prepared protease inhibitor solution) and lysed by a single pass through a cell disruptor (Pressure Biosciences) operating at 40,000 psi. Membranes were isolated and collected by ultracentrifugation at 200,000 x g, frozen in liquid nitrogen and stored at −80 °C for future use. Isolated membrane pellets were resuspended in buffer (10 mM HEPES pH 7.0, 10 mM KCl, 20 mM MgCl2, 1M NaCl) and treated with 1mM theophylline and protease inhibitor solution for 1 hour. Subsequently, protein was extracted from the membrane in buffer containing 0.5% (w/v) n-Dodecyl-β-D-Maltopyranoside (DDM), 0.05% cholesteryl hemisuccinate (CHS), 50 mM HEPES pH 7.0, and 500 mM NaCl for 6 hours at 4 °C. Then insolubilized material was separated by ultracentrifugation at 200,000 x g for 30 min, and the supernatant was collected and incubated overnight at 4 °C with Co2+-charged affinity resin (Talon, Takara Bio USA) and 30 mM imidazole. The resin was then washed with 20 CV of wash buffer 1 (50 mM HEPES pH 7.0, 500 mM NaCl, 10 mM MgCl2, 30 mM imidazole, 8 mM ATP, 0.05% DDM, and 0.005% CHS). Resin was collected and washed 2 more times with 20 CV of wash buffer 2 (25 mM HEPES pH 7.0, 250 mM NaCl, 5% glycerol, 30 mM imidazole, 0.05% DDM, 0.005% CHS, and ligand), and eluted with buffer 3 (50 mM HEPES pH 7.0, 250 mM NaCl, 5% glycerol, 300 mM imidazole, 0.05% DDM, 0.005% CHS, and ligand). After elution, the protein was exchanged into a final buffer (25 mM HEPES pH 7.0, 75 mM NaCl, 0.05% DDM, 0.005% CHS, and ligand), using a PD-10 desalting column (Cytiva). All buffers were prepared with a saturating concentration of the required ligand. Apo protein was purified without addition of ligand to the sample preparation buffers.
Single-Molecule Fluorescence Sample Preparation
Assembly of nanodiscs followed protocols adapted from previous studies (Bayburt and Sligar, 2010; Hagn et al., 2018) that were further optimized for experiments with A2AAR. Purified A2AAR was mixed with purified MSP1D1 and lipids solubilized in buffer (25 mM Tris pH 8.0, 150 mM NaCl and 200 mM sodium cholate) in a molar ratio of 1:5:250 (A2AAR:MSP1D1:lipids). Lipids were mixed in a molar ratio of 65:30:5 (POPC:POPS:biotin-POPE) prior to mixing with A2AAR and MSP1D1. The mixture of A2AAR, MSP1D1 and lipids was incubated for 4 hours at 4 °C. Subsequently, bio-beads (Bio-Rad Laboratories) were added to the mixture and incubated overnight at 4 °C. The bio-beads were then removed and the resulting mixture was incubated with Ni-NTA resin (GoldBio) for 24 hours at 4 °C. After overnight incubation, a 10 fold molar excess of the Cy3 maleimide fluorophore (GE Healthcare) was added to the mixture and incubated in the dark at 4 °C for 3 h. The resin was then washed with 2 CV of a wash buffer (50 mM HEPES, pH 7.0, 150 mM NaCl and 10 mM imidazole), and nanodiscs containing A2AAR were eluted with buffer (50 mM HEPES, pH 7.0, 150 mM NaCl, 300 mM imidazole and ligand). After elution, any remaining excess fluorophore was removed by exchanging the sample into a final buffer (25 mM HEPES pH 7.0, 75 mM NaCl, and ligand) using a PD-10 desalting column (Cytiva). All buffers were prepared with a saturating concentration of ligand or without ligand added (apo).
Radioligand Binding Assays for A2AAR in Lipid Nanodiscs
Radioligand binding assays were performed with the same samples of A2AAR[A289C] used for single molecule fluorescence experiments; i.e., in nanodiscs containing the same lipid composition and with the Cy3 fluorophore covalently attached at position 289. For the displacement binding experiments, increasing concentrations of cold ligands were incubated with the radioligand [3H]ZM241385 (American Radiolabeled Chemicals, St. Louis, MO) and with 0.125-0.25 μg of nanodiscs containing A2AAR in buffer containing 25 mM HEPES pH 7.0 and 75 mM NaCl for 60 min at room temperature. Binding reactions were terminated by filtration using the Microbeta filtermat-96 cell harvester (PerkinElmer, Waltham, MA) and radioactivity was measured using a MicroBeta2 microplate counter (PerkinElmer, Waltham, MA). Specific binding at A2AAR was determined as the difference in binding obtained in the absence and presence of 10 μM ZM241385.
Single-Molecule Fluorescence Data Acquisition
Single-molecule fluorescence data were recorded using a customized prism-based TIRF imaging system based on an inverted IX73 microscope (Olympus) and customized TIRF stage (TIRF Labs Inc., Cary, NC, U.S.A.) as described in earlier publications (Berezhna et al., 2012; Stefanski et al., 2021). Quartz microscope slides (G. Finkenbeiner, Waltham MA) and coverslips were cleaned and passivated with polyethylene glycol (m-PEG-SVA) and 3% biotin-PEG-SVA (Laysan Bio Inc, Arab, AL) as previously described (Lamichhane et al., 2010). A sample chamber was prepared using PEGylated slides and coverslips using double-sided tape and coated with 0.02 mg/ml streptavidin (Stefanski et al., 2021). Nanodiscs containing A2AAR and 5% biotin-PE in imaging buffer (20 mM HEPES pH 7.5, 75 mM NaCl, 2 mM Trolox and saturating concentration of ligand or no ligand added) were introduced into the sample chamber and incubated for 10 minutes. The sample chamber then was rinsed with imaging buffer to remove any nonspecific molecular species. The chamber was rinsed with glucose oxidase and a catalase oxygen scavenging system in imaging buffer and excited using a green (532 nM) laser. The emission intensities from the Cy3 fluorophore were collected on an EMCCD camera (Andor Technology) with 100 ms integration time using a custom single-molecule data acquisition program (Stefanski et al., 2021). Single-molecule time trajectories were extracted using scripts written in IDL software (Harris Geospatial Solutions, Inc). The package for data acquisition and extraction was downloaded from the laboratory of Dr. Taekjip Ha (http://ha.med.jhmi.edu/resources/).
Molecular Dynamics Simulations
Molecular dynamics (MD) simulations of A2AAR with the Cy3 fluorophore conjugated to cysteine 289 were performed using three different initial configurations of the receptor structure. The initial configuration of antagonist-bound A2AAR was modeled from the crystal structure of A2AAR in complex with the antagonist ZM241385 and with a coordinated sodium ion in a putative allosteric site (PDB ID 4EIY) (Liu et al., 2012). Agonist-bound A2AAR was modeled from the crystal structure of A2AAR in complex with NECA (PDB ID 2YDV) (Lebon et al., 2011). A tertiary complex of A2AAR was modeled from the crystal structure of A2AAR in complex with NECA and an engineered G protein (“mini Gαs”; PDB ID 5G53) (Carpenter et al., 2016). The antagonist-bound A2AAR structure was prepared for MD simulations following previously reported procedures (Gutiérrez-de-Terán et al., 2013) that removed the non-native BRIL fusion protein used to facilitate crystallization and replaced the native residues in the third intracellular loops that were removed to facilitate crystallization. For agonist-bound A2AAR, the point mutations introduced to increase the melting temperature of the receptor for crystallization were reverted to their native amino acid types with Pymol (Schrodinger, 2015). Protons were added to all structures, and the protonation states of titratable residues, including histidine, were calculated and the hydrogen bonding network optimized with the protein preparation wizard tool in Maestro (Sastry et al., 2013). For all three structures, the native Ala2897.54 sidechain was replaced with cysteine, and the Cy3 fluorophore was modeled with manual covalent docking using a 3D-optimized conformation of the fluorophore built in Maestro and further optimized with the Macromodel tools within the Schrödinger suite (Schrödinger, 2021).
Each receptor construct was inserted into a solvated membrane model and equilibrated following the PyMemDyn protocol (Esguerra et al., 2016; Gutiérrez-de-Terán et al., 2013). The starting structures are automatically embedded in a pre-equilibrated membrane consisting of POPC lipids, and the transmembrane bundle was aligned to its vertical axis, i.e., the bundle of helices was aligned parallel to the Z-axis. This hexagonalprism shaped box is then soaked with bulk water and energy minimized with GROMACS 4.6 (Hess et al., 2008) using the OPLS-AA/M force field (Robertson et al., 2015) for the receptor and ligands and with Berger parameters for the lipids (Berger et al., 1997) together with the use of the half-e double-pairlist method (Chakrabarti et al., 2010) and the SPC water model (Berendsen et al., 1981). The same setup is used for a 2.5 ns MD equilibration under periodic boundary conditions (PBC), where initial restraints on receptor and ligand atoms are gradually released, followed by another 2.5 ns MD where only the distance restraints between interhelical contacts in class-A GPCRs were imposed, as previously described in detail (Esguerra et al., 2016). OPLS compatible parameters for all organic molecules (ZM241385, NECA and Cy3 maleimide) were generated with the LigParGen server (Dodda et al., 2017) and translated into GROMACS with ad hoc scripts. For the Cy3 maleimide covalently attached to Cys2897.54 a pseudoresidue was manually created. Each system was then subject to three replica MD simulations in GROMACS, each lasting for 0.5 ms. The isobaric NPT ensemble was used with a Nose-Hoover thermostat (Hoover, 1985; Nosé, 1984) with a target temperature of 310 K. Electrostatic interactions beyond a cutoff of 12 Å were estimated with the particle mesh Ewald method, and a 2 fs time step was used combined with the LINCS algorithm (Hess et al., 1997). All MD analyses were conducted with the mdtraj library (McGibbon et al., 2015). Molecular superimpositions, trajectory visualizations, and molecular images were performed with PyMOL. Analysis of the trajectories was performed with the MDtraj package (McGibbon et al., 2015).
QUANTIFICATION AND STATISTICAL ANALYSIS
Single-Molecule Fluorescence Data Analysis
Single-molecule fluorescence time trajectories were assessed and analyzed using custom software written in Matlab. Individual trajectories were selected for further analysis from trajectories with single-step photobleaching that displayed reversible fluorescent intensity fluctuations at different intensity states before bleaching, which are described as dynamic traces. Individual dynamic traces were background corrected and normalized to the mean value of the lower-intensity state, which is defined as a value of “1”. Each trace was truncated before photobleaching, and the traces were binned and compiled to generate intensity histograms.
Histograms for each A2AAR complex and for apo A2AAR were generated by compiling more than 200 normalized single-molecule traces from at least two independent experiments. Error bars on histograms are the standard error calculated from at least 5 independent movies used to generate the histograms. Similar approaches were also used to report error bars previously (Liauw et al., 2021). To fit and process histograms, we used the Igor Pro software (version 8.04, Wavemetrics, Lake Oswego, OR, USA). In more detail, histograms for apo and antagonist-bound A2AAR were fit with two Gaussian distributions, and agonist-bound A2AAR three Gaussian distributions using Igor’s Multipeak Fit 2 function as shown in equations 1 and 2, respectively.
| 1 |
| 2 |
In the equations above, y0 is a baseline, A is the peak amplitude, b is the intensity peak center, and w is the peak width. The Find Peaks algorithm was used to locate the number of peaks and fit those peaks using the mean conformational states as peak centers calculated from the transition density plots. We used 1.0, 1.9, and 2.6 normalized intensity peak centers to fit the peaks from states 1, 2, and 3, respectively. The third peak was not populated for Apo and ZM bound samples, so those data were fit with two distributions. After fitting, the area of individual peaks was calculated from the A and w values obtained from the fit.
A Hidden Markov model was used to fit individual trajectories into different states with the HaMMy program (McKinney et al., 2006). Transition density plots were generated from the HaMMy fitted data that provided the transition events between different states. We used custom software written with Python to generate the transition density plots (Pauszek III et al., 2021).
Quantification and Analysis of Ligand Binding for A2AAR in Lipid Nanodiscs
IC50 values were determined using a nonlinear, least-squares regression analysis by Prism 8 (GraphPad Software). IC50 values obtained from the displacement curves were converted to Ki values using the Cheng-Prusoff equation (Cheng and Prusoff, 1973). Data are expressed as the mean ± the standard error from three independent experiments performed in triplicate.
Supplementary Material
HIGHLIGHTS.
Single-molecule fluorescence observes slow dynamic behavior of A2AAR complexes
Three different fluorescence emission states observed for A2AAR complexes with agonists
Reversible transitions among different states occurred in a sequential order
A functionally-critical transition state not represented among available structures
ACKNOWLEDGMENTS
This work was supported by the national Institutes of Health, R35 GM142946 (R. L.) and the start-up funds from the College of Arts and Sciences, University of Tennessee, Knoxville (R. L.). This research was funded by the National Institutes of Health, R35 GM138291 (M.T.E, N.T., A.P.R and B.J.), DA048353 (L.R.M and C.R.M) and DA047855 (L.R.M and C.R.M), and a Ralphe E. Powe Junior Faculty Award from Oak Ridge Affiliated Universities (M.T.E). The simulations were conducted in the resources of the Swedish National Supercomputing Centers (SNIC). We thank Raymond Pauszek from The Scripps Research Institute for providing custom software to prepare the transition density plots.
Footnotes
DECLARATION OF INTERESTS
H.G.dT is a co-founder and stock holder of MODSIM Pharma AB.
Publisher's Disclaimer: This is a PDF file of an unedited manuscript that has been accepted for publication. As a service to our customers we are providing this early version of the manuscript. The manuscript will undergo copyediting, typesetting, and review of the resulting proof before it is published in its final form. Please note that during the production process errors may be discovered which could affect the content, and all legal disclaimers that apply to the journal pertain.
REFERENCES
- Aviram HY, Pirchi M, Barak Y, Riven I, and Haran G (2018). Two states or not two states: Single-molecule folding studies of protein l. J. Chem. Phys 148, 123303. [DOI] [PubMed] [Google Scholar]
- Bayburt TH, and Sligar SG (2010). Membrane protein assembly into Nanodiscs. FEBS Lett 584, 1721–1727. [DOI] [PMC free article] [PubMed] [Google Scholar]
- Berendsen HJ, Postma JP, van Gunsteren WF, and Hermans J (1981). Interaction models for water in relation to protein hydration. In Intermolecular Forces (Springer), pp. 331–342. [Google Scholar]
- Berezhna SY, Gill JP, Lamichhane R, and Millar DP (2012). Single-molecule Förster resonance energy transfer reveals an innate fidelity checkpoint in DNA polymerase I. J. Am. Chem. Soc 134, 11261–11268. [DOI] [PMC free article] [PubMed] [Google Scholar]
- Berger O, Edholm O, and Jähnig F (1997). Molecular dynamics simulations of a fluid bilayer of dipalmitoylphosphatidylcholine at full hydration, constant pressure, and constant temperature. Biophys. J 72, 2002–2013. [DOI] [PMC free article] [PubMed] [Google Scholar]
- Bostock MJ, Solt AS, and Nietlispach D (2019). The role of NMR spectroscopy in mapping the conformational landscape of GPCRs. Curr. Opin. Struct. Biol 57, 145–156. [DOI] [PubMed] [Google Scholar]
- Carpenter B, Nehmé R, Warne T, Leslie AGW, and Tate CG (2016). Structure of the adenosine A2A receptor bound to an engineered G protein. Nature 536, 104–107. [DOI] [PMC free article] [PubMed] [Google Scholar]
- Chakrabarti N, Neale C, Payandeh J, Pai EF, and Pomès R (2010). An ris-like mechanism ofpPore dilation in the corA magnesium transport tystem. Biophys. J 98, 784–792. [DOI] [PMC free article] [PubMed] [Google Scholar]
- Cheng Y-C, and Prusoff WH (1973). Relationship between the inhibition constant (Ki) and the concentration of inhibitor which causes 50 per cent inhibition (I50) of an enzymatic reaction. Biochem Pharmacol 22, 3099–3108. [DOI] [PubMed] [Google Scholar]
- Chung HS, McHale K, Louis JM, and Eaton WA (2012). Single-molecule fluorescence experiments determine protein folding transition path times. Science 335, 981–984. [DOI] [PMC free article] [PubMed] [Google Scholar]
- Clark LD, Dikiy I, Chapman K, Rödström KE, Aramini J, LeVine MV, Khelashvili G, Rasmussen SG, Gardner KH, and Rosenbaum DM (2017). Ligand modulation of sidechain dynamics in a wild-type human GPCR. Elife 6. [DOI] [PMC free article] [PubMed] [Google Scholar]
- Dodda LS, Cabeza de Vaca I, Tirado-Rives J, and Jorgensen WL (2017). LigParGen web server: an automatic OPLS-AA parameter generator for organic ligands. Nucleic Acids Res. 45, W331–W336. [DOI] [PMC free article] [PubMed] [Google Scholar]
- Eddy MT, Gao Z-G, Mannes P, Patel N, Jacobson KA, Katritch V, Stevens RC, and Wüthrich K (2018). Extrinsic tryptophans as NMR probes of allosteric coupling in membrane proteins: Application to the A2A adenosine receptor. J. Am. Chem. Soc 140, 8228–8235. [DOI] [PMC free article] [PubMed] [Google Scholar]
- Eddy MT, Lee M-Y, Gao Z-G, White KL, Didenko T, Horst R, Audet M, Stanczak P, McClary KM, Han GW, et al. (2017). Allosteric coupling of drug binding and intracellular signaling in the A2A adenosine receptor. Cell 172, 68–80. [DOI] [PMC free article] [PubMed] [Google Scholar]
- Eddy MT, Martin BT, and Wüthrich K (2021). A2A adenosine receptor partial agonism related to structural rearrangements in an activation microswitch. Structure 29, 170–176.e173. [DOI] [PMC free article] [PubMed] [Google Scholar]
- Esguerra M, Siretskiy A, Bello X, Sallander J, and Gutiérrez-de-Terán H (2016). GPCR-ModSim: A comprehensive web based solution for modeling G-protein coupled receptors. Nucleic Acids Res 44, W455–462. [DOI] [PMC free article] [PubMed] [Google Scholar]
- Fernandes DD, Neale C, Gomes G-NW, Li Y, Malik A, Pandey A, Orazietti AP, Wang X, Ye L, Scott Prosser R, et al. (2021). Ligand modulation of the conformational dynamics of the A2A adenosine receptor revealed by single-molecule fluorescence. Sci Rep 11, 5910–5916. [DOI] [PMC free article] [PubMed] [Google Scholar]
- Gregorio GG, Masureel M, Hilger D, Terry DS, Juette M, Zhao H, Zhou Z, Perez-Aguilar JM, Hauge M, Mathiasen S, et al. (2017). Single-molecule analysis of ligand efficacy in β2AR–G-protein activation. Nature 547, 68–73. [DOI] [PMC free article] [PubMed] [Google Scholar]
- Gutiérrez-de-Terán H, Massink A, Rodríguez D, Liu W, Han GW, Joseph JS, Katritch I, Heitman LH, Xia L, IJzerman AP, et al. (2013). The role of a sodium ion binding site in the allosteric modulation of the A2A adenosine G protein-coupled receptor. Structure 21, 2175–2185. [DOI] [PMC free article] [PubMed] [Google Scholar]
- Hagn F, Nasr ML, and Wagner G (2018). Assembly of phospholipid nanodiscs of controlled size for structural studies of membrane proteins by NMR. Nat Protoc 13, 79–98. [DOI] [PMC free article] [PubMed] [Google Scholar]
- Hauser AS, Attwood MM, Rask-Andersen M, Schiöth HB, and Gloriam DE (2017). Trends in GPCR drug discovery: new agents, targets and indications. Nat Rev Drug Discov 16, 829–842. [DOI] [PMC free article] [PubMed] [Google Scholar]
- Hess B, Bekker H, Berendsen HJC, and Fraaije JGEM (1997). LINCS: A linear constraint solver for molecular simulations. J Comput Chem 18, 1463–1472. [Google Scholar]
- Hess B, Kutzner C, van der Spoel D, and Lindahl E (2008). GROMACS 4: Algorithms for Highly Efficient, Load-Balanced, and Scalable Molecular Simulation. J Chem Theory Comput 4, 435–447. [DOI] [PubMed] [Google Scholar]
- Hoover W (1985). Canonical dynamics: Equilibrium phase-space distributions. Phys.Rev. A, 31, 1695–1697. [DOI] [PubMed] [Google Scholar]
- Horst R, Liu JJ, Stevens RC, and Wüthrich K (2013). β2 -adrenergic receptor activation by agonists studied with 19 F NMR spectroscopy. Angew Chem 52, 10762–10765. [DOI] [PMC free article] [PubMed] [Google Scholar]
- Huang SK, Pandey A, Tran DP, Villanueva NL, Kitao A, Sunahara RK, Sljoka A, and Prosser RS (2021). Delineating the conformational landscape of the adenosine A2A receptor during G protein coupling. Cell 184, 1884–1894.e1814. [DOI] [PMC free article] [PubMed] [Google Scholar]
- Hwang H, Kim H, and Myong S (2011). Protein induced fluorescence enhancement as a single molecule assay with short distance sensitivity. Proc Natl Acad Sci U S A 108, 7414–7418. [DOI] [PMC free article] [PubMed] [Google Scholar]
- Kim J-Y, and Chung HS (2020). Disordered proteins follow diverse transition paths as they fold and bind to a partner. Science 368, 1253–1257. [DOI] [PMC free article] [PubMed] [Google Scholar]
- Lamichhane R, Liu JJ, Pljevaljcic G, White KL, van der Schans E, Katritch V, Stevens RC, Wuthrich K, and Millar DP (2015). Single-molecule view of basal activity and activation mechanisms of the G protein-coupled receptor β2AR. Proc. Natl. Acad. Sci. U. S. A 112, 14254–14259. [DOI] [PMC free article] [PubMed] [Google Scholar]
- Lamichhane R, Liu JJ, White KL, Katritch V, Stevens RC, Wuthrich K, and Millar DP (2020). Biased signaling of the G-protein-coupled receptor β2AR is governed by conformational exchange kinetics. Structure 28, 371–377 e373. [DOI] [PMC free article] [PubMed] [Google Scholar]
- Lamichhane R, Solem A, Black W, and Rueda D (2010). Single-molecule FRET of protein-nucleic acid and protein-protein complexes: surface passivation and immobilization. Methods 52, 192–200. [DOI] [PMC free article] [PubMed] [Google Scholar]
- Lebon G, Warne T, Edwards PC, Bennett K, Langmead CJ, Leslie AGW, and Tate CG (2011). Agonist-bound adenosine A2A receptor structures reveal common features of GPCR activation. Nature 474, 521–525. [DOI] [PMC free article] [PubMed] [Google Scholar]
- Leitz AJ, Bayburt TH, Barnakov AN, Springer BA, and Sligar SG (2006). Functional reconstitution of Beta2-adrenergic receptors utilizing self-assembling Nanodisc technology. BioTechniques 40, 601–602, 604, 606, passim. [DOI] [PubMed] [Google Scholar]
- Liauw BW-H, Afsari HS, and Vafabakhsh R (2021). Conformational rearrangement during activation of a metabotropic glutamate receptor. Nat. Chem. Biol, 17, 291–297 [DOI] [PMC free article] [PubMed] [Google Scholar]
- Liu W, Chun E, Thompson AA, Chubukov P, Xu F, Katritch V, Han GW, Roth CB, Heitman LH, IJzerman AP, et al. (2012). Structural basis for allosteric regulation of GPCRs by sodium ions. Science 337, 232–236. [DOI] [PMC free article] [PubMed] [Google Scholar]
- Maslov I, Volkov O, Khorn P, Orekhov P, Gusach A, Kuzmichev P, Gerasimov A, Luginina A, Coucke Q, Bogorodskiy A, et al. (2020). Sub-millisecond conformational dynamics of the A2A adenosine receptor revealed by single-molecule FRET. bioRxiv, 2020.2011.2026.400184. [DOI] [PMC free article] [PubMed] [Google Scholar]
- McGibbon RT, Beauchamp KA, Harrigan MP, Klein C, Swails JM, Hernández CX, Schwantes CR, Wang L-P, Lane TJ, and Pande VS (2015). MDTraj: A modern open library for the analysis of molecular dynamics trajectories. Biophys. L 109, 1528–1532. [DOI] [PMC free article] [PubMed] [Google Scholar]
- McKinney SA, Joo C, and Ha T (2006). Analysis of single-molecule FRET trajectories using hidden Markov modeling. Biophys. J 91, 1941–1951. [DOI] [PMC free article] [PubMed] [Google Scholar]
- Mizumura T, Kondo K, Kurita M, Kofuku Y, Natsume M, Imai S, Shiraishi Y, Ueda T, and Shimada I (2020). Activation of adenosine A2A receptor by lipids from docosahexaenoic acid revealed by NMR. Sci. Adv 6, eaay8544. [DOI] [PMC free article] [PubMed] [Google Scholar]
- Nosé S (1984). A unified formulation of the constant temperature molecular dynamics methods. J. Chem. Phys 81, 511–519. [Google Scholar]
- Pauszek III RF, Lamichhane R, Singh AR, and Millar DP (2021). Single-molecule view of coordination in a multi-functional DNA polymerase. Elife 10, e62046. [DOI] [PMC free article] [PubMed] [Google Scholar]
- Robertson MJ, Tirado-Rives J, and Jorgensen WL (2015). Improved peptide and protein torsional energetics with the OPLSAA force field. J. Chemf Theory Comput 11, 3499–3509. [DOI] [PMC free article] [PubMed] [Google Scholar]
- Rouck JE, Krapf JE, Roy J, Huff HC, and Das A (2017). Recent advances in nanodisc technology for membrane protein studies (2012-2017). FEBS Lett. 591, 2057–2088. [DOI] [PMC free article] [PubMed] [Google Scholar]
- Sastry GM, Adzhigirey M, Day T, Annabhimoju R, and Sherman W (2013). Protein and ligand preparation: parameters, protocols, and influence on virtual screening enrichments. J. Comput.-Aided Mol. Des 27, 221–234. [DOI] [PubMed] [Google Scholar]
- Schrodinger LLC (2015). The PyMOL molecular graphics system, version 1.8. [Google Scholar]
- Schrödinger L (2021). Macromodel (New York, NY). [Google Scholar]
- Schuler B, Lipman EA, and Eaton WA (2002). Probing the free-energy surface for protein folding with single-molecule fluorescence spectroscopy. Nature 419, 743–747. [DOI] [PubMed] [Google Scholar]
- Shimada I, Ueda T, Kofuku Y, Eddy MT, and Wüthrich K (2019). GPCR drug discovery: integrating solution NMR data with crystal and cryo-EM structures. Nat. Rev. Drug Discov 18, 59–82. [DOI] [PMC free article] [PubMed] [Google Scholar]
- Stefanski KM, Russell CM, Westerfield JM, Lamichhane R, and Barrera FN (2021). PIP2 promotes conformation-specific dimerization of the EphA2 membrane region. J. Biol. Chem 296, 100149. [DOI] [PMC free article] [PubMed] [Google Scholar]
- Stennett EM, Ciuba MA, Lin S, and Levitus M (2015). Demystifying PIFE: The photophysics behind the protein-induced fluorescence enhancement phenomenon in cy3. J. Phys. Chem. Lett 6, 1819–1823. [DOI] [PubMed] [Google Scholar]
- Sušac L, Eddy MT, Didenko T, Stevens RC, and Wüthrich K (2018). A2A adenosine receptor functional states characterized by 19F-NMR. Proc. Natl. Acad. of Sci. U. S. A 115, 12733–12738. [DOI] [PMC free article] [PubMed] [Google Scholar]
- Wagner G, DeMarco A, and Wüthrich K (1976). Dynamics of the aromatic amino acid residues in the globular conformation of the basic pancreatic trypsin inhibitor (BPTI). Biophys. Struct. Mech 2, 139–158. [DOI] [PubMed] [Google Scholar]
- Wüthrich K, and Wagner G (1975). NMR investigations of the dynamics of the aromatic amino acid residues in the basic pancreatic trypsin inhibitor. FEBS Lett. 50, 265–268. [DOI] [PubMed] [Google Scholar]
- Xu F, Wu H, Katritch V, Han GW, Jacobson KA, Gao Z-G, Cherezov V, and Stevens RC (2011). Structure of an agonist-bound human A2A adenosine receptor. Science 332, 322–327. [DOI] [PMC free article] [PubMed] [Google Scholar]
- Ye L, Neale C, Sljoka A, Lyda B, Pichugin D, Tsuchimura N, Larda ST, Pomès R, García AE, Ernst OP, et al. (2018). Mechanistic insights into allosteric regulation of the A2A adenosine G protein-coupled receptor by physiological cations. Nature Comm. 9, 1372. [DOI] [PMC free article] [PubMed] [Google Scholar]
- Ye L, Van Eps N, Zimmer M, Ernst OP, and Prosser RS (2016). Activation of the A2A adenosine G-protein-coupled receptor by conformational selection. Nature 533, 265–268. [DOI] [PubMed] [Google Scholar]
Associated Data
This section collects any data citations, data availability statements, or supplementary materials included in this article.
Supplementary Materials
Data Availability Statement
All data reported in this paper will be shared by the lead contact upon request.
This paper does not report original code.
Any additional information required to reanalyze the data reported in this paper is available from the lead contact upon request.