

INTRODUCTION
30–80% of survivors of critical illness acquire post-intensive care unit (ICU) cognitive impairment (1–3). The mechanisms underlying this association are still uncertain but growing evidence suggests that ICU delirium is a major risk factor for post-ICU cognitive impairment (4,5). A crucial step in understanding this relationship is to examine how the biomarker profile of ICU delirium compares to well-characterized dementia subtypes (e.g. Alzheimer’s disease). The National Institute on Aging and Alzheimer’s Association (NIA-AA) have recently proposed a research framework for biomarkers related to Alzheimer’s disease and other related dementias (ADRD) (6). The framework groups biomarkers into those of β amyloid deposition (A), pathologic tau (T), neurodegeneration (N), and other (X; e.g. markers of inflammation, vascular changes etc), known collectively as AT(N)-X. To examine whether ICU delirium has a comparable biomarker profile to ADRD, we conducted a meta-analysis of ICU delirium biomarker studies to determine their alignment with disease state biomarkers of the AT(N)-X framework.
METHODS
Search Criteria and Strategy
These systematic review and meta-analyses were conducted in accordance with the Preferred Reporting Items for Reviews and Meta-Analyses (PRISMA) guidelines. The search strategy and full inclusion/exclusion criteria were previously described in detail (7). Briefly, Ovid MEDLINE, PsycInfo, Embase, and the Cochrane Library were searched for citations published between January 1st, 2000 through February 20th, 2020 using a combination of controlled vocabulary, keywords, and MeSH terms pertaining to the concepts of delirium and biomarkers in the AT(N)-X framework (6). Inclusion criteria of the search were: 1) age ≥ 18 years old, 2) used standardized delirium screening tools or diagnostic assessments, and 3) biomarker measurements listed in AT(N)-X categories (regardless of the modality used). Study exclusion criteria, in brief, were: 1) primary focus on delirium in the following contexts: 1a) premorbid or comorbid ADRD; 1b) psychiatric disorders 1c) central nervous system disorders other than ADRD; 1d) terminal illness; 1e) persistent delirium; 1f) long-term care settings; 1g) risk of delirium; and 2) non-English articles. The aim of excluding studies focused on delirium in 1a – 1f was to eliminate potentially confounding factors. Persistent delirium, terminal delirium, and delirium in central nervous system disorders other than ADRD may have a different etiology from delirium in the general hospital setting, and individuals in the long-term care setting and premorbid/comorbid ADRD likely have abnormal AT(N)-X biomarkers at baseline.
Study Selection
Study selection was conducted by two independent, blinded reviewers, and discrepancies were evaluated by consensus panel. Citations were first reviewed for selection criteria based on title and abstract, followed by full-text review. If multiple articles were published from the same cohort, we included data from the study with the most detailed report of biomarker quantities.
Data Extraction and Quality Assessment
Data extraction was conducted by independent, blind reviewers. Discrepancies were resolved via consensus. Only studies that examined delirium in the ICU setting and fluid biomarkers were included in these analyses. For all studies suitable for meta-analysis, we extracted the means and errors (standard deviations [SD], standard errors [SE], or confidence intervals [CIs]) and sample sizes of each biomarker for delirium cases and non-delirium controls. If SD was not reported, it was calculated from SEs or CIs. For studies that reported the median, the minimum and maximum values, and/or the first and third quartiles, we estimated the sample mean and SD from these quantities. When a study presented estimates in the figures/graphs without providing numerical values, data were obtained from graphs using ImageJ software (http://imagej.nih.gov).
Statistical Analysis
Standardized mean differences (SMDs) and 95% CIs were calculated using DerSimonian and Laird random-effects models. SMDs were chosen as the main outcome because different assays and units were used for biomarkers. Between-study heterogeneity was assessed by a Q-statistic and I2 Index. The A-Q-statistic was calculated using a chi-squared test to quantify the heterogeneity among combined results. Inconsistency was calculated using the I2 Index. I2 of 25%, 50%, and 75% indicate low, medium, and high heterogeneity. All statistical significance was defined as two-sided (α < 0.05). All statistical analyses were performed with Stata statistical software version 12 (STATA Corp, College Station, TX). Significance was set at p<0.05.
RESULTS
A detailed flow diagram for inclusion and exclusion of studies per PRISMA guidelines is shown in Supplemental figure 1. Methods and results of study quality assessment has previously been published (7).
From the initial 113 studies, 38 studies examined the relationship between ICU delirium and fluid biomarkers. All studies focused on serum biomarkers. Nine included both medical and surgical patients, 11 included only medical patients, and 18 included only surgical patients. CAM-ICU (25 studies) and CAM (8 studies) were the most common methods of delirium assessment. No study assessed the association between “T” (pathologic tau) biomarkers and ICU delirium. 3 studies included “A” (β amyloid deposition) biomarkers. Seven studies examined “N” (neurodegeneration) biomarkers, including neuron-specific enolase (NSE) (4), t-tau (2), and neurofilament light (NFL) (1). Thirty-seven studies included “X” biomarkers, all of which examined inflammatory biomarkers.
Biomarkers that met criteria for meta-analysis included serum Aβ1–40, Aβ1–42, t-tau, NSE, CRP, IL-1β, IL-RA, IL-6, IL-8, IL-10, IL-17, S100β, TNF-α, and MCP-1. Table 1 and Figure 1 show meta-analysis of biomarkers studied in association with ICU delirium. There was a significant association between ICU delirium and Aβ1–40 (SMD = 0.42, 95% CI = 0.09 – 0.75), IL-RA (SMD = 0.58, 95% CI = 0.21 – 0.94) and IL-6 (SMD = 0.31, 95% CI = 0.06 – 0.56). The mean age of participants in studies included in meta-analyses are in Supplemental table 1.
Table 1.
Random-effects meta-analysis of studies regarding the association between ICU delirium and biomarkers. Studies are ordered by the year of publication.
| Delirium | Control | ||||||||
|---|---|---|---|---|---|---|---|---|---|
| Study | Mean | SD | N | Mean | SD | N | Weight (%) | SMD | 95% CI |
| Aβ1–40 (pg/mL) | |||||||||
| Van den Boogaard 2011 | 170.9 | 73.3 | 50 | 140.3 | 38.2 | 50 | 69.8 | 0.52 | 0.12 – 0.92 |
| Simons 2018 | 189.5 | 75.0 | 35 | 174.5 | 92.4 | 15 | 30.2 | 0.19 | −0.42 – 0.79 |
| Total (95% CI) | 85 | 65 | 100 | 0.42 | 0.09 – 0.75 | ||||
| Heterogeneity: Tau2=0.0; Chi2 = 0.83, df = 1 (p = 0.363); I2=0% Test for overall effect: Z=2.48 (p = 0.013) | |||||||||
| Aβ1–42 (pg/mL) | |||||||||
| Van den Boogaard 2011 | 37.4 | 13.7 | 50 | 35.6 | 8.4 | 50 | 69.8 | 0.16 | −0.24 – 0.55 |
| Simons 2018 | 52.6 | 17.8 | 35 | 57.6 | 32.7 | 15 | 30.2 | −0.215 | −0.82 – 0.39 |
| Erikson 2018 | 89.6 | 68.7 | 10 | 78.7 | 39.3 | 12 | 13.3 | 0.20 | −0.64 – 1.04 |
| Total (95% CI) | 95 | 77 | 100 | 0.07 | −0.24 – 0.37 | ||||
| Heterogeneity: Tau2=0.0; Chi2 = 1.12, df = 2 (p = 0.570); I2=0% Test for overall effect: Z=0.42 (p = 0.671) | |||||||||
| T-Tau (pg/mL) | |||||||||
| Van den Boogaard 2011 | 52.7 | 51.1 | 50 | 35.2 | 29.8 | 50 | 65.2 | 0.42 | 0.02 – 0.81 |
| Simons 2018 | 51.1 | 43.1 | 35 | 51.3 | 34.1 | 15 | 34.8 | −0.01 | −0.61 – 0.60 |
| Total (95% CI) | 85 | 65 | 100 | 0.27 | −0.124 – 0.67 | ||||
| Heterogeneity: Tau2=0.02; Chi2 = 1.31, df = 1 (p = 0.252); I2=23.9% Test for overall effect: Z=1.34 (p = 0.179) | |||||||||
| NSE (ug/L) | |||||||||
| Schramm 2012 | 22 | 13 | 23 | 15 | 5 | 6 | 46.1 | 0.59 | −0.33 – 1.50 |
| Erikson 2018 | 21.2 | 12.7 | 10 | 22.2 | 17.2 | 12 | 53.9 | −0.07 | −0.91 – 0.78 |
| Total (95% CI) | 33 | 18 | 100 | 0.235 | −0.40 – 0.87 | ||||
| Heterogeneity: Tau2=0.01; Chi2 = 1.07, df = 1 (p = 0.302); I2=6.3% Test for overall effect: Z=0.72 (p = 0.471) | |||||||||
| CRP (mg/mL) | |||||||||
| Pfister 2008 | 33.3 | 11.1 | 12 | 13.8 | 21.5 | 4 | 25.5 | 1.40 | 0.15–2.64 |
| Tsuruta 2010 | 1.6 | 1.0 | 21 | 1.3 | 1.7 | 82 | 36.8 | 0.21 | −0.27–0.69 |
| Van den Boogaard 2011 | 21.2 | 12.7 | 50 | 54.8 | 54.8 | 50 | 37.6 | −0.84 | −1.25 – −0.434 |
| Total (95% CI) | 83 | 136 | 100 | 0.116 | −0.929 – 1.161 | ||||
| Heterogeneity: Tau2=0.71; Chi2 = 18.25, df = 2 (p = 0.0); I2=89.0% Test for overall effect: Z=0.22 (p = 0.828) | |||||||||
| IL-1β (pg/mL) | |||||||||
| Van den Boogaard 2011 | 4.1 | 2.3 | 50 | 4.4 | 3.1 | 50 | 31.9 | −0.13 | −0.52 – 0.26 |
| Skrobik 2013 | 2.3 | 2.4 | 7 | 1.6 | 0.7 | 14 | 15.3 | 0.44 | −0.47 – 1.36 |
| Ritter 2014 | 76.5 | 86.3 | 31 | 34.6 | 26.8 | 47 | 29.0 | 0.72 | 0.25 – 1.19 |
| Simons 2018 | 5.4 | 3.1 | 35 | 4.4 | 0.8 | 15 | 23.8 | 0.40 | −0.21 – 1.0 |
| Total (95% CI) | 123 | 126 | 100 | 0.33 | −0.12 – 0.78 | ||||
| Heterogeneity: Tau2=0.13; Chi2 = 7.91, df = 3 (p = 0.048); I2=62.1% Test for overall effect: Z=1.44 (p = 0.151) | |||||||||
| IL-RA (pg/mL) | |||||||||
| Van den Boogard 2011 | 40.6 | 38.9 | 50 | 22.4 | 15.3 | 50 | 83.9 | 0.61 | 0.21 – 1.0 |
| Skrobik 2013 | 10267.2 | 7944.5 | 7 | 6895.3 | 9496.1 | 14 | 16.1 | 0.37 | −0.54 – 1.29 |
| Total (95% CI) | 57 | 64 | 100 | 0.58 | 0.21 – 0.94 | ||||
| Heterogeneity: Tau2=0.0; Chi2 = 0.23, df = 1 (p = 0.635); I2=0.0% Test for overall effect: Z=3.07 (p = 0.002) | |||||||||
| IL-6 (mg/mL) | |||||||||
| Pfister 2008 | 3148.3 | 6941.9 | 12 | 479.6 | 1174.0 | 4 | 4.8 | −0.71 | 1.56 – 4.84 |
| Van den Boogaard 2011 | 70.9 | 58.1 | 50 | 47.6 | 44.3 | 50 | 40.1 | 0.45 | 0.05 – 0.85 |
| Skrobik 2013 | 160.2 | 223.1 | 7 | 352.4 | 740.5 | 14 | 7.6 | −0.31 | −1.22 – 0.61 |
| Ritter 2014 | 331.5 | 102.6 | 31 | 232.0 | 298.2 | 47 | 30.1 | 0.41 | −0.05 – 0.87 |
| Simons 2018 | 195.0 | 242.7 | 35 | 184.0 | 348.4 | 15 | 17.3 | 0.04 | −0.57 – 0.64 |
| Total (95% CI) | 135 | 130 | 100 | 0.31 | 0.06 – 0.56 | ||||
| Heterogeneity: Tau2=0.0; Chi2 = 3.25, df = 4 (p = 0.517); I2=0.0% Test for overall effect: Z=2.42 (p = 0.016) | |||||||||
| IL-8 (pg/mL) | |||||||||
| Van den Boogard 2011 | 29.4 | 14.5 | 50 | 17.4 | 13.0 | 50 | 57.9 | 0.87 | 0.46 – 1.28 |
| Skrobik 2013 | 32.4 | 51.0 | 7 | 42.6 | 63.4 | 14 | 42.2 | −0.17 | −1.08 – 0.73 |
| Total (95% CI) | 57 | 64 | 100 | 0.43 | −0.58 – 1.44 | ||||
| Heterogeneity: Tau2=0.42; Chi2 = 4.21, df = 1 (p = 0.040); I2=76.2% Test for overall effect: Z=0.84 (p = 0.402) | |||||||||
| IL-10 (mg/mL) | |||||||||
| Van den Boogard 2011 | 32.2 | 26.7 | 50 | 22.2 | 22.9 | 50 | 30.3 | 0.40 | 0.00 – 0.80 |
| Skrobik 2013 | 10.3 | 15.3 | 7 | 7.5 | 9.3 | 14 | 17.0 | 0.25 | −0.67 – 1.16 |
| Ritter 2014 | 5.8 | 1.2 | 31 | 25.98 | 52.8 | 47 | 28.5 | −0.49 | −0.95 – −0.03 |
| Simons 2018 | 14.9 | 13.9 | 35 | 21.7 | 22.9 | 15 | 24.2 | −0.40 | −1.01 – 0.21 |
| Total (95% CI) | 135 | 130 | 100 | −0.075 | −0.59 – 0.44 | ||||
| Heterogeneity: Tau2=0.18; Chi2 = 10.19, df = 3 (p = 0.017); I2=70.6% Test for overall effect: Z=0.29 (p = 0.773) | |||||||||
| IL-17 (pg/mL) | |||||||||
| Van den Boogard 2011 | 3.4 | 0.8 | 50 | 3.4 | 0.8 | 50 | 60.3 | 0.0 | −0.39 – 0.39 |
| Skrobik 2013 | 5.0 | 2.7 | 7 | 3 | 1.7 | 14 | 39.7 | 0.98 | 0.03 – 1.94 |
| Total (95% CI) | 57 | 64 | 100 | 0.39 | −0.55 – 1.34 | ||||
| Heterogeneity: Tau2=0.34; Chi2 = 3.46, df = 1 (p = 0.063); I2=71.1% Test for overall effect: Z=0.81 (p = 0.417) | |||||||||
| S100β (pg/mL) | |||||||||
| Pfister 2008 | 0.19 | 0.12 | 12 | 0.01 | 0.01 | 4 | 8.5 | 0.23 | −0.16 – 0.63 |
| Van den Boogard 2011 | 178.1 | 148.1 | 50 | 148.8 | 98.5 | 50 | 76.8 | 0.93 | −0.25 – 2.11 |
| Schramm 2012 | 500 | 800 | 23 | 500 | 200 | 6 | 14.7 | 0 | −0.90 – 0.90 |
| Total (95% CI) | 85 | 60 | 100 | 0.26 | −0.09 – 0.60 | ||||
| Heterogeneity: Tau2=0.0; Chi2 = 1.57, df = 2 (p = 0.455); I2=0% Test for overall effect: Z=1.46 (p = 0.143) | |||||||||
| TNF-α (mg/mL) | |||||||||
| Van den Boogard 2011 | 10.6 | 5.3 | 50 | 8.7 | 6.1 | 50 | 42.2 | 0.34 | −0.06 – 0.73 |
| Skrobik 2013 | 11.2 | 18.0 | 7 | 8.3 | 9.1 | 14 | 7.9 | 0.23 | −0.68 – 1.14 |
| Ritter 2014 | 233.5 | 401.8 | 31 | 218.9 | 308.2 | 47 | 32.0 | 0.04 | −0.41 – 0.50 |
| Simons 2018 | 4.7 | 1.5 | 35 | 4.7 | 1.6 | 15 | 18.0 | −0.01 | −0.614 – 0.60 |
| Total (95% CI) | 135 | 130 | 100 | 0.17 | −0.08 – 0.43 | ||||
| Heterogeneity: Tau2=0.0; Chi2 = 1.36, df = 3 (p = 0.716); I2=0% Test for overall effect: Z=1.32 (p = 0.187) | |||||||||
| MCP-1 (mg/mL) | |||||||||
| Van den Boogard 2011 | 404.9 | 260.3 | 50 | 248.2 | 111.4 | 50 | 56.3 | 0.78 | 0.38 – 1.2 |
| Simons 2018 | 327.5 | 412.0 | 35 | 271.7 | 415.5 | 15 | 43.8 | 0.14 | −0.47 – 0.74 |
| Total (95% CI) | 85 | 65 | 100 | 0.50 | −0.13 – 1.13 | ||||
| Heterogeneity: Tau2=0.14; Chi2 = 3.03, df = 1 (p = 0.082); I2=67.0% Test for overall effect: Z=1.55 (p = 0.120) | |||||||||
Abbreviations: SD = standard deviation; SMD = standardized mean difference; CI = confidence interval.
Figure 1. A summary of the results from meta-analyses of the association between biomarkers and ICU delirium. Random-effects meta-analyses were performed to calculate the pooled standardized mean difference (SMD) of each biomarker comparing ICU delirium cases to non-delirium controls. Each black circle indicates the pooled SMD per biomarker. The horizontal line represents the 95% confidence interval. The vertical line represents the null hypothesis. The number (n) in the parentheses indicate the number of included studies in the meta-analysis.
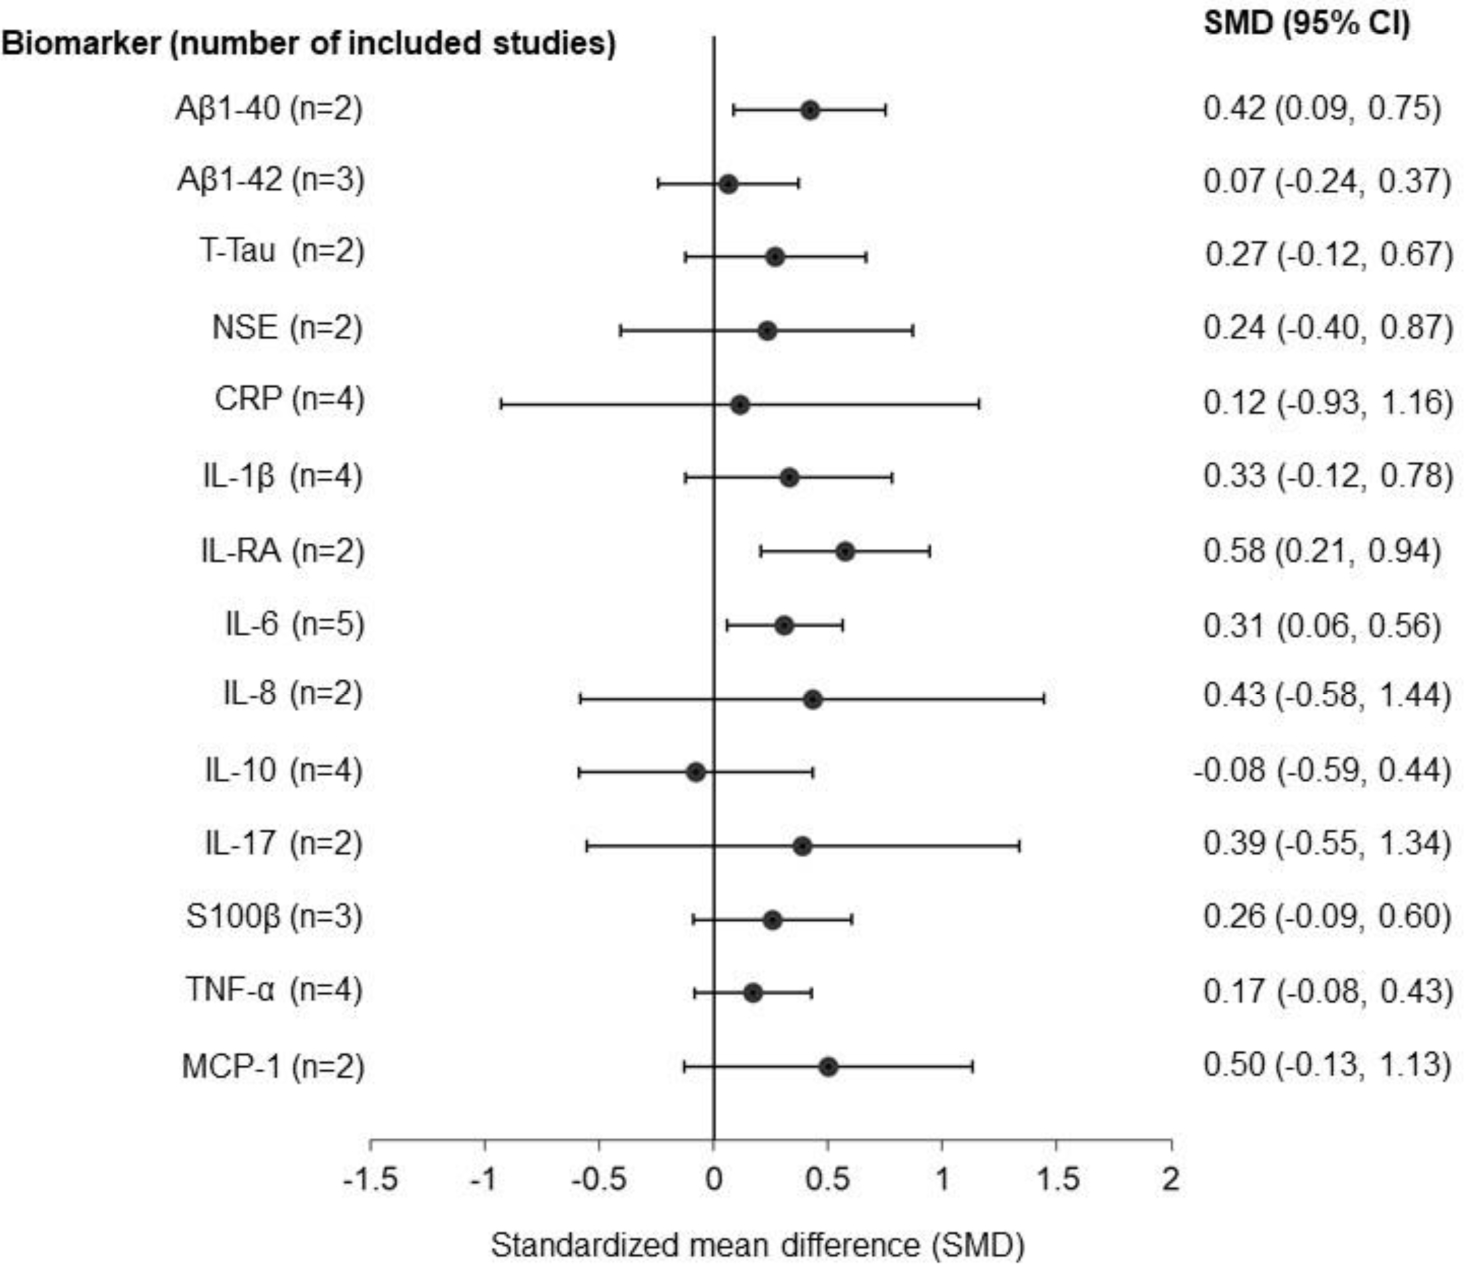
Abbreviation: CI, confidence interval; Aβ1-40, amyloid beta-peptide 1–40; Aβ1-42, amyloid beta-peptide 1–42; T-tau, total tau protein; NSE, neuron specific enolase; CRP, C-reactive protein; IL, interleukin; IL-RA, interleukin-1 receptor antagonist; S100β, S100 calcium-binding protein B; TNF-α, tumor necrosis factor α; MCP-1, monocyte chemoattractant protein-1.
DISCUSSION
To our knowledge, this is the first study to conduct a meta-analysis of AT(N) and inflammatory biomarkers in ICU delirium. We found a modest relationship between ICU delirium and elevated Aβ1–40, IL-RA and IL-6, consistent with previously reported patterns of serum amyloid and inflammatory biomarkers in ADRD (8,9). Few studies examined neurodegenerative biomarkers in the context of ICU delirium, and no studies focused on pathological tau were found. Though we were not able to evaluate biomarkers in the “T” and “N” categories in pooled analyses, a significant positive relationship was observed between Aβ1-40 and ICU delirium.
Our findings suggest that there may be overlap in the biomarker profile of ICU delirium and ADRD, and support prior observations that delirium is associated with persistent cognitive dysfunction in survivors of critical illness (5), including a large observational case-control study (n=21,000) (4). It remains unclear whether delirium (1) accelerates cognitive decline in at-risk individuals with premorbid ADRD pathology or (2) causes de-novo ADRD pathology. Further studies directly examining post-ICU cognitive dysfunction and ADRD biomarkers are needed. In contrast to a recent systematic review (8) which noted that in critically ill patients, S100β and CRP were associated with delirium in most studies, we did not find a significant association between ICU delirium and S100β or CRP in our pooled analyses. This discrepancy may be explained by differences in included studies. As an example – for S100B, only 1 of the 6 studies from Michels et al was included in our meta-analysis, while the other 2 studies in our meta-analysis were not reported in their systematic review. Similarly, for CRP only 1 study was included in both Michels et al and our meta-analysis. These differences may be explained by differences in search strategy, including our exclusion of non-English articles and inclusion of studies that did not use the CAM or CAM-ICU to assess delirium, as well as limiting our meta-analysis to studies that were methodologically comparable..
Although the number of studies were limited for the “T” and “N” category, we found a significant relationship between Aβ1-40 and ICU delirium. It should be noted, however, that while we excluded studies with premorbid or comorbid ADRD (a known risk factor for delirium), one of the studies included in the meta-analysis of Aβ1-40 and Aβ1-42 comprised of a delirium group that was older than the non-delirious controls (mean (SD) age = 73 (9.9) vs. 67 (10), p=0.03). This could potentially have introduced bias as amyloid is known to increase with age, even in individuals with normal cognition (10). Though Aβ1-42 is more specific to the pathophysiology of Alzheimer’s disease (AD) (11), Aβ1-40 is the most abundant form of Aβ in the brain, and the concentration ratio of Aβ1-42/Aβ1-40 has also been proposed to be a superior biomarker of AD than Aβ1-42 alone (12). Aβ has been associated with increased proinflammatory cytokines in AD (13), though to our knowledge this relationship in the context of delirium has not been investigated. Further study is needed to investigate whether this relationship has implications for the elevated risk of cognitive decline following critical illness.
These findings should be interpreted in the context of their limitations. As a meta-analysis of observational studies, the influence of confounding variables cannot be ruled out or fully assessed. There were few studies that met criteria for meta-analysis, resulting in only 2 studies being included in the meta-analysis of 7 biomarkers. Heterogeneity was high in the meta-analysis of several biomarkers, including CRP and IL-8.
In summary, Aβ1–40, IL-RA and IL-6 are associated with ICU delirium, and point to potential overlapping mechanisms between delirium and ADRD. Critical care researchers and clinicians should consider integrating diagnostic approaches used in ADRD in their assessment of post-ICU cognitive dysfunction. Additional studies systematically examining the relationship between ICU delirium and biomarkers in the AT(N) framework, are needed to provide further understanding of the underlying mechanisms of ICU delirium, its relationship with post-intensive care cognitive decline and ADRD.
Supplementary Material
Financial support:
S.W. is supported by National Institute on Aging (NIA) 2P30AG010133 and K23AG062555-01. H.L. is supported by National Heart, Lung, and Blood Institute (NHLBI) 5T32HL091816-07. B.K. is supported by NHLBI R01HL131730 and NIA R01AG055391.
REFERENCES
- 1.Rothenhäusler HB, Ehrentraut S, Stoll C, Schelling G, Kapfhammer HP. The relationship between cognitive performance and employment and health status in long-term survivors of the acute respiratory distress syndrome: results of an exploratory study. Gen Hosp Psychiatry. 2001. Apr;23(2):90–6. [DOI] [PubMed] [Google Scholar]
- 2.Girard TD, Jackson JC, Pandharipande PP, Pun BT, Thompson JL, Shintani AK, et al. Delirium as a predictor of long-term cognitive impairment in survivors of critical illness. Crit Care Med. 2010. Jul;38(7):1513–20. [DOI] [PMC free article] [PubMed] [Google Scholar]
- 3.Hopkins RO, Weaver LK, Collingridge D, Parkinson RB, Chan KJ, Orme JF. Two-year cognitive, emotional, and quality-of-life outcomes in acute respiratory distress syndrome. Am J Respir Crit Care Med. 2005. Feb 15;171(4):340–7. [DOI] [PubMed] [Google Scholar]
- 4.Sakusic A, Gajic O, Singh TD, O’Horo JC, Jenkins G, Wilson GA, et al. Risk Factors for Persistent Cognitive Impairment After Critical Illness, Nested Case-Control Study. Critical Care Medicine. 2018. Dec;46(12):1977–1984. [DOI] [PubMed] [Google Scholar]
- 5.Pandharipande PP, Girard TD, Jackson JC, Morandi A, Thompson JL, Pun BT, et al. Long-term cognitive impairment after critical illness. New England Journal of Medicine. 2013;369(14):1306–1316. [DOI] [PMC free article] [PubMed] [Google Scholar]
- 6.Jack CR, Bennett DA, Blennow K, Carrillo MC, Dunn B, Haeberlein SB, et al. NIA-AA Research Framework: Toward a biological definition of Alzheimer’s disease. Alzheimer’s & Dementia. 2018;14(4):535–62. [DOI] [PMC free article] [PubMed] [Google Scholar]
- 7.Wang S, Lindroth H, Chan C, Greene R, Serrano-Andrews P, Khan S, et al. A Systematic Review of Delirium Biomarkers and Their Alignment with the NIA-AA Research Framework. J Am Geriatr Soc. 2020. Sep 25; [DOI] [PMC free article] [PubMed] [Google Scholar]
- 8.Hampel H, O’Bryant SE, Molinuevo JL, Zetterberg H, Masters CL, Lista S, et al. Blood-based biomarkers for Alzheimer disease: mapping the road to the clinic. Nature Reviews Neurology. 2018;14(11):639–52. [DOI] [PMC free article] [PubMed] [Google Scholar]
- 9.Heneka MT, Carson MJ, El Khoury J, Landreth GE, Brosseron F, Feinstein DL, et al. Neuroinflammation in Alzheimer’s Disease. Lancet Neurol. 2015. Apr;14(4):388–405. [DOI] [PMC free article] [PubMed] [Google Scholar]
- 10.Fjell AM, McEvoy L, Holland D, Dale AM, Walhovd KB. What is normal in normal aging? Effects of aging, amyloid and Alzheimer’s disease on the cerebral cortex and the hippocampus. Progress in Neurobiology. 2014. Jun 1;117:20–40. [DOI] [PMC free article] [PubMed] [Google Scholar]
- 11.Chen G, Xu T, Yan Y, Zhou Y, Jiang Y, Melcher K, et al. Amyloid beta: structure, biology and structure-based therapeutic development. Acta Pharmacologica Sinica. 2017. Sep;38(9):1205–35. [DOI] [PMC free article] [PubMed] [Google Scholar]
- 12.Hansson O, Lehmann S, Otto M, Zetterberg H, Lewczuk P. Advantages and disadvantages of the use of the CSF Amyloid β (Aβ) 42/40 ratio in the diagnosis of Alzheimer’s Disease. Alz Res Therapy. 2019. Apr 22;11(1):34. [DOI] [PMC free article] [PubMed] [Google Scholar]
- 13.Parbo P, Ismail R, Hansen KV, Amidi A, Mårup FH, Gottrup H, et al. Brain inflammation accompanies amyloid in the majority of mild cognitive impairment cases due to Alzheimer’s disease. Brain. 2017. Jul 1;140(7):2002–11. [DOI] [PubMed] [Google Scholar]
Associated Data
This section collects any data citations, data availability statements, or supplementary materials included in this article.