

Abstract
Objective:
To assess our hypothesis that brain macrostructure is different in individuals with mucopolysaccharidosis type I (MPS I) and healthy controls (HC), we conducted a comprehensive multicenter study using a uniform quantitative magnetic resonance imaging (qMRI) protocol, with analyses that account for the effects of disease phenotype, age, and cognition.
Methods:
Brain MRIs in 23 individuals with attenuated (MPS IA) and 38 with severe MPS I (MPS IH), aged 4-25 years, enrolled under the study protocol NCT01870375, were compared to 98 healthy controls.
Results:
Cortical and subcortical gray matter, white matter, corpus callosum, ventricular and choroid plexus volumes in MPS I significantly differed from HC. Thicker cortex, lower white matter and corpus callosum volumes were already present at the youngest MPS I participants aged 4-5 years. Age-related differences were observed in both MPS I groups, but most markedly in MPS IH, particularly in cortical gray matter metrics. IQ scores were inversely associated with ventricular volume in both MPS I groups and were positively associated with cortical thickness only in MPS IA.
Conclusions:
Quantitatively-derived MRI measures distinguished MPS I participants from HC as well as severe from attenuated forms. Age-related neurodevelopmental trajectories in both MPS I forms differed from HC. The extent to which brain structure is altered by disease, potentially spared by treatment, and how it relates to neurocognitive dysfunction needs further exploration.
Keywords: mucopolysaccharidosis, Hurler Scheie syndrome, brain MRI, quantitative brain volumetry, ventricle, cortex
1. Introduction
Novel treatments for mucopolysaccharidosis type I (MPS I) aim to minimize the central nervous system (CNS) morbidity making the precise quantification of brain abnormalities critical for the characterization of the anticipated disease course and detection of potential treatment effects. To accomplish this, a uniform quantitative magnetic resonance imaging (qMRI) volumetric protocol was established to assess developmental (age-related) changes in severe and attenuated forms of MPS I.
Cerebral white matter (WM) abnormalities, ventricular enlargement, brain atrophy, and enlarged perivascular spaces are prevalent findings in the MPS I brain and can be rated by severity scales1-3. Most studies have relied on qualitative radiological evaluations, as opposed to fully quantitative techniques that provide reproducible and precise measurements of neuroanatomy4. The application of automated techniques is exceptionally challenging and often requires meticulous correction during post-processing analysis due to prominent morphologic abnormalities seen in the brains of patients with MPS I4.
Previous work employing qMRI automated brain volumetry has implicated WM and gray matter (GM) alterations and their association with IQ and attention in treated MPS I patients5-8.
This study applied automated volumetric analysis to the brains of individuals with MPS I and compared absolute and age-related differences between severe and attenuated phenotypes and healthy controls (HC). We hypothesized that lower WM and corpus callosum (CC) volumes are present in MPS I and that cortical and subcortical GM volumes in MPS I are lower than in HC. Finally, we postulated that intelligence is positively associated with cortical GM-derived metrics, WM, and thalamic volumes but negatively with ventricular volume, consistent with healthy pediatric population studies9-12.
2. Material and methods
2.1. Subjects
One hundred fifteen study participants with MPS I were enrolled in the longitudinal protocol NCT01870375 of the Lysosomal Disease Network (Longitudinal Studies of Brain Structure and Function) with the following inclusion criteria: confirmed diagnosis of MPS I, physically able to undergo a 1-hour non-sedated scan, and hearing and vision adequate for neuropsychological testing. Of the 115 MPS I participants, 98 had scans following the MRI study protocol. Eligible participants were between 4 and 24 years of age and had no ventricular shunt. Participants with ventricular shunts were not included because of the effect of shunts on brain and ventricular volumes. No participants below four years of age were included in this study due to the challenges of scanning without sedation and limited GM/WM contrast in this age group, which can preclude precise automated brain segmentation. Sixty-one of the 98 MPS I participants met inclusion criteria for this report. Thirteen participants were included even though they had a scan under sedation. Thirty-eight participants with the severe form of MPS I, Hurler syndrome (MPS IH), and 23 participants with one of the attenuated forms of MPS I, Hurler-Scheie and Scheie syndromes (MPS IA) were included. The measurements of the HC group were collected from three separate studies using the same inclusion criteria and consisted of 98 participants.
Although participants were seen yearly, the data presented here are cross-sectional, as longitudinal data from HC were not available for comparison. Therefore, age-matched MPS IH, MPS IA, and HC groups were created by selecting the earliest analyzable scan from the longitudinal datasets. Participants with MPS IH were 9.5-22.8 (median 8.5) years post-hematopoietic stem cell transplantation (HSCT), and all participants with MPS IA had been on enzyme replacement therapy (ERT) for 0.5-12.5 (median 6.9) years prior to scan acquisition (Table 1). Four MPS IH participants received intrathecal ERT prior to the HSCT.
Table 1.
Demographic characteristics.
| Covariate | HC | MPS IA | MPS IH |
|---|---|---|---|
| (N=98) | (N=23) | (N=38) | |
| Female | 54 (55.1%) | 12 (52.2%) | 21 (55.3%) |
| Site | |||
| UMN | 98 (100.0%) | 18 (78.3%) | 31 (81.6%) |
| EU | 0 (0.0%) | 1 (4.3%) | 0 (0.0%) |
| OC | 0 (0.0%) | 1 (4.3%) | 0 (0.0%) |
| SF | 0 (0.0%) | 0 (0.0%) | 4 (10.5%) |
| SK | 0 (0.0%) | 3 (13.0%) | 3 (7.9%) |
| Age (years) | 12.5 (5.7) | 13.4 (5.9) | 10.6 (4.5) |
| Age at diagnosis (years) | n/a | 5.2 (3.3) | 1.0 (0.7) |
| Missing age at dx | n/a | 3 (13.0%) | 1 (2.63%) |
| IQ | 112 (12.0) | 93.1 (18.4) | 80.0 (17.6) |
| Missing IQ | 9 (9.18%) | 1 (4.35%) | 1 (2.63%) |
Values presented are mean (standard deviation) or N (%) where indicated.
MPS IA attenuated form of mucopolysaccharidosis type I, MPS IH severe form of mucopolysaccharidosis type I, HC healthy controls, UMN University of Minnesota; EU Emory University; OC Oakland; SF San Francisco, SK SickKids Toronto;
n/a not available.
2.2. Standard Protocol Approvals, Registrations, and Patient Consents
Study participants were scanned at five centers (Table 1). All centers had IRB approval for this study, and all participants, parents, and/or legal guardians gave signed informed consent; assent was obtained from children and those over 18 years with legal guardians at their home institution, which included permission to share de-identified data with the RDCRN (Rare Disease Clinical Research Network) Data Monitoring and Coordination Center and with the University of Minnesota for data analysis.
2.3. Neuropsychological evaluation
As previous studies have used IQ tests as a functional outcome measure in relationship to MRI data, we included the Full Scale IQ. One of two IQ tests was administered to MPS participants as previously described5: The Wechsler Preschool and Primary Scale of Intelligence, Third Edition, for participants from 4 to 6 years of age and the Wechsler Abbreviated Scale of Intelligence for participants over six years. All assessments, which were concurrent with the MRI exam dates, were administered by trained personnel who had extensive experience with MPS participants and these tests. Healthy controls were administered these same tests, except in the case of the 4-8-year-old HC who were administered the Kaufman Brief Intelligence Test, Second Edition, allowing for comparison of IQ scores between groups.
2.4. MRI
2.4.1. Data acquisition
Fifty-seven MPS participants were examined with 3-T Siemens scanners (Siemens, AG, Erlangen, Germany) with 12-channel (Siemens Trio)/20-channel (Siemens Skyra) RF head coils. The MRI protocol included an 11-minute 3-dimensional, T1-weighted, magnetization-prepared rapid acquisition with gradient-echo (MPRAGE) sequence (TR/TE/TI: 2530/3.65/1100 ms; voxel size: 1 × 1 × 1 mm3; 240 slices; no gap; bandwidth: 180 Hz/pix; field-of-view (FoV): 256 mm). Four participants (at the San Francisco site) were scanned on a 3-T Phillips Achieva scanner (Philips Medical Systems, Best, the Netherlands) with a SENSE-NV-16-channel head coil that included a 10-min 3-dimensional, T1-weighted turbo field echo TFE) sequence (TR/TE: 8270/3.79 ms; voxel size 1 x 1 x 1 mm3; no gap; FOV: 256 × 256 × 176 mm; bandwidth: 191 Hz/pix). The Philips TFE protocol was equivalent to Siemens MPRAGE protocol. The study site underwent the quality control including the phantom and healthy subject scans prior to the site activation.
During imaging, most participants watched a movie in a research-dedicated scanner to improve cooperation and reduce movement. For young participants who required sedation (n=13), clinical scans using the same parameters were used with the local IRB permission.
All controls were examined with the research-dedicated 3-T Trio scanner using a 5-minute MPRAGE sequence with the same parameters, but a GRAPPA factor of 2 was utilized.
2.4.2. Image analysis
Volumetric analysis was conducted using FreeSurfer (FS) Image Analysis Suite13, version 5.3, which yields surface-based cortical parcellation and volume-based morphometric segmentation. In this analysis, the volumes of cortical cerebral and cerebellar GM and WM, CC, choroid plexus (ChP), thalamus, hippocampus, amygdala, putamen, pallidum, and caudate were assessed. Additionally, total ventricular volume, intracranial volume (ICV), mean cortical surface area (CSA), and cortical thickness (CTh) were determined. Left and right volumes of bilateral structures were summed and reported as one total volume. All segmentations were visually inspected and manually corrected if necessary (Section 2.3.3).
2.4.3. Manual adjustments
Manual editing was required in 43% of MPS I scans. Abnormal brain morphology, particularly enlarged ventricles, enlarged perivascular spaces, and thickened dura, were the most common causes of aberrant automated volumetric analysis. Manually selected “control points” were placed on high-intensity voxels that were identified as white matter but omitted in the initial automated segmentation. Control points re-threshold the intensity of selected and neighboring voxels to the threshold intensity of white matter (Fig. 1A). The new iteration was run with the -autorecon2-cp flag. In four cases with severely enlarged lateral ventricles, the CSF regions corresponding to the lateral ventricles were left un-segmented by initial processing and had to be either re-run with -bigventricles flag or manually “filled” using the Freesurfer tkmedit tool and re-run with -autorecon2-wm flag (Fig. 1B)14. After re-analyzing the edited scans, all were re-inspected for accuracy. In cases of inaccuracy, subsequent rounds of edits and FS analysis were performed. Analysis typically required one to four iterations of edits to obtain satisfactory results.
Figure 1.
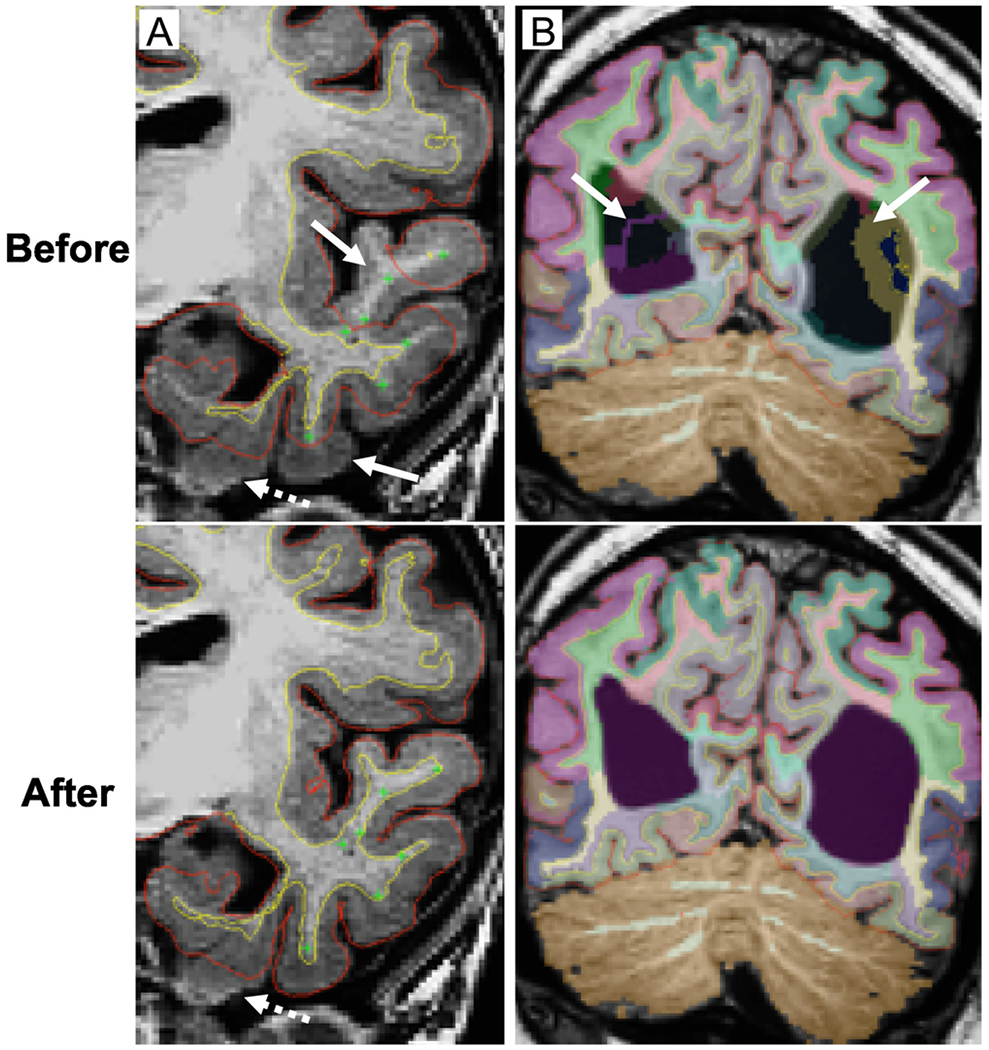
Corrections of automated brain MRI segmentation in MPS I participants.
Coronal T1-weighted images. Pial surface – red line, cerebral white matter surface – yellow line. A. White and gray matter segmentation of the left temporal lobe with the placement of control points (green cross) in the under-segmented white matter (arrows). Edited scans before and after an iteration of automated segmentation. Relatively small parts of mesiotemporal structures may remain unsegmented (dashed arrow) due to the low gray/white matter contrast. B. Brain mislabeling at the level of lateral ventricles (purple label) due to the prominent ventricular enlargement (arrows). Scans are shown before and after an iteration of automated segmentation with -bigventricles flag. Color-coded labels overlaid on T1-weighted image correspond to specific brain regions.
2.5. Statistical analysis
Descriptive statistics were tabulated separately for MPS IH, MPS IA, and HC groups. These included the mean and standard deviation for continuous variables and frequency with percentage for categorical variables. All MRI variables were reported unadjusted and adjusted for the ICV (i.e., as a fraction of ICV). Differences in means were evaluated using the t-test with unequal variance and Welch degrees of freedom. First order linear trends of volumes across chronological age are based on least squares regression estimates with robust variance estimation for confidence intervals and P-values. Differences in slopes were evaluated by testing interaction terms in regression models. All analyses were conducted using R v2.15.215.
2.6. Data Availability Statement
All data has been uploaded into the Data Management and Coordinating Center (DMCC) for the Rare Diseases Clinical Research Network (RDCRN). The DMCC is a secure clinical data management system to collect and store data on a variety of rare diseases from organizations across the United States. The data are held in the DMCC for five years after which they are released to the database of Genotypes and Phenotypes (dbGaP).
3. Results
3.1. Demographic information and IQ
The Full Scale IQ scores were below the population mean (1.3 standard deviations) in MPS IH; in the MPS IA group, the IQ was almost 0.5 standard deviation below the population mean (Table 1).
3.2. Brain MRI measure differences and comparison of MPS I groups to healthy controls
Mean CSA and volumes of cerebral WM, CC, thalamus, and pallidum were lower in MPS IH < MPS IA < HC (Table 2, Figure 2). Cortical thickness was higher in MPS IH > MPS IA > HC. Total ventricular and ChP volumes were higher in both MPS groups (slightly MPS IA > MPS IH) than HC. Intracranial volumes were not significantly different between all groups. Hippocampus volume was lower in the MPS IA group. Post-hoc Pearson correlation analysis showed significant correlations between ventricular and ChP volumes in all groups with R = 0.74/0.68/0.54 for MPS IH/MPS IA /HC, respectively (all p < 0.001).
Table 2.
Brain MRI measures characteristics.
| Covariate | HC | MPS IA | MPS IH | P-value | P-value |
|---|---|---|---|---|---|
| (N=98) | (N=23) | (N=38) | IA vs. HC | IH vs. HC | |
| Cortical GM (mL) | 563 (58.2) | 534 (74.9) | 558 (67.3) | 0.059 | 0.491 |
| Cortical SA (mm2) | 184830 (21313.9) | 171177 (23731.3) | 168401 (15814.5) | 0.002 | <0.001 |
| CTh (mm) | 3.1 (0.2) | 3.1 (0.2) | 3.3 (0.3) | 0.025 | <0.001 |
| Cerebral WM (mL) | 429 (62.7) | 399 (71.8) | 364 (46.7) | 0.005 | <0.001 |
| CC (mL) | 3.0 (0.5) | 2.3 (0.4) | 2.0 (0.4) | <0.001 | <0.001 |
| Cerebellar WM (mL) | 29.0 (4.4) | 30.3 (6.5) | 29.5 (5.9) | 0.397 | 0.144 |
| Cerebellar GM (mL) | 114 (11.9) | 112 (11.4) | 107 (14.9) | 0.399 | 0.015 |
| Ventricles (mL) | 12.0 (5.2) | 38.9 (46.3) | 37.2 (44.2) | <0.001 | <0.001 |
| Choroid plexus (mL) | 2.3 (0.5) | 3.1 (1.0) | 2.9 (1.0) | <0.001 | <0.001 |
| Thalamus (mL) | 16.3 (2.3) | 14.7 (2.0) | 13.9 (2.0) | <0.001 | <0.001 |
| Hippocampus (mL) | 8.5 (0.9) | 8.1 (0.9) | 8.3 (0.9) | 0.037 | 0.351 |
| Amygdala (mL) | 3.2 (0.5) | 3.1 (0.4) | 3.1 (0.4) | 0.073 | 0.474 |
| Pallidum (mL) | 3.7 (0.5) | 3.4 (0.4) | 3.3 (0.7) | 0.01 | <0.001 |
| Putamen (mL) | 12.3 (1.6) | 12.2 (1.0) | 11.7 (1.6) | 0.636 | 0.054 |
| Caudate (mL) | 8.4 (1.2) | 8.4 (1.5) | 8.3 (1.4) | 0.877 | 0.878 |
| ICV (mL) | 1592 (196.7) | 1628 (277.0) | 1547 (249.8) | 0.667 | 0.648 |
Values presented are mean (standard deviation).
P-values for differences in means for each of MPS IA and MPS IH vs. healthy HC.
MPS IA attenuated form of mucopolysaccharidosis type I, MPS IH severe form of mucopolysaccharidosis type I, HC healthy controls, GM gray matter, SA surface area, CTh mean cortical thickness, WM white matter, CC corpus callosum, ICV intracranial volume. P-values ≤ 0.05 in italic, ≤ 0.01 in bold.
Figure 2.
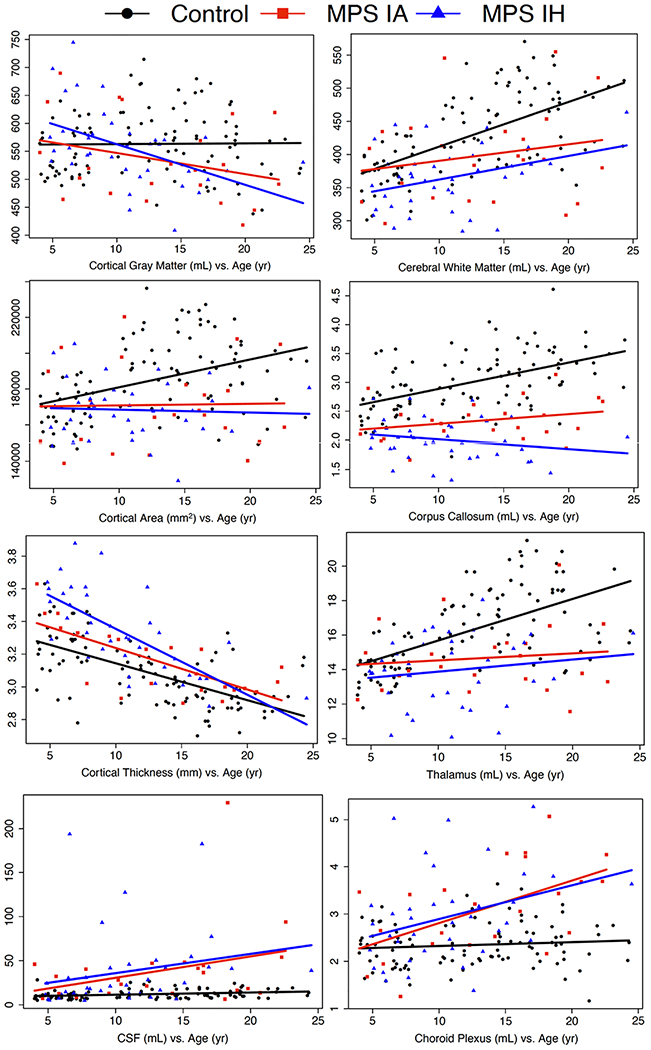
Brain MRI measure vs. age for MPS IA and MPS IH participants and healthy controls.
Age in years on the x-axis, brain MRI measure on the y-axis. HC healthy control, MPS IA attenuated form of mucopolysaccharidosis type I, MPS IH severe form of mucopolysaccharidosis type I, CSF cerebrospinal fluid, corresponds to total ventricular volume.
3.3. Age-related differences in brain MRI measures with the comparison of linear trends between MPS I groups and healthy controls
Volumes of cerebral WM and cortical GM unadjusted for ICV in MPS IH and ChP in both MPS groups (MPS IA > MPS IH) showed significant associations with age (Table 3A, Figure 2). For ICV-adjusted volumes, CC and putamen in MPS IH, pallidum in MPS IA, cortical GM in both MPS groups (MPS IA <MPS IH), and ChP in both MPS groups (MPS IA > MPS IH) were associated with age. In addition, CTh was lower with age in all groups (MPS IH > MPS IA > HC).
Table 3.
Brain MRI measures and age.
| A. Age-related differences in brain MRI measures for MPS IA, MPS IH participants, and HC. | ||||
|---|---|---|---|---|
| Volume (mL)/thickness (mm)/area (mm2) | Group Age (per year) | Mean Difference (95% CI) | P-value | ICV adjusted vol; P-value |
| Amygdala | MPS IA | 0.00 (−0.03, 0.02) | 0.743 | 0.167 |
| MPS IH | −0.01 (−0.03, 0.02) | 0.672 | 0.102 | |
| HC | 0.04 (0.03, 0.06) | <0.001 | 0.201 | |
| Caudate | MPS IA | 0.04 (−0.05, 0.14) | 0.379 | 0.645 |
| MPS IH | 0.01 (−0.08, 0.10) | 0.853 | 0.096 | |
| HC | 0.07 (0.03, 0.11) | <0.001 | 0.358 | |
| Corpus callosum | MPS IA | 0.02 (−0.01, 0.04) | 0.209 | 0.979 |
| MPS IH | −0.02 (−0.04, 0.01) | 0.160 | 0.011 | |
| HC | 0.05 (0.03, 0.06) | <0.001 | 0.044 | |
| Cerebellar GM | MPS IA | 0.30 (−0.42, 1.02) | 0.413 | 0.325 |
| MPS IH | 0.18 (−0.65, 1.00) | 0.672 | 0.074 | |
| HC | 0.62 (0.23, 1.00) | 0.002 | 0.003 | |
| Cerebellar WM | MPS IA | 0.39 (−0.01, 0.79) | 0.054 | 0.214 |
| MPS IH | 0.22 (−0.10, 0.54) | 0.181 | 0.956 | |
| HC | 0.45 (0.33, 0.58) | <0.001 | 0.010 | |
| Cerebral WM | MPS IA | 2.49 (−2.50, 7.49) | 0.328 | 0.954 |
| MPS IH | 3.55 (0.55, 6.55) | 0.020 | 0.504 | |
| HC | 6.74 (5.03, 8.44) | <0.001 | <0.001 | |
| Choroid plexus | MPS IA | 0.09 (0.03, 0.14) | 0.001 | 0.012 |
| MPS IH | 0.07 (0.02, 0.13) | 0.012 | 0.045 | |
| HC | 0.01 (−0.01, 0.02) | 0.305 | 0.019 | |
| Cortical Surface Area | MPS IA | 89.70 (−1658.82, 1838.23) | 0.920 | 0.080 |
| MPS IH | −162.01 (−1313.39, 989.37) | 0.783 | 0.003 | |
| HC | 1556.52 (900.29, 2212.74) | <0.001 | 0.126 | |
| Cortical GM | MPS IA | −3.77 (−9.28, 1.75) | 0.181 | <0.001 |
| MPS IH | −7.25 (−11.65, −2.86) | 0.001 | <0.001 | |
| HC | 0.13 (−1.74, 2.01) | 0.889 | <0.001 | |
| Hippocampus | MPS IA | 0.01 (−0.05, 0.06) | 0.783 | 0.298 |
| MPS IH | −0.01 (−0.08, 0.06) | 0.755 | 0.080 | |
| HC | 0.05 (0.02, 0.08) | <0.001 | 0.004 | |
| Mean Cortical Thickness | MPS IA | −0.03 (−0.04, −0.02) | <0.001 | 0.016 |
| MPS IH | −0.04 (−0.05, −0.03) | <0.001 | <0.001 | |
| HC | −0.02 (−0.03, −0.02) | <0.001 | <0.001 | |
| Pallidum | MPS IA | −0.03 (−0.06, 0.01) | 0.102 | 0.003 |
| MPS IH | 0.02 (−0.02, 0.06) | 0.268 | 0.864 | |
| HC | 0.02 (0.00, 0.04) | 0.069 | <0.001 | |
| Putamen | MPS IA | −0.01 (−0.08, 0.06) | 0.727 | 0.193 |
| MPS IH | −0.04 (−0.13, 0.06) | 0.457 | 0.008 | |
| HC | 0.07 (0.02, 0.12) | 0.005 | 0.008 | |
| Thalamus | MPS IA | 0.04 (−0.10, 0.19) | 0.580 | 0.339 |
| MPS IH | 0.07 (−0.03, 0.17) | 0.188 | 0.425 | |
| HC | 0.24 (0.17, 0.31) | <0.001 | <0.001 | |
| Ventricles | MPS IA | 2.42 (−0.42, 5.26) | 0.094 | 0.117 |
| MPS IH | 2.19 (−0.86, 5.23) | 0.159 | 0.095 | |
| HC | 0.25 (0.09, 0.42) | 0.002 | 0.096 | |
| B. Comparison of linear trends between MPS IA, MPS IH participants, and HC vs. age. | ||||
| Volume (mL)/thickness (mm)/area (mm2) | Group comparison (per year of age) | Mean Difference (95% CI) | P-value | ICV-adjusted vol; P-value |
|
| ||||
| Amygdala | MPS IA vs. HC | 0.05 (0.01, 0.08) | 0.005 | 0.078 |
| MPS IA vs. MPS IH | 0.00 (−0.04, 0.04) | 0.956 | 0.956 | |
| HC vs. MPS IH | 0.05 (0.02, 0.08) | 0.003 | 0.044 | |
| Caudate | MPS IA vs. HC | 0.03 (−0.08, 0.13) | 0.616 | 0.951 |
| MPS IA vs. MPS IH | −0.03 (−0.17, 0.10) | 0.614 | 0.431 | |
| HC vs. MPS IH | 0.06 (−0.04, 0.16) | 0.238 | 0.359 | |
| Corpus callosum | MPS IA vs. HC | 0.03 (0.00, 0.06) | 0.056 | 0.321 |
| MPS IA vs. MPS IH | −0.03 (−0.07, 0.00) | 0.062 | 0.110 | |
| HC vs. MPS IH | 0.06 (0.04, 0.09) | <0.001 | 0.001 | |
| Cerebellar GM | MPS IA vs. HC | 0.32 (−0.50, 1.13) | 0.449 | 0.884 |
| MPS IA vs. MPS IH | −0.12 (−1.21, 0.97) | 0.826 | 0.790 | |
| HC vs. MPS IH | 0.44 (−0.47, 1.35) | 0.346 | 0.835 | |
| Cerebellar WM | MPS IA vs. HC | 0.06 (−0.36, 0.48) | 0.775 | 0.929 |
| MPS IA vs. MPS IH | −0.17 (−0.69, 0.34) | 0.503 | 0.312 | |
| HC vs. MPS IH | 0.24 (−0.11, 0.58) | 0.178 | 0.187 | |
| Cerebral WM | MPS IA vs. HC | 4.25 (−1.03, 9.52) | 0.115 | 0.054 |
| MPS IA vs. MPS IH | 1.06 (−4.77, 6.88) | 0.722 | 0.619 | |
| HC vs. MPS IH | 3.19 (−0.26, 6.64) | 0.070 | 0.172 | |
| Choroid plexus | MPS IA vs. HC | −0.08 (−0.14, −0.02) | 0.005 | 0.002 |
| MPS IA vs. MPS IH | −0.02 (−0.10, 0.06) | 0.641 | 0.727 | |
| HC vs. MPS IH | −0.06 (−0.12, −0.01) | 0.032 | 0.011 | |
| Cortical Surface Area | MPS IA vs. HC | 1466.81 (−400.80, 3334.42) | 0.124 | 0.386 |
| MPS IA vs. MPS IH | −251.71 (−2345.28, 1841.85) | 0.814 | 0.452 | |
| HC vs. MPS IH | 1718.53 (393.27, 3043.79) | 0.011 | 0.062 | |
| Cortical GM | MPS IA vs. HC | 3.90 (−1.92, 9.72) | 0.189 | 0.492 |
| MPS IA vs. MPS IH | −3.49 (−10.54, 3.57) | 0.332 | 0.070 | |
| HC vs. MPS IH | 7.39 (2.61, 12.17) | 0.002 | 0.004 | |
| Hippocampus | MPS IA vs. HC | 0.04 (−0.02, 0.10) | 0.195 | 0.962 |
| MPS IA vs. MPS IH | −0.02 (−0.11, 0.07) | 0.678 | 0.566 | |
| HC vs. MPS IH | 0.06 (−0.01, 0.13) | 0.104 | 0.429 | |
| Mean Cortical Thickness | MPS IA vs. HC | 0.00 (−0.01, 0.01) | 0.637 | 0.597 |
| MPS IA vs. MPS IH | −0.01 (−0.03, 0.00) | 0.056 | 0.431 | |
| HC vs. MPS IH | 0.02 (0.00, 0.03) | 0.009 | 0.626 | |
| Pallidum | MPS IA vs. HC | 0.04 (0.01, 0.08) | 0.019 | 0.125 |
| MPS IA vs. MPS IH | 0.05 (0.00, 0.09) | 0.057 | 0.060 | |
| HC vs. MPS IH | 0.00 (−0.04, 0.04) | 0.880 | 0.323 | |
| Putamen | MPS IA vs. HC | 0.08 (0.00, 0.16) | 0.053 | 0.702 |
| MPS IA vs. MPS IH | −0.02 (−0.14, 0.09) | 0.680 | 0.603 | |
| HC vs. MPS IH | 0.11 (0.00, 0.22) | 0.054 | 0.194 | |
| Thalamus | MPS IA vs. HC | 0.20 (0.04, 0.36) | 0.015 | 0.036 |
| MPS IA vs. MPS IH | 0.03 (−0.15, 0.21) | 0.748 | 0.873 | |
| HC vs. MPS IH | 0.17 (0.05, 0.30) | 0.008 | 0.043 | |
| Ventricles | MPS IA vs. HC | −2.17 (−5.01, 0.67) | 0.135 | 0.148 |
| MPS IA vs. MPS IH | −0.24 (−4.40, 3.93) | 0.911 | 0.803 | |
| HC vs. MPS IH | −1.93 (−4.98, 1.12) | 0.214 | 0.117 | |
Differences showed per year of age.
MPS IA attenuated form of mucopolysaccharidosis type I, MPS IH severe form of mucopolysaccharidosis type I, HC healthy controls, GM gray matter, WM white matter, ICV intracranial volume. CI confidence interval. P-values are presented for ICV non-adjusted volumes (P-value) and ICV-adjusted brain volumes (ICV adjusted Vol; P-value). P-values ≤ 0.05 in italic, ≤ 0.01 in bold.
The comparison of age-related slopes for brain MRI metrics between groups is summarized in Table 3B. Between MPS IH and MPS IA participants, there were no significant differences in slopes. However, for ICV-unadjusted measures, the slopes differed between MPS IH and HC in the CC, amygdala, thalamus, ChP, CSA, CTh, and cortical GM; the slopes between MPS IA and HC differed in the amygdala, ChP, pallidum, and thalamus. For ICV-adjusted volumes, the slopes differed between MPS IH and HC in the CC, amygdala, thalamus, ChP, and cortical GM; the slopes between MPS IA and HC differed in the ChP and thalamus.
3.4. Association of brain MRI measures and IQ with the comparison of linear trends between MPS I groups and healthy controls
High IQ values were associated with high ICV-unadjusted cortical GM volumes, low ICV-unadjusted and ICV-adjusted ventricular volumes, and high CTh only in the MPS IA group. Comparison of IQ scores vs. CTh revealed the positive relationship for MPS IA and the negative relationship for both HC and MPS IH. In addition, the comparison of IQ scores vs. ventricular volume differed between MPS IA and HC and between MPS IH and HC (Table 4, Figure 3).
Table 4.
Brain MRI measures and IQ.
| A. Brain MRI measure vs. IQ for
MPS IA, MPS IH participants, and HC | ||||
|---|---|---|---|---|
| Predictor | Group | IQ mean difference (95% CI) | P-value | ICV-adjusted vol; P-value |
| Cortical thickness (per mm) | MPS IA | 45.77 (16.65, 74.89) | 0.002 | 0.355 |
| MPS IH | −5.94 (−34.28, 22.41) | 0.681 | 0.753 | |
| HC | −3.28 (−15.56, 9.00) | 0.601 | <0.001 | |
| Cortical GM (per mL) | MPS IA | 0.09 (0.02, 0.16) | 0.008 | 0.056 |
| MPS IH | 0.02 (−0.09, 0.12) | 0.765 | 0.770 | |
| HC | 0.09 (0.06, 0.12) | <0.001 | 0.797 | |
| Cortical SA (per mm2) | MPS IA | 0.12 (−0.17, 0.41) | 0.430 | 0.447 |
| MPS IH | 0.19 (−0.11, 0.49) | 0.209 | 0.429 | |
| HC | 0.20 (0.10, 0.31) | <0.001 | 0.276 | |
| Cerebral WM (per mL) | MPS IA | 0.00 (−0.10, 0.11) | 0.929 | 0.934 |
| MPS IH | 0.03 (−0.09, 0.14) | 0.641 | 0.358 | |
| HC | 0.07 (0.03, 0.11) | <0.001 | 0.871 | |
| Thalamus (per mL) | MPS IA | 1.01 (−2.82, 4.84) | 0.604 | 0.608 |
| MPS IH | 1.66 (−0.26, 3.58) | 0.090 | 0.150 | |
| HC | 2.00 (1.04, 2.96) | <0.001 | 0.728 | |
| Ventricles (per mL) | MPS IA | −0.12 (−0.19, −0.04) | 0.002 | 0.014 |
| MPS IH | −0.03 (−0.15, 0.09) | 0.599 | 0.549 | |
| HC | 0.62 (0.20, 1.05) | 0.004 | 0.122 | |
| B. Comparison of linear trends
between MPS IA, MPS IH participants, and HC vs. IQ | ||||
| Predictor | Group | IQ slope difference (95% CI) | P-value | ICV-adjusted vol; P-value |
|
| ||||
| Cortical thickness (per mm) | MPS IA vs. HC | −49.05 (−80.65, −17.45) | 0.002 | 0.029 |
| MPS IA vs. MPS IH | −51.71 (−92.34, −11.07) | 0.013 | 0.352 | |
| HC vs. MPS IH | 2.66 (−28.23, 33.54) | 0.866 | 0.153 | |
| Cortical GM (per mL) | MPS IA vs. HC | 0.00 (−0.07, 0.07) | 0.969 | 0.068 |
| MPS IA vs. MPS IH | −0.07 (−0.20, 0.05) | 0.242 | 0.224 | |
| HC vs. MPS IH | 0.07 (−0.04, 0.18) | 0.194 | 0.704 | |
| Cortical SA (per mm2) | MPS IA vs. HC | 0.09 (−0.22, 0.40) | 0.580 | 0.266 |
| MPS IA vs. MPS IH | 0.08 (−0.34, 0.49) | 0.723 | 0.981 | |
| HC vs. MPS IH | 0.01 (−0.31, 0.33) | 0.942 | 0.245 | |
| Cerebral WM (per mL) | MPS IA vs. HC | 0.06 (−0.05, 0.17) | 0.258 | 0.882 |
| MPS IA vs. MPS IH | 0.02 (−0.13, 0.18) | 0.776 | 0.560 | |
| HC vs. MPS IH | 0.04 (−0.08, 0.16) | 0.497 | 0.532 | |
| Thalamus (per mL) | MPS IA vs. HC | 0.99 (−2.96, 4.93) | 0.624 | 0.788 |
| MPS IA vs. MPS IH | 0.65 (−3.63, 4.93) | 0.767 | 0.792 | |
| HC vs. MPS IH | 0.34 (−1.81, 2.48) | 0.757 | 0.449 | |
| Ventricles (per mL) | MPS IA vs. HC | 0.74 (0.31, 1.17) | <0.001 | 0.034 |
| MPS IA vs. MPS IH | 0.09 (−0.06, 0.23) | 0.234 | 0.291 | |
| HC vs. MPS IH | 0.66 (0.22, 1.10) | 0.003 | 0.098 | |
MPS IA attenuated form of mucopolysaccharidosis type I, MPS IH severe form of mucopolysaccharidosis type I, HC healthy controls, GM gray matter, SA surface area, WM white matter, ICV intracranial volume, CI confidence interval. P-values are presented for ICV non-adjusted volumes (P-value) and ICV-adjusted brain volumes (ICV-adjusted vol; P-value). P-values ≤ 0.05 in italic, ≤ 0.01 in bold.
Figure 3.
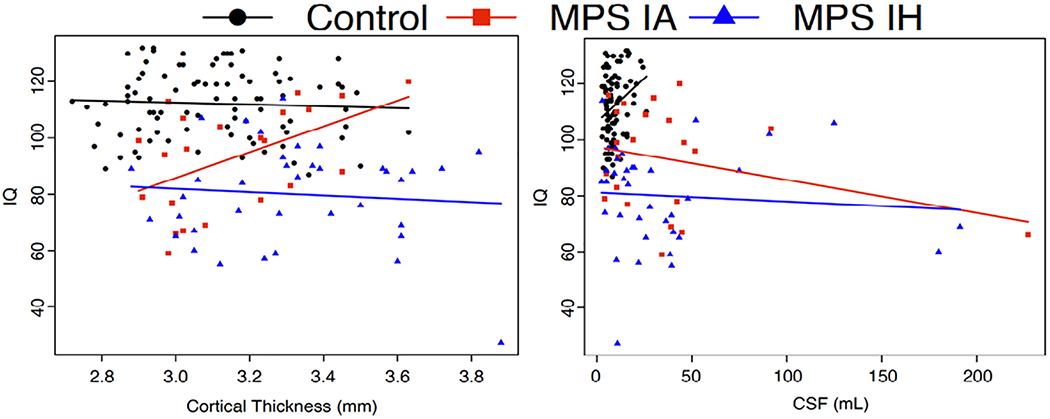
Cortical thickness and ventricular volume (CSF) vs. IQ for MPS IA and MPS IH participants and healthy controls.
Brain measure on the x-axis, IQ score on the y-axis. HC healthy control, MPS IA attenuated form of mucopolysaccharidosis type I, MPS IH severe form of mucopolysaccharidosis type I, CSF cerebrospinal fluid, corresponds to total ventricular volume.
4. Discussion
This study systematically measured MPS I-related changes in brain macrostructure with quantitative MRI to investigate potential differences between phenotypes and compare the magnitude of abnormality to healthy controls. Cortical gray and white matter, CC, thalamus and globus pallidum, ventricles and ChP were altered in this cross-sectional study of participants with attenuated and severe forms of MPS I. Cortical GM-derived measures, including cortical thickness, CC, thalamus, and ChP volumes showed age-related differences in both MPS I groups but were most pronounced in MPS IH. Significant IQ-related associations were present for ventricular volume in both MPS I forms and cortical thickness in MPS IA. The findings of this study suggest that distinct differences exist between severe and attenuated forms of MPS I as assessed by quantitative MRI.
MPS I is a rare autosomal recessive disease caused by mutations in the alpha-L-iduronidase (IDUA) coding gene. These mutations lead to the absence or insufficient levels of the lysosomal IDUA hydrolytic enzyme responsible for the breakdown of large sugar molecules called glycosaminoglycans (GAG)16, 17. As a result, GAG accumulate in various organ systems, including the CNS, leading to multisystem dysfunction and neurological disease of varying severity5, 17. The severe form of the disease, Hurler syndrome (MPS IH), is treated by hematopoietic stem cell transplantation (HSCT) to halt neurological and cognitive deterioration and prevent death. Individuals with the same enzymatic deficiency, but the later onset of clinical symptoms, are diagnosed with Scheie (mild) and Hurler-Scheie (intermediate) syndromes. As no biochemical differences have been found and clinical manifestations in Scheie and Hurler-Scheie syndromes overlap, both are referred to collectively as MPS I attenuated (MPS IA)5, 18. Intravenous recombinant enzyme replacement therapy (ERT) is the standard of care for patients with MPS IA, as it improves somatic aspects of the disease19. However, the intravenous enzyme does not cross the blood-brain barrier (BBB) at recommended doses and has no direct therapeutic effect on brain disease20, 21.
4.1. Automated brain segmentation in MPS I
Quantitative MRI studies evaluating brain abnormality by fully automated processing pipelines in MPS I are lacking. This may be due to challenges in the analysis since abnormal brain morphology complicates the registration of brain MRIs acquired from participants with MPS to common atlas space. The automated segmentation process of scans with abnormalities such as ventriculomegaly, enlarged perivascular spaces, or extensive white matter abnormality is prone to frequent mis-segmentations of brain regions4. Almost half of the scans in our study required at least one manual correction of automated segmentation to yield satisfactory results. Labor-intensive manual corrections performed by an operator with expertise in neuroanatomy and subsequent re-analysis are necessary. Both add to the overall time per analysis, which needs to be considered when conducting studies with populations having similar structural brain abnormalities. Meningeal thickening due to GAG storage present in MPS I may affect the estimation of ICV by automated approaches. Intracranial volume, which is usually used to adjust brain structure size to individual head size, may be inaccurate if applied to the MPS I population. Here, both adjusted and unadjusted outcomes were applied and reported to provide a full description of the brain volumetrics.
4.2. White matter
Previous research has demonstrated reduced volumes of cerebral WM and of the major cerebral WM tract, the corpus callosum, in humans 5, 6 and dogs22 with MPS I. Abnormal myelination as an underlying process of WM disease in MPS I has been suggested by diffusion MRI (dMRI) and neuro-histochemical animal studies23-25. A case study of a deceased Hurler patient reported gliosis with disruption of the normal lamellar myelination pattern leading to the destruction of the myelin sheath and axonal degeneration26. Dystrophic axons with thin myelin sheaths were found in the MPS I mouse brain27. Lower WM integrity in dMRI and CC volume were shown in MPS I participants28, 29 and were related to attention in MPS I6 and MPS II attenuated participants30. Our findings with a larger MPS I cohort demonstrate reduced cerebral WM and CC volumes and highlight the presence of WM abnormalities in the entire spectrum of MPS I. Maturation of WM via increases in myelin content, reflected by incremental increases in volume, is well known in neurodevelopment31 and also illustrated by our volumetric findings in healthy controls. White matter volumes in both MPS I groups showed an association with age that was different from the healthy controls, and was already present in the youngest MPS I participants; this was especially evident in the MPS IH group where CC volume had a negative association with age. There was a positive association between IQ and cerebral WM in HC, but, notably, no significant association existed in either MPS I group, presumably due to excess GAG accumulation in WM in participants with MPS I. GAG and other storage material affect neurons, glial cells and may result in gliosis or cell death32. Furthermore, the perivascular GAG deposition, which manifests as enlarged perivascular spaces and may be associated with glymphatic system impairment, inflammation, watershed ischemia in the deep white matter may contribute to the white matter abnormality and impaired myelination in MPS I. Absolute and age-related cerebellar WM volumes were comparable between all groups. White matter abnormalities are an important aspect of neurologic disease in both MPS IH and MPS IA. Still, longitudinal data are needed to elucidate the individual trajectories of WM development and determine the extent of the divergence from the development seen in healthy controls.
4.3. Cortical gray matter
Cortical atrophy in MPS I, as assessed by a rating scale, was observed in dogs22 and humans33, 34 with MPS I but was not detected in a pilot study of five MPS I and five healthy dogs when evaluated by automatically generated CTh35. In the current study, cortical atrophy was measured by qMRI. Age-related slopes of cortical GM volume, CTh, and CSA deviated in both MPS I groups from HC, but only achieved statistical significance in all three measures in the MPS IH group. Linear trends showed that younger participants (even the youngest 4-5-year-old MPS I participants) had comparable cortical GM volumes and CSA but that CTh was greater in MPS IH > MPS IA > HC. Age-related expansion of CSA seen in the HC group was not observed in either MPS I group. IQ was positively associated with CTh in MPS IA participants; in contrast, IQ was negatively associated with CTh in MPS IH and HC. The observed age-related decrease in cortical GM volume in MPS I may result from equivalent cortical thinning without a commensurate expansion of CSA. The expansion of CSA is contingent upon the size of intracortical elements (neuropil) or cortical WM adjacent to specific gyrus or sulcus11, 36, 37 and the lack of CSA expansion in MPS I may be explained by structural alterations affecting these regions.
Histological evidence of GAG reduction has been measured after a high dose of ERT in MPS I mouse38 and after intrathecal ERT administration in dog39. In MPS IH, the age-related lower CTh and cortical GM volume may be explained by GAG elimination after HSCT and subsequent cortical GM reorganization, observed in normal neurodevelopment. In our dataset, age-related slopes of cortical GM-derived parameters in MPS IA were comparable to MPS IH, except in CTh, which remained greater across ages. Glycosaminoglycan clearance from the CNS is not expected and may not explain the observed positive association of IQ and CTh, because intravenous ERT, as used for MPS IA, does not treat brain disease. It is important to note that an ongoing neurodegenerative process may also be considered given the similar slopes in both MPS I groups.
Cortical brain plasticity, measured as the size and surface area of cortical GM in MRI, is associated with human intellectual ability11. Cortical GM volume over the typical lifespan follows an inverted U-shaped developmental trajectory with age 40 with its maximal peak around 10 years of age11. Mean cortical thickness decreases rapidly around this same age and is stable, whereas cortical surface area expands until 12-13 years of age and afterward is stable or decreases11, 37. The relationship of cortical GM metrics to IQ is complex and non-linear across the lifespan and does not simply follow the rule “more is better.” Higher IQ is associated with cortical thinning in childhood and adolescence, but this relationship is inversed in adulthood. Larger CSA is associated with higher IQ at around age 10 years, but then CSA decreases, which occurs at a higher rate in individuals with higher IQ11. The age of CSA peak expansion was also shown to relate to IQ11. The physiological mechanisms underlying changes in cortical microarchitecture are related to cellular and molecular events during neurodevelopment: The number of neurons and their mini-columnar organization with glial and capillary support, dendritic arborization, and ongoing GM myelination (“white matter encroachment”) contribute to cortical GM volume, CTh, and CSA11, 37. Dynamic reorganization of synaptic circuitry, caused by synaptic pruning, gliogenesis, and changes in capillary support during brain maturation, may be measured by MRI as changes in cortical GM volume or thickness. Myelination in deep intracortical layers (gray/white matter boundary) during development represents a potential technical limitation in MRI evaluation of cortical GM parameters37. The myelination process can result in T1-weighted signal intensity shift (signal increase) of voxels classified as GM to voxels classified as WM, which may represent a major contributor to cortical thinning measured from T1-weighted MRI in late childhood and adolescence37, 41. For qMRI studies evaluating cortical GM, scans must be acquired with identical MRI sequence parameters to avoid unwanted GM/WM volumetric bias arising from differences in voxel intensity that can occur from technical discrepancies. Another critical aspect of qMRI studies of MPS participants that should not be neglected is the comparison to normal development (i.e., MRI scans of healthy controls acquired with identical imaging protocol)4.
4.4. Subcortical gray matter
Subcortical GM volumes also follow an inverted U-shaped developmental trajectory, similar to cortical GM,40 that peaks around age 13-17 years42. Both the thalamus and globus pallidum in both MPS I groups and the hippocampus in MPS IA participants were smaller than in HC. Age-related curves of the amygdala, thalamus, and globus pallidum volumes diverged from HC but were comparable between MPS I groups. The thalamus serves as a relay point for major WM pathways in the brain43. Thus, a reduced thalamic volume may be secondary to WM pathology (e.g., as found in MS44) or primarily due to MPS I GM disease. Primary thalamic pathology seems plausible given the findings in other subcortical GM structures (e.g., globus pallidum and amygdala in MPS IH and MPS IA and hippocampus in MPS IA). Glycosaminoglycan accumulation was demonstrated in subcortical GM of canine MPS I and cleared after intrathecal ERT45. Still, it seems unlikely that GAG clearance explains changes in thalamic or other subcortical volumes as both MPS groups showed similar slopes.
4.5. Ventricles and choroid plexus
Ventriculomegaly is one of the MRI hallmarks in MPS I 4. Ventricular volume very slowly and steadily increases from infancy through adolescence during normal development46. An age-related increase in ventricular and ChP volumes was present in both MPS I groups, whereas in the HC group, no age-related change in these structures was detected. As previously described in MPS I5, IQ was negatively associated with ventricular volumes. It is important to note that ventricular and ChP volumes had the highest variability across all measured brain structures, underscoring that MPS I is a phenotypically heterogeneous disease.
The choroid plexus is a structure that produces 70-80% of CSF and regulates the internal CSF microenvironment47. During development, the ChP is derived from the intraventricular extension of vascularized leptomeningeal tissue. Therefore, similar GAG storage and size expansion as seen in meninges can be expected in ChP tissue. An autopsy study identified nodular lesions resulting from the proliferation of vacuolated pericytes, fibroblasts, and arachnoid cells in MPS I brains, supporting this hypothesis. These nodular lesions, which may increase the total size of the ChP, were not associated with age, hydrocephalus severity, or enlargement of perivascular spaces in WM48. Glycosaminoglycan buildup in the arachnoid granulations has traditionally been believed to be responsible for the decreased CSF clearance into the dural sinuses and the subsequent development of communicating hydrocephalus16. Choroid plexus hypertrophy leading to excessive CSF production has not been posited as a possible cause of ventriculomegaly in MPS I. Our study revealed a significant correlation between ventricular and ChP volumes (MPS IH > MPS IA > HC), but future studies are necessary to elucidate if a functional relationship exists between ChP enlargement, CSF production, and ventriculomegaly in MPS I.
4.6. Limitations
There are some limitations of this study, particularly the use of cross-sectional data to infer developmental changes. Additionally, true natural history data with “naïve” MPS I participants are unavailable as all patients undergo HSCT or receive intravenous ERT as standard-of-care. Healthy control data acquired on a Philips scanner were not available, though the 3D T1-weighted protocols used on each scanner in this study were uniform. Limited sample size inherent to studying rare diseases reduces the power to identify significant differences and limits the ability to use a more elaborate model to fit developmental curves. Intracranial volume adjustment and its shortcomings, based on estimating ICV49, 50 with MRI, has been discussed above (see section 4.1.). Finally, participants with ventricular shunts who likely have even more severe brain disease were excluded from the analysis. This is because of the introduction of iatrogenic manipulation of neuroanatomical volume and because susceptibility artifacts incurred by programmable ventriculoperitoneal shunts cause local loss of signal intensity.
5. Conclusion
In this cross-sectional, observational MRI study, quantitively measured changes in brain macrostructure distinguished participants with MPS I from a cohort of healthy controls and distinguished participants with severe from attenuated forms of MPS I. Morphometric differences in cortical and subcortical gray matter, ventricles, and choroid plexus were documented and quantified in addition to the previously described white matter abnormalities. Further, a longitudinal investigation is needed to confirm the relationships observed in this study and elucidate the impact of this disease on the neurodevelopmental trajectories of individuals with MPS I. Finally, reliable quantitative assessment of MPS brain abnormality is exceedingly desirable for the evaluation of novel CNS-directed treatments.
Highlights.
Quantitively measured brain macrostructure distinguished MPS I and healthy subjects
Brain MRI volumes differed in participants with severe and attenuated MPS I forms
In addition to white matter, other brain regions showed morphometric changes
Cortical and subcortical gray matter, ventricles, and choroid plexus were altered
IQ-related associations to ventricular volume and cortical thickness were present
Acknowledgment
We thank the children and their parents and/or caretakers, and adults with mucopolysaccharidosis for their participation in this study. In addition, we thank Dr. Bruce Fischl from MGH-NMR Center, Harvard University, for his guidance and support in the processing of complicated cases. The authors also thank Brenda Diethelm-Okita, Ashley Schneider (née Wiesenburger), David Erickson, and Evelyn Redtree in the Lysosomal Disease Network office at the University of Minnesota for administrative assistance. Study data were collected and managed with REDCap electronic data capture tools hosted at the University of Minnesota.
The study was funded by the Sanofi Genzyme (GZ-2014-11270), the National MPS Society, Million Dollar Bike Ride from the University of Pennsylvania (MDBR-16-125-MPS, 303052MPSI-16-003-02), the Ryan Foundation, the Rare Diseases Clinical Research Network, Lysosomal Disease Network, NIH U54NS065768, and the resources of the Center for Magnetic Resonance Research (supported by NIBIB P41 EB027061, P30 NS076408, and 1S10OD017974-01), the Center for Neurobehavioral Development, and the Minnesota Supercomputing Institute.
Control data were supported by the NIH (5P41RR008079, 5K12RR023247, P30-NS057091, and MO1-RR00400; K24 MH071434, K24 DA028773, RO1-MH61744, R01-AA12479, and RO1-MH63407 to Master Drug Data Base), Medical Investigation of Neurodevelopmental Disorders Institute, and Gillette Children’s Research Fund, Shire/Takeda (4-7-year-old study), and Clinical and Translational Science Institute grant support (UL1TR000114 from the National Center for Advancing Translational Sciences [NCATS] of the NIH). This publication was also supported in part by the NIH NCATS through UCSF-CTSI grant UL1TR000004. Its contents are solely the authors’ responsibility and do not necessarily represent the official views of the NIH.
Author disclosures
Victor Kovac reports no disclosures.
Elsa G. Shapiro, Consultant for Shapiro Neuropsychology Consulting LLC
Kyle D. Rudser reports no disclosures.
Bryon Mueller reports no disclosures.
Julie B. Eisengart, Research support from Lysogene, Sangamo, Shire/Takeda and Sobi; consulting fees from ArmaGen, Denali Therapeutics, JCR Pharmaceutical, Orchard Therapeutics, ReGenXBio and Shire/Takeda; and advisory boards for Amicus Therapeutics, bluebird bio, Denali, Orchard Therapeutics, ReGenXBio, Sanofi Genzyme and Shire/Takeda.
Kathleen A. Delaney, employee of BioMarin Pharmaceutical Inc
Alia Ahmed reports no disclosures.
Kelly King, Consultant for Passage Bio, RTI Health Solutions, has received research support from Alexion Pharmaceuticals, Inc, bluebird bio, Magenta Therapeutics, Sanofi Genzyme, Shire/Takeda, and was previously a consultant for Shire Plc, and has done previous contract work for Shapiro Neuropsychology Consulting.
Brianna Yund reports no disclosures.
Morton Cowan, Consultant for SAB, Homology Medicine; DSMB, bluebird, bio; DSMB, Chiesi, Inc; DSMB, Rocket Pharma
Julian Raiman, Travel grants, speaker, consultancy fees, and research grants From Genzyme Sanofi, Takeda/Shire HGT, BioMarin, Actelion, Pfizer, Alexion.
Eva Mamak reports no disclosures.
Paul Harmatz, Consultant for BioMarin, Shire, Genzyme, Chiesi, Inventiva, Paradigm, Ultragenyx, SOBI, JCR, Denali, Orphazyme, RegenXbio,Homology, Audentes, Aeglea, and Sangamo, he has received grants from BioMarin, payments (lectures, speakerships, honoraria) from BioMarin, Chiesi, Ultragenyx, and Orphazyme and travel, accommodations, and/or payments for meeting expenses from BioMarin, Shire, Genzyme, Chiesi, Inventiva, Ultragenyx, SOBI, and RegenXbio.
Suma Shankar reports lecture honoraria from Sanofi Genzyme.
Stephanie Cagle reports no disclosures.
Nadia Ali, Research support from Sanofi Genzyme, Shire Takeda, BioMarin, Amicus, and Pfizer, as well as lecturers’ honoraria from Sanofi Genzyme, BioMarin, Amicus, and Vitaflo.
Jeff Wozniak reports no disclosures.
Kelvin Lim reports no disclosures.
Paul Orchard, Consultant for Neurogene, Orchard Therapeutics, Rocket Therapeutics; Clinical Trial Support with Immusoft, Bluebird Bio.
Chester B Whitley, Research support from National Institutes of Health including Lysosomal Disease Network (RDCRN) NIH U54NS065768.
Igor Nestrasil, Consultant for ICON, Bioclinica, and Quantims and received research support from Million Dollar Bike Ride - University of Pennsylvania, National MPS Society, Biomarin, Sanofi Genzyme, and Shire/Takeda.
Abbreviations:
- qMRI
quantitative magnetic resonance imaging
- WM
white matter
- GM
gray matter
- CTh
cortical thickness
- CSA
cortical surface area
- ChP
choroid plexus
Footnotes
Publisher's Disclaimer: This is a PDF file of an unedited manuscript that has been accepted for publication. As a service to our customers we are providing this early version of the manuscript. The manuscript will undergo copyediting, typesetting, and review of the resulting proof before it is published in its final form. Please note that during the production process errors may be discovered which could affect the content, and all legal disclaimers that apply to the journal pertain.
References
- 1.Vedolin L, Schwartz IVD, Komlos M, et al. Brain MRI in mucopolysaccharidosis - Effect of aging and correlation with biochemical findings. Neurology 2007;69:917–924. [DOI] [PubMed] [Google Scholar]
- 2.Wang RY, Cambray-Forker EJ, Ohanian K, et al. Treatment reduces or stabilizes brain imaging abnormalities in patients with MPS I and II. Mol Genet Metab 2009;98:406–411. [DOI] [PubMed] [Google Scholar]
- 3.Matheus MG, Castillo M, Smith JK, Armao D, Towle D, Muenzer J. Brain MRI findings in patients with mucopolysaccharidosis types I and II and mild clinical presentation. Neuroradiology 2004;46:666–672. [DOI] [PubMed] [Google Scholar]
- 4.Nestrasil I, Vedolin L. Quantitative neuroimaging in mucopolysaccharidoses clinical trials. Mol Genet Metab 2017;122S:17–24. [DOI] [PubMed] [Google Scholar]
- 5.Shapiro EG, Nestrasil I, Rudser K, et al. Neurocognition across the spectrum of mucopolysaccharidosis type I: Age, severity, and treatment. Mol Genet Metab 2015;116:61–68. [DOI] [PMC free article] [PubMed] [Google Scholar]
- 6.King KE, Rudser KD, Nestrasil I, et al. Attention and corpus callosum volumes in individuals with mucopolysaccharidosis type I. Neurology 2019;92:e2321–e2328. [DOI] [PMC free article] [PubMed] [Google Scholar]
- 7.Chen AH, Harmatz P, Nestrasil I, et al. Intrathecal enzyme replacement for cognitive decline in mucopolysaccharidosis type I, a randomized, open-label, controlled pilot study. Mol Genet Metab 2020;129:80–90. [DOI] [PMC free article] [PubMed] [Google Scholar]
- 8.Nestrasil I, Shapiro E, Svatkova A, et al. Intrathecal enzyme replacement therapy reverses cognitive decline in mucopolysaccharidosis type I. Am J Med Genet A 2017;173:780–783. [DOI] [PMC free article] [PubMed] [Google Scholar]
- 9.Burgaleta M, Johnson W, Waber DP, Colom R, Karama S. Cognitive ability changes and dynamics of cortical thickness development in healthy children and adolescents. Neuroimage 2014;84:810–819. [DOI] [PMC free article] [PubMed] [Google Scholar]
- 10.Lange N, Froimowitz MP, Bigler ED, Lainhart JE, Grp BDC. Associations Between IQ, Total and Regional Brain Volumes, and Demography in a Large Normative Sample of Healthy Children and Adolescents. Developmental Neuropsychology 2010;35:296–317. [DOI] [PMC free article] [PubMed] [Google Scholar]
- 11.Schnack HG, van Haren NEM, Brouwer RM, et al. Changes in Thickness and Surface Area of the Human Cortex and Their Relationship with Intelligence. Cerebral Cortex 2015;25:1608–1617. [DOI] [PubMed] [Google Scholar]
- 12.Luders E, Narr KL, Thompson PM, Toga AW. Neuroanatomical Correlates of Intelligence. Intelligence 2009;37:156–163. [DOI] [PMC free article] [PubMed] [Google Scholar]
- 13.Fischl B, Salat DH, Busa E, et al. Whole brain segmentation: automated labeling of neuroanatomical structures in the human brain. Neuron 2002;33:341–355. [DOI] [PubMed] [Google Scholar]
- 14.FreeSurfer: FreeSurfer Release Notes. https://surfer.nmr.mgh.harvard.edu/fswiki/ReleaseNotes [computer program] 2017.
- 15.A language and environment for statistical computing. R Foundation for Statistical Computing, Vienna, Austria. http://www.R-project.org/ [computer program] 2014. [Google Scholar]
- 16.Neufeld E, Muenzer J, Scriver C, Beaudet A, Sly W. The mucopolysaccharidoses: McGraw-Hill, 2001. [Google Scholar]
- 17.Whitley CB. The mucopolysaccharidoses. In: Beighton P, ed. McKusick’s Heritable Disorders of Connective Tissue, 5th ed: St Louis, C.V. Mosby, 1993: 367–499. [Google Scholar]
- 18.Pastores GM, Arn P, Beck M, et al. The MPS I registry: design, methodology, and early findings of a global disease registry for monitoring patients with Mucopolysaccharidosis Type I. Mol Genet Metab 2007;91:37–47. [DOI] [PubMed] [Google Scholar]
- 19.Kakkis ED, Muenzer J, Tiller GE, et al. Enzyme-replacement therapy in mucopolysaccharidosis I. N Engl J Med 2001;344:182–188. [DOI] [PubMed] [Google Scholar]
- 20.Urayama A, Grubb JH, Sly WS, Banks WA. Developmentally regulated mannose 6-phosphate receptor-mediated transport of a lysosomal enzyme across the blood-brain barrier. Proc Natl Acad Sci U S A 2004;101:12658–12663. [DOI] [PMC free article] [PubMed] [Google Scholar]
- 21.Eisengart JB, Rudser KD, Xue Y, et al. Long-term outcomes of systemic therapies for Hurler syndrome: an international multicenter comparison. Genet Med 2018;20:1423–1429. [DOI] [PMC free article] [PubMed] [Google Scholar]
- 22.Vite CH, Nestrasil I, Mlikotic A, et al. Features of brain MRI in dogs with treated and untreated mucopolysaccharidosis type I. Comp Med 2013;63:163–173. [PMC free article] [PubMed] [Google Scholar]
- 23.Provenzale JM, Nestrasil I, Chen S, et al. Diffusion tensor imaging and myelin composition analysis reveal abnormal myelination in corpus callosum of canine mucopolysaccharidosis I. Exp Neurol 2015;273:1–10. [DOI] [PMC free article] [PubMed] [Google Scholar]
- 24.Satzer D, DiBartolomeo C, Ritchie MM, et al. Assessment of dysmyelination with RAFFn MRI: application to murine MPS I. PLoS One 2015;10:e0116788. [DOI] [PMC free article] [PubMed] [Google Scholar]
- 25.Le SQ, Nestrasil I, Kan SH, et al. Myelin and Lipid Composition of the Corpus Callosum in Mucopolysaccharidosis Type I Mice. Lipids 2020. [DOI] [PMC free article] [PubMed] [Google Scholar]
- 26.Loeb H, Jonniaux G, Resibois A, et al. Biochemical and ultrastructural studies in Hurler’s syndrome. J Pediatr 1968;73:860–874. [DOI] [PubMed] [Google Scholar]
- 27.Wilkinson FL, Holley RJ, Langford-Smith KJ, et al. Neuropathology in mouse models of mucopolysaccharidosis type I, IIIA and IIIB. PLoS One 2012;7:e35787. [DOI] [PMC free article] [PubMed] [Google Scholar]
- 28.Shapiro E, Guler OE, Rudser K, et al. An exploratory study of brain function and structure in mucopolysaccharidosis type I: long term observations following hematopoietic cell transplantation (HCT). Mol Genet Metab 2012;107:116–121. [DOI] [PMC free article] [PubMed] [Google Scholar]
- 29.Nestrasil I, Shapiro E, Svatkova A, et al. Intrathecal Enzyme Replacement Therapy Reverses Cognitive Decline in Mucopolysaccharidosis type I. Am J Med Genet A 2017;173:780–783. [DOI] [PMC free article] [PubMed] [Google Scholar]
- 30.Yund B, Rudser K, Ahmed A, et al. Cognitive, medical, and neuroimaging characteristics of attenuated mucopolysaccharidosis type II. Mol Genet Metab 2015;114:170–177. [DOI] [PMC free article] [PubMed] [Google Scholar]
- 31.Tanaka-Arakawa MM, Matsui M, Tanaka C, et al. Developmental changes in the corpus callosum from infancy to early adulthood: a structural magnetic resonance imaging study. PLoS One 2015;10:e0118760. [DOI] [PMC free article] [PubMed] [Google Scholar]
- 32.Bigger BW, Begley DJ, Virgintino D, Pshezhetsky AV. Anatomical changes and pathophysiology of the brain in mucopolysaccharidosis disorders. Mol Genet Metab 2018;125:322–331. [DOI] [PubMed] [Google Scholar]
- 33.Lee C, Dineen TE, Brack M, Kirsch JE, Runge VM. The mucopolysaccharidoses: characterization by cranial MR imaging. AJNR Am J Neuroradiol 1993;14:1285–1292. [PMC free article] [PubMed] [Google Scholar]
- 34.Matheus MG, Castillo M, Smith JK, Armao D, Towle D, Muenzer J. Brain MRI findings in patients with mucopolysaccharidosis types I and II and mild clinical presentation. Neuroradiology 2004;46:666–672. [DOI] [PubMed] [Google Scholar]
- 35.Labounek R, Mai K, Mueller B, Ellinwood NM, Dickson P, Nestrasil I. In-vivo cortical thickness estimation from high-resolution T1w MRI scans in healthy and mucopolysaccharidosis affected dogs. Conf Proc IEEE Eng Med Biol Soc 2019;2019:2848–2851. [DOI] [PMC free article] [PubMed] [Google Scholar]
- 36.Lemaitre H, Goldman AL, Sambataro F, et al. Normal age-related brain morphometric changes: nonuniformity across cortical thickness, surface area and gray matter volume? Neurobiol Aging 2012;33:617 e611–619. [DOI] [PMC free article] [PubMed] [Google Scholar]
- 37.Burgaleta M, Johnson W, Waber DP, Colom R, Karama S. Cognitive ability changes and dynamics of cortical thickness development in healthy children and adolescents. Neuroimage 2014;84:810–819. [DOI] [PMC free article] [PubMed] [Google Scholar]
- 38.Ou L, Herzog T, Koniar BL, Gunther R, Whitley CB. High-dose enzyme replacement therapy in murine Hurler syndrome. Mol Genet Metab 2014;111:116–122. [DOI] [PMC free article] [PubMed] [Google Scholar]
- 39.Dickson P, McEntee M, Vogler C, et al. Intrathecal enzyme replacement therapy: successful treatment of brain disease via the cerebrospinal fluid. Mol Genet Metab 2007;91:61–68. [DOI] [PMC free article] [PubMed] [Google Scholar]
- 40.Giedd JN, Rapoport JL. Structural MRI of pediatric brain development: what have we learned and where are we going? Neuron 2010;67:728–734. [DOI] [PMC free article] [PubMed] [Google Scholar]
- 41.Aleman-Gomez Y, Janssen J, Schnack H, et al. The human cerebral cortex flattens during adolescence. J Neurosci 2013;33:15004–15010. [DOI] [PMC free article] [PubMed] [Google Scholar]
- 42.Narvacan K, Treit S, Camicioli R, Martin W, Beaulieu C. Evolution of deep gray matter volume across the human lifespan. Hum Brain Mapp 2017;38:3771–3790. [DOI] [PMC free article] [PubMed] [Google Scholar]
- 43.Haber SN, Calzavara R. The cortico-basal ganglia integrative network: the role of the thalamus. Brain Res Bull 2009;78:69–74. [DOI] [PMC free article] [PubMed] [Google Scholar]
- 44.Azevedo CJ, Cen SY, Khadka S, et al. Thalamic atrophy in multiple sclerosis: A magnetic resonance imaging marker of neurodegeneration throughout disease. Ann Neurol 2018;83:223–234. [DOI] [PMC free article] [PubMed] [Google Scholar]
- 45.Chen A, Vogler C, McEntee M, et al. Glycosaminoglycan storage in neuroanatomical regions of mucopolysaccharidosis I dogs following intrathecal recombinant human iduronidase. APMIS 2011;119:513–521. [DOI] [PMC free article] [PubMed] [Google Scholar]
- 46.McAllister A, Leach J, West H, Jones B, Zhang B, Serai S. Quantitative Synthetic MRI in Children: Normative Intracranial Tissue Segmentation Values during Development. AJNR Am J Neuroradiol 2017;38:2364–2372. [DOI] [PMC free article] [PubMed] [Google Scholar]
- 47.Liddelow SA. Development of the choroid plexus and blood-CSF barrier. Front Neurosci 2015;9:32. [DOI] [PMC free article] [PubMed] [Google Scholar]
- 48.Lach B, Haust MD. Nodular lesions of choroid plexus in Hurler disease. Fetal Pediatr Pathol 2011;30:189–198. [DOI] [PubMed] [Google Scholar]
- 49.Heinen R, Bouvy WH, Mendrik AM, Viergever MA, Biessels GJ, de Bresser J. Robustness of Automated Methods for Brain Volume Measurements across Different MRI Field Strengths. PLoS One 2016;11:e0165719. [DOI] [PMC free article] [PubMed] [Google Scholar]
- 50.Malone IB, Leung KK, Clegg S, et al. Accurate automatic estimation of total intracranial volume: a nuisance variable with less nuisance. Neuroimage 2015;104:366–372. [DOI] [PMC free article] [PubMed] [Google Scholar]
Associated Data
This section collects any data citations, data availability statements, or supplementary materials included in this article.
Data Availability Statement
All data has been uploaded into the Data Management and Coordinating Center (DMCC) for the Rare Diseases Clinical Research Network (RDCRN). The DMCC is a secure clinical data management system to collect and store data on a variety of rare diseases from organizations across the United States. The data are held in the DMCC for five years after which they are released to the database of Genotypes and Phenotypes (dbGaP).