

Abstract
Objectives
To determine the association of the neutrophil-to-lymphocyte ratio (NLR) with 28-day mortality in patients with severe fever with thrombocytopenia syndrome (SFTS).
Methods
A single-centre retrospective analysis was performed in an emergency department from January 01, 2018, to June 30, 2021. Univariate and multivariable Cox proportional hazards regression models were used to investigate the prognostic factors associated with 28-day mortality. Kaplan–Meier curves were analysed in patients stratified by the optimal cut-off point of the NLR determined using a receiver operating characteristic (ROC) curve.
Results
In total, 182 SFTS patients were included, and 24 (13.2%) died within 28 days. The median age of the included patients was 59.64 ± 12.74 years, and 48.4% (88/182) were male. The patients in the non-survival group had significantly higher NLRs than those in the survival group (6.91 ± 6.73 vs. 2.23 ± 1.83). The NLR was a significant predictor of 28-day mortality (adjusted HR: 1.121, 95% CI: 1.033, 1.215). The area under the ROC curve of the NLR for predicting 28-day mortality was 0.743 (95% CI: 0.624, 0.862), and the optimal cut-off value was 4.19 (sensitivity, 54.2%; specificity, 89.2%). In addition, 28-day mortality in the patients with an NLR ≥ 4.19 was notably higher than that in the patients with an NLR < 4.19 (43.3% vs. 7.2%), and Kaplan–Meier analysis showed that the patients with an NLR ≥ 4.19 had a significantly lower survival rate than those with an NLR < 4.19.
Conclusions
The NLR was a significant, independent predictor of 28-day mortality in SFTS patients.
Supplementary Information
The online version contains supplementary material available at 10.1186/s12879-022-07206-8.
Keywords: Neutrophil-to-lymphocyte ratio, Mortality, Severe fever with thrombocytopenia syndrome
Introduction
Severe fever with thrombocytopenia syndrome (SFTS) is an emerging infectious disease worldwide characterized by fever, leukopenia, thrombocytopenia, malaise, headache, myalgia, and dizziness [1]. SFTS is caused by the SFTS virus, a newly identified bunyavirus that appears to be carried by ticks [2]. The mortality rate of SFTS patients is high because of the rapid development of multiple organ failure, and no effective therapy strategy has been established to date [1]. Therefore, the exploration of possible predictors for identifying patients with a higher risk of death due to SFTS may help guide early management strategies to improve prognosis. Recent studies have revealed that some new scoring models consisting of certain clinical parameters can be used to efficiently predict the prognosis of SFTS patients [3, 4]. However, it is difficult to obtain and evaluate the parameters in these models, and the models are excessively complicated to use in clinical practice.
The neutrophil-to-lymphocyte ratio (NLR) is a biomarker in peripheral blood that reflects systemic inflammation and immunity [5]. Recently, emerging evidence has shown that a higher NLR is associated with a higher risk of mortality in patients with acute medical conditions, such as sepsis [6], acute pancreatitis [7] and cerebral haemorrhage [8]. Nevertheless, few studies have investigated the relationship between the NLR and mortality in SFTS patients. Therefore, the aim of this study was to evaluate the association of the NLR with the prognosis in SFTS patients. We speculated that a higher NLR was a novel biomarker indicating a poor prognosis in patients with SFTS.
Method
Patients and selection criteria
This was a single-centre retrospective study that included 182 patients with SFTS treated in the Emergency Department of Nanjing Drum Tower Hospital from January 01, 2018, to June 30, 2021. The inclusion criteria included adult patients who met the diagnostic criteria for SFTS [1] and had complete clinical data. Patients were excluded if the following criteria were met: (1) age under 18 years or (2) a history of haematologic disorder. Blood samples were obtained by peripheral vein puncture from each patient during the hospital stay in the emergency department.
Data collection
The following demographic characteristics and clinical data were extracted from the electronic medical record system of our institution: (1) the baseline demographic and clinical characteristics were age, sex, coexisting conditions [hypertension (HTN), diabetes mellitus (DM), chronic obstructive pulmonary disease (COPD) and coronary artery disease (CAD)], fever, vomiting, diarrhoea, headache, abdominal pain, cough lymphadenopathy, petechiae, and Glasgow coma scale (GCS) scores), and (2) the laboratory data included the white blood cell count (WBC count, normal reference range of 3.5–9.5 × 10⁹/L), absolute neutrophil count (ANC, normal reference range of 1.6–6.3 × 10⁹/L), absolute lymphocyte count (ALC, normal reference range of 1.1–3.2 × 10⁹/L), neutrophil to lymphocyte ratio (NLR, calculated by dividing the neutrophil count by the lymphocyte count), red cell distribution width (RDW, normal reference range of 0–14%), platelet count (PLT count, normal reference range of 125–350 × 109/L), prothrombin time (PT, normal reference range of 10-15s), activated partial thromboplastin time (APTT, normal reference range of 25–31.3 s), and levels of alanine aminotransferase (ALT, normal reference range of 13–69 U/L), aspartate aminotransferase (AST, normal reference range of 15–46 U/L), lactate dehydrogenase (LDH, normal reference range of 313–618 U/L), total bilirubin (TBil, normal reference range of 5.1–28 μmol/L), direct bilirubin in serum (DBil, normal reference range of 0–10 μmol/L), serum creatinine (SCr, normal reference range or 58–110 μmol/L), and blood urea nitrogen (BUN, normal reference range of 3.2–7.1 mmol/L). Multiple organ dysfunction syndrome (MODS) was defined as progressive physiological dysfunction or failure occurring in more than two organ systems simultaneously or sequentially because of the severe medical condition (such as serious infection) [9]. The primary outcome was 28-day mortality. Moreover, we followed them up by a telephone interview if the patients were discharged within 28 days. An Excel file was used to store the clinical and laboratory data.
Statistical analysis
All the data in the present study were analysed using SPSS 22.0 for Windows (SPSS Inc., Chicago, IL, USA). Normally distributed continuous variables are presented as the mean ± standard deviation (SD) and were compared using Student’s t test. Non-normally distributed continuous data are presented as the median with interquartile range (IQR) and were compared using the Mann–Whitney U test. Categorical data are presented as frequencies and percentages and were compared using Fisher’s exact test or the chi-square test where appropriate. The associations of the WBC count, ANC, ALC and NLR with the 28-day outcome were determined using univariate and multivariable Cox regression analyses. The receiver operating characteristic (ROC) curve test was applied to evaluate the ability of the WBC count, ANC and NLR to predict the 28-day outcome, and the optimal cut-off values of the WBC count, ANC and NLR were determined by the maximum Youden index. Survival curves were estimated using the Kaplan–Meier method, and the mortality of each group of patients was compared with the log-rank test. A P value of < 0.05 was considered statistically significant.
Results
In the present study, 211 patients diagnosed with SFTS were screened for eligibility, and 182 met the inclusion criteria (Fig. 1). The median age of the SFTS patients was 59.64 ± 12.74 years, and 48.4% (88/182) were male. Overall, the 28-day mortality was 13.2% (24/182), and the length of stay in the hospital was 9.00 days (7.00, 12.00). A comparison of the baseline clinical characteristics and laboratory findings between the patients in the survival and non-survival groups is shown in Table 1. The patients in the non-survival group showed significantly higher baseline demographic and laboratory data values, including age, APTT, and levels of AST, LDH, SCr and BUN, than those in the survival group. Moreover, the proportion of MODS in the non-survival group was notably higher than that in the survival group. However, the GCS score and PLT count in the non-survival group were notably lower than those in the survival group. Moreover, the length of hospital stay in the non-survival group was also notably shorter than that in the survival group. Additionally, the patients in the survival group had a significantly lower WBC count, ANC, and NLR than those in the non-survival group (Fig. 2; Table 1). As shown in Fig. 3, the NLR in the non-survival group gradually increased after admission and reached its peak level at 14 days, whereas the NLR in the survival group peaked within 3 days after admission and then gradually decreased within 3–14 days. The NLR over 14 days was consistently higher in the non-survival group patients than in the survival group patients.
Fig. 1.

Flow chart of the study participants
Table 1.
Baseline clinical characteristics and laboratory parameters according to the 28-day outcome
| Variable | Survival (n = 158) |
Non-survival (n = 24) |
P Value |
|---|---|---|---|
| Demographics | |||
| Age, years | 58.32 ± 12.36 | 68.29 ± 12.00 | 0.001 |
| Male, sex, n (%) | 79 (50.0) | 9 (37.5) | 0.254 |
| Chronic comorbidities | |||
| HTN, n (%) | 33 (20.9) | 9 (37.5) | 0.072 |
| DM, n (%) | 9 (5.7) | 4 (16.7) | 0.052 |
| COPD, n (%) | 1 (0.6) | 1 (4.2) | 0.620 |
| CAD, n (%) | 1 (0.6) | 1 (4.2) | 0.620 |
| Clinical manifestations | |||
| Fever, n (%) | 156 (98.7) | 23 (95.8) | 0.857 |
| Vomiting, n (%) | 29 (18.4) | 7 (29.2) | 0.215 |
| Diarrhea, n (%) | 40 (25.3) | 7 (29.2) | 0.688 |
| Headache, n (%) | 56 (35.4) | 6 (25.0) | 0.315 |
| Abdominal pain, n (%) | 17 (10.8) | 1 (4.2) | 0.521 |
| Cough, n (%) | 27 (17.1) | 3 (12.5) | 0.788 |
| Lymphadenop athy, n (%) | 62 (39.2) | 6 (25.0) | 0.179 |
| Petechiae, n (%) | 22 (13.9) | 6 (25.0) | 0.161 |
| GCS scores, mean ± SD | 13.88 ± 2.12 | 9.50 ± 2.75 | 0.001 |
| Laboratory parameters | |||
| WBC count, mean ± SD, ×109/L | 3.57 ± 2.12 | 5.06 ± 3.69 | 0.014 |
| ANC, mean ± SD, ×109/L | 2.00 ± 1.71 | 4.28 ± 3.42 | 0.004 |
| ALC, mean ± SD, ×109/L | 1.14 ± 0.69 | 0.89 ± 0.66 | 0.097 |
| NLR, mean ± SD, ×109/L | 2.13 ± 1.83 | 6.91 ± 6.73 | 0.002 |
| RDW, mean ± SD, % | 13.16 ± 0.86 | 14.00 ± 2.28 | 0.087 |
| PLT count, median (IQR), ×109/L | 57.5 (37.50, 86.00) | 35.50 (25.00, 48.25) | 0.001 |
| PT, mean ± SD, s | 11.30 ± 1.02 | 12.64 ± 3.02 | 0.051 |
| APTT, mean ± SD, s | 36.60 ± 9.56 | 59.31 ± 17.09 | 0.001 |
| ALT, median (IQR), U/L | 72.05 (48.53, 121.40) | 62.00 (42.70, 85.80) | 0.241 |
| AST, median (IQR), U/L | 112.00 (66.95, 232.25) | 241.70 (129.13, 547.03) | 0.001 |
| LDH, median (IQR), U/L | 717.50 (422.5, 1221.00) | 2110.50 (1109.75, 3575.00) | 0.001 |
| TBil, median (IQR), μmol/L | 10.10 (6.95, 16.85) | 8.10 (5.90, 15.30) | 0.295 |
| DBil, median (IQR), μmol/L | 4.20 (2.55, 6.25) | 4.20 (2.45, 9.25) | 0.846 |
| SCr, mean ± SD, μmol/L | 59.78 ± 36.11 | 101.79 ± 60.35 | 0.003 |
| BUN, median (IQR), mmol/L | 3.60 (2.75, 4.70) | 5.80 (4.63, 8.46) | 0.001 |
| Complications | |||
| MODS, n (%) | 28 (17.7) | 23 (95.8) | 0.001 |
| Duration of hospital | |||
| Length of hospital stay, median (IQR) days | 10.00 (7.00,12.25) | 5.50 (2.00, 11.25) | 0.001 |
ANC absolute neutrophil count, ALC absolute lymphocyte count, AST aspartate aminotransferase, ALT alanine aminotransferase, APTT activated partial thromboplastin time, BUN blood urea nitrogen, CI confidence interval, COPD chronic obstructive pulmonary disease, CAD coronary artery disease, DBil direct bilirubin, DIC disseminated intravascular coagulation, DM diabetes mellitus, GCS glasgow coma scale, HTN hypertension, LDH lactate dehydrogenase, MODS multiple organ dysfunction syndrome, NLR neutrophil-to-lymphocyte ratio, OR odds ratio, PLT platelet, PT prothrombin time, RDW red cell volume distribution width, SCr serum creatinine, TBil total bilirubin, UA uric acid, WBC white blood cell
Fig. 2.

Comparison of the WBC count, ANC, ALC and NLR between the survival and non-survival groups (*P < 0.05). ANC absolute neutrophil count, ALC absolute lymphocyte count, NLR neutrophil-to-lymphocyte ratio, WBC white blood cell
Fig. 3.

Changes in the mean (± SE) NLR over 14 days in patients in the survival and non-survival groups. SE standard error, NLR neutrophil-to-lymphocyte ratio
The association of leukocyte counts and the NLR with the 28-day mortality in the SFTS patients was further investigated via univariate and multivariable Cox regression analyses. As shown in Table 2, our results indicated that the WBC count [adjusted hazard ratio (HR): 1.264, 95% CI: 1.030, 1.550, P = 0.025], ANC (adjusted HR: 1.385, 95% CI: 1.117, 1.717, P = 0.003) and NLR (adjusted HR: 1.121, 95% CI: 1.033, 1.215, P = 0.006) were potential predictors independently associated with the 28-day mortality after adjustment for confounders (Additional file 1: Table S1). ROC curves of the 28-day mortality of the SFTS patients generated using the independent predictors (WBC count, ANC and NLR) are plotted in Fig. 4. As shown in Table 3, the AUCs of the WBC count, ANC and NLR were 0.663 (95% CI: 0.527, 0.799, P = 0.01), 0.711 (95% CI: 0.583, 0.838, P = 0.001) and 0.743 (95% CI: 0.624, 0.862, P = 0.001), respectively. When the optimal cut-off value (maximum Youden index) was 4.19, the sensitivity and specificity of the NLR for the 28-day mortality in the SFTS patients were 0.542 and 0.892, respectively. Meanwhile, the positive likelihood ratio (LR+) was 5.034, and the negative likelihood ratio (LR−) was 0.514.
Table 2.
Independent predictors associated with the 28-day mortality in SFTS patients by univariate and multivariable Cox regression analysis
| Independent variable | Unadjusted | Adjusteda | ||
|---|---|---|---|---|
| HR (95%CI) | P Value | HR (95%CI) | P Value | |
| WBC count, ×109/L | 1.263 (1.120, 1.424) | 0.001 | 1.264 (1.030, 1.550) | 0.025 |
| ANC×109/L | 1.326 (1.181, 1.489) | 0.001 | 1.385 (1.117, 1.717) | 0.003 |
| ALC×109/L | 0.551 (0.265, 1.143) | 0.109 | 0.559 (0.230, 1.362) | 0.201 |
| NLR | 1.201 (1.134, 1.272) | 0.001 | 1.121 (1.033, 1.215) | 0.006 |
ANC absolute neutrophil count, ALC absolute lymphocyte count, CI confidence interval, HR hazard ratio, NLR neutrophil-to-lymphocyte ratio, WBC white blood cell
aAdjustment by age, sex, GCS scores, PLT count, APTT, AST, LDH, SCr, BUN
Fig. 4.
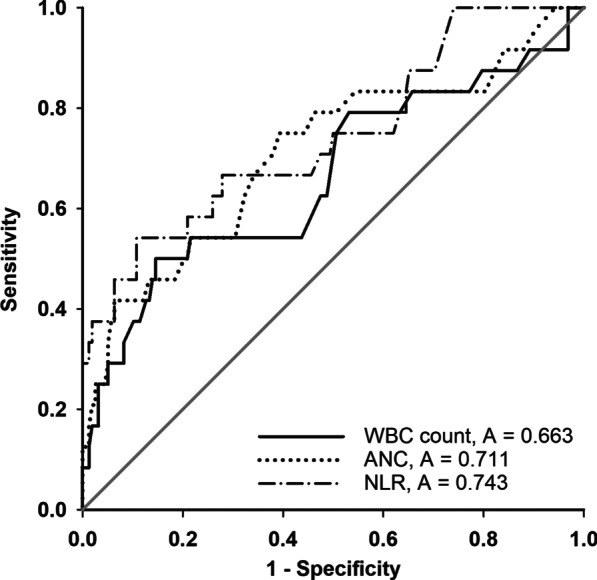
ROC curve analysis of the WBC count, ANC and NLR for 28-day mortality in SFTS patients. ANC, absolute neutrophil count; NLR, neutrophil-to-lymphocyte ratio; ROC, receiver operating characteristic; SFTS, severe fever with thrombocytopenia syndrome; WBC, white blood cell
Table 3.
Prediction analysis of WBC, ANC and NLR of the 28-day mortality
| Variable | AUC | 95%CI | Cut-off value | Sensitivity | Specificity | LR+ | LR− | P Value |
|---|---|---|---|---|---|---|---|---|
| WBC count | 0.663 | 0.527, 0.799 | 5.55 | 0.500 | 0.854 | 3.434 | 0.585 | 0.01 |
| ANC | 0.711 | 0.583, 0.838 | 1.85 | 0.750 | 0.608 | 1.911 | 0.412 | 0.001 |
| NLR | 0.743 | 0.624, 0.862 | 4.19 | 0.542 | 0.892 | 5.034 | 0.514 | 0.001 |
AUC area under curve, CI confidence interval, LR+ likelihood ratio positive, LR- likelihood ratio negative, ANC absolute neutrophil count, NLR neutrophil-to-lymphocyte ratio, WBC white blood cell, YI Youden index
To further explore the predictive value of the NLR for short-term outcomes, we divided the SFTS patients into two groups according to the optimal cut-off value of NLR = 4.19. As shown in Table 4, significant differences appeared in the GCS scores, BUN level, frequency of MODS and length of hospital stay between the two groups. Moreover, the 28-day mortality in the NLR ≥ 4.19 group was notably higher than that in the NLR < 4.19 group. Additionally, Kaplan–Meier analysis showed that the patients with an NLR ≥ 4.19 had a significantly lower chance of survival than the patients with an NLR < 4.19 (log rank P = 0.001, Fig. 5).
Table 4.
Baseline clinical characteristics and laboratory parameters by NLR < 4.19 and NLR ≥ 4.19 groups
| Variable | NLR ≥ 4.19 (n = 30) |
NLR < 4.19 (n = 152) |
P Value |
|---|---|---|---|
| Demographics | |||
| Age, years | 62.97 ± 13.43 | 58.98 ± 12.54 | 0.118 |
| Male, sex, n (%) | 17 (56.7) | 71 (46.7) | 0.319 |
| Chronic comorbidities | |||
| HTN, n (%) | 9 (30.0) | 33 (21.7) | 0.325 |
| DM, n (%) | 2 (6.7) | 11 (7.2) | 0.912 |
| COPD, n (%) | 1 (3.3) | 1 (7.0) | 0.744 |
| CAD, n (%) | 1 (3.3) | 1 (7.0) | 0.744 |
| Clinical manifestations | |||
| Fever, n (%) | 29 (96.7) | 150 (98.7) | 0.993 |
| Vomiting, n (%) | 8 (26.7) | 28 (18.4) | 0.300 |
| Diarrhea, n (%) | 5 (16.7) | 42 (27.6) | 0.210 |
| Headache, n (%) | 10 (33.3) | 52 (34.2) | 0.926 |
| Abdominal pain, n (%) | 2 (6.7) | 16 (10.5) | 0.755 |
| Cough, n (%) | 7 (23.3) | 23 (15.1) | 0.269 |
| Lymphadenopathy, n (%) | 12 (40.0) | 56 (36.8) | 0.744 |
| Petechiae, n (%) | 7 (23.3) | 21 (13.8) | 0.187 |
| GCS scores, mean ± SD | 11.76 ± 3.26 | 13.59 ± 2.43 | 0.006 |
| Laboratory parameters | |||
| RDW, mean ± SD, % | 13.23 ± 0.93 | 13.28 ± 1.22 | 0.840 |
| PLT count, median (IQR), ×109/L | 55.00 (36.00, 88.50) | 48.50 (34.00, 77.50) | 0.327 |
| PT, mean ± SD, s | 12.35 ± 2.73 | 11.30 ± 1.06 | 0.059 |
| APTT, mean ± SD, s | 43.07 ± 15.66 | 39.81 ± 12.57 | 0.121 |
| ALT, median (IQR), U/L | 62.00 (36.98, 87.60) | 73.30 (47.30, 123.50) | 0.093 |
| AST, median (IQR), U/L | 98.75 (73.90, 220.63) | 132.60 (71.7, 262.90) | 0.534 |
| LDH, median (IQR), U/L | 755.00 (548.25, 1417.25) | 747.50 (399.5,1282.25) | 0.668 |
| TBil, median (IQR), μmol/L | 10.00 (6.65, 24.45) | 10.00 (6.90,16.40) | 0.425 |
| DBil, median (IQR), μmol/L | 4.45 (2.43, 10.78) | 4.20 (2.50, 6.05) | 0.243 |
| SCr, mean ± SD, μmol/L | 80.72 ± 65.32 | 62.31 ± 35.75 | 0.144 |
| BUN, median (IQR), mmol/L | 4.70 (3.85,6.30) | 3.50 (2.70, 4.90) | 0.002 |
| Complications | |||
| MODS, n (%) | 16 (53.3) | 35 (23.0) | 0.001 |
| Duration of hospital | |||
| Length of hospital stay, median (IQR) days | |||
| Outcome | 7.00 (5.75, 12.00) | 9.50 (7.00, 12.00) | 0.047 |
| 28-day mortality, n (%) | 13 (43.3) | 11 (7.2) | 0.001 |
BUN blood urea nitrogen, COPD chronic obstructive pulmonary disease, CAD coronary artery disease, DIC disseminated intravascular coagulation, DM diabetes mellitus, GCS Glasgow coma scale, HTN hypertension, MODS multiple organ dysfunction syndrome, SCr serum creatinine, UA uric acid, RDW red cell volume distribution width, PLT platelet, APTT activated partial thromboplastin time, PT prothrombin time, AST aspartate aminotransferase, ALT alanine aminotransferase, LDH lactate dehydrogenase, TBil total bilirubin, DBil direct bilirubin
Fig. 5.
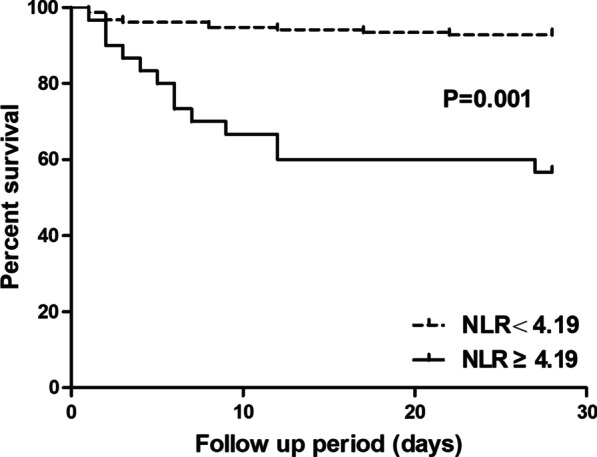
Kaplan–Meier survival curve of 28-day mortality according to the optimal cut-off of NLR = 4.19
Discussion
In the present study, the findings showed that the NLR was a significant, independent predictor of 28-day mortality in SFTS patients. Moreover, when the SFTS patients were divided into two groups based on the optimal cut-off value of NLR = 4.19, the patients with an increased NLR had a significantly lower chance of survival at 28 days. Thus, physicians should pay attention to this group of SFTS patients with an increased NLR, and management strategies are required in a timely manner to improve the outcome in these patients.
The NLR is a widely used biomarker of cellular immune activation for the assessment of severity and prognosis in various infectious and non-infectious diseases [5, 6, 10]. Moreover, the NLR may serve as a simple haematological parameter for discriminating between bacterial and viral infections since the NLR in bacterial infections is usually higher than that in viral infections [11]. The NLR improves clinicians’ understanding of systemic inflammation, the pathophysiology of the cellular immune response, and the interaction between innate and adaptive immunity as well as the clinical consequences of disease [12]. In the present study, the results showed that the SFTS patients in the non-survival group had higher neutrophil counts and lower lymphocyte counts than those in the survival group. Moreover, we also found that the patients with an increased NLR had a significantly higher incidence of MODS and a lower chance of survival within 28 days, which is consistent with the latest study by Wang X et al. [13]. Therefore, our findings further extend the evidence of the NLR as a prognostic predictor, demonstrating an increased risk of short-term mortality in SFTS patients. Of note, Wang X et al. [13] found that the NLR at discharge in surviving patients was significantly lower than that at admission, whereas the NLR at the time of death in non-surviving patients was higher than that at admission. Similar findings were demonstrated in our study: patients in the non-survival group showed gradually increasing NLRs during the hospital stay, whereas the NLR in the patients in the survival group peaked within 3 days after admission and then gradually decreased. Moreover, the NLR was consistently higher in the non-survival group patients than in the survival group patients during the hospital stay. Therefore, the dynamic change in the NLR not only reflects the improvement or deterioration in the clinical status associated with the SFTS virus infection but also helps clinicians assess the severity of disease and make treatment decisions.
Currently, the underlying mechanism between increased NLRs and increased mortality in SFTS patients remains unclear. In the early phase, the SFTS virus invades patients and triggers the release of pro-inflammatory cytokines. Then, neutrophils are dispatched to the site of inflammation, providing rapid sensing and elimination of pathogens [14]. The tempered inflammatory response is the first line of host defence against SFTS virus attack. In the progression phase, the SFTS virus itself and the provoked inflammatory response damage the immune system of the host, manifested mainly by a significant decrease in lymphocyte levels, particularly in patients with severe conditions and non-survivors [15]. In the present study, the WBC count and ANC were higher in the non-survival group than in the survival group, whereas the ALC was lower in the non-survival group than in the survival group. Taken together, these findings might explain why an increased NLR was observed in the non-survival group in our study. In addition, we also found that the SFTS patients with an increased NLR showed a significantly higher incidence of MODS, which indicated the damaged immunity status and organ function of the hosts after SFTS virus infection, which may be responsible for the worse condition and prognosis of these patients.
Several limitations should be acknowledged in our study. First, this is a retrospective, single-centre study with a small sample size. Therefore, larger-scale, better-designed studies are needed to validate our findings. Second, due to limited clinical data, we did not include clinical parameters in the Cox regression analysis that were missed in half or more of the patients; these parameters included levels of procalcitonin (PCT), C-reactive protein (CRP), D-dimer, and viral load. Thus, potential selection bias is very likely to exist, and more accurate outcomes would result from adjustments in these potential confounders. Finally, we only determined the association of increased NLRs with short-term mortality in SFTS patients. Because the prognosis of the patients could change in the long term, the predictive value of the NLR in long-term mortality should be clarified in further study.
In summary, our study demonstrates that the NLR, an inexpensive, easily available haematological parameter, is associated with 28-day mortality in SFTS patients.
Supplementary Information
Additional file 1: Table S1. Multivariate Cox regressionanalysis predicting the 28-day outcome.
Acknowledgements
Not applicable.
Authors’ contributions
CW and FH contributed to the conception and design of the study; YL and FH performed research; JN and YX performed analysis and interpretation of data; YL and FH contributed to drafting the article or revising it critically for important intellectual content; All authors final approval of the version to be submitted. All authors read and approved the final manuscript.
Funding
This study was supported by Nanjing Medical Science and technique Development Foundation, China (QRX17124).
Availability of data and materials
The datasets used and/or analyzed during the current study are available from the corresponding author on reasonable request.
Declarations
Ethics approval and consent to participate
This study was approved by the Ethics Committee of Nanjing Drum Tower Hospital (EC 2021-443). All methods were performed under relevant guidelines and regulations. Written informed consent was waived by Ethics Committee of Nanjing Drum Tower Hospital due to the anonymized retrospective nature of the study.
Consent for publication
Not applicable.
Competing interests
The authors have declared that no competing interests exist.
Footnotes
Publisher’s Note
Springer Nature remains neutral with regard to jurisdictional claims in published maps and institutional affiliations.
Yun Liu, Jun Ni and Yali Xiong contributed equally to this work
Contributor Information
Chao Wu, Email: chaowu_62@sina.com.
Fei He, Email: hefei1201@njglyy.com.
References
- 1.Seo JW, Kim D, Yun N, Kim DM. Clinical update of severe fever with thrombocytopenia syndrome. Viruses. 2021;13(7):1213. doi: 10.3390/v13071213. [DOI] [PMC free article] [PubMed] [Google Scholar]
- 2.Casel MA, Park SJ, Choi YK. Severe fever with thrombocytopenia syndrome virus: emerging novel phlebovirus and their control strategy. Exp Mol Med. 2021;53(5):713–22. doi: 10.1038/s12276-021-00610-1. [DOI] [PMC free article] [PubMed] [Google Scholar]
- 3.Wang L, Zou Z, Hou C, Liu X, Jiang F, Yu H. Score risk model for predicting severe fever with thrombocytopenia syndrome mortality. BMC Infect Dis. 2017;17(1):42. doi: 10.1186/s12879-016-2111-0. [DOI] [PMC free article] [PubMed] [Google Scholar]
- 4.Jia B, Yan X, Chen Y, Wang G, Liu Y, Xu B, et al. A scoring model for predicting prognosis of patients with severe fever with thrombocytopenia syndrome. PLoS Negl Trop Dis. 2017;11(9):e0005909. doi: 10.1371/journal.pntd.0005909. [DOI] [PMC free article] [PubMed] [Google Scholar]
- 5.Song M, Graubard BI, Rabkin CS, Engels EA. Neutrophil-to-lymphocyte ratio and mortality in the United States general population. Sci Rep. 2021;11(1):464. doi: 10.1038/s41598-020-79431-7. [DOI] [PMC free article] [PubMed] [Google Scholar]
- 6.Hwang SY, Shin TG, Jo IJ, Jeon K, Suh GY, Lee TR, et al. Neutrophil-to-lymphocyte ratio as a prognostic marker in critically-ill septic patients. Am J Emerg Med. 2017;35(2):234–39. doi: 10.1016/j.ajem.2016.10.055. [DOI] [PubMed] [Google Scholar]
- 7.Jeon TJ, Park JY. Clinical significance of the neutrophil-lymphocyte ratio as an early predictive marker for adverse outcomes in patients with acute pancreatitis. World J Gastroenterol. 2017;23(21):3883–89. doi: 10.3748/wjg.v23.i21.3883. [DOI] [PMC free article] [PubMed] [Google Scholar]
- 8.Lattanzi S, Brigo F, Trinka E, Cagnetti C, Di Napoli M, Silvestrini M. Neutrophil-to-lymphocyte ratio in acute cerebral hemorrhage: a system review. Transl Stroke Res. 2019;10(2):137–45. doi: 10.1007/s12975-018-0649-4. [DOI] [PubMed] [Google Scholar]
- 9.Ramirez M. Multiple organ dysfunction syndrome. Curr Probl Pediatr Adolesc Health Care. 2013;43(10):273–77. doi: 10.1016/j.cppeds.2013.10.003. [DOI] [PubMed] [Google Scholar]
- 10.Cupp MA, Cariolou M, Tzoulaki I, Aune D, Evangelou E, Berlanga-Taylor AJ. Neutrophil to lymphocyte ratio and cancer prognosis: an umbrella review of systematic reviews and meta-analyses of observational studies. BMC Med. 2020;18(1):360. doi: 10.1186/s12916-020-01817-1. [DOI] [PMC free article] [PubMed] [Google Scholar]
- 11.Holub M, Beran O, Kaspřikova N, Chalupa P. Neutrophil to lymphocyte count ratio as a biomarker of bacterial infections. Cent Eur J Med. 2012;7(2):258–61. doi: 10.2478/s11536-012-0002-3. [DOI] [Google Scholar]
- 12.Zahorec R. Neutrophil-to-lymphocyte ratio, past, present and future perspectives. Bratisl Lek Listy. 2021;122(7):474–88. doi: 10.4149/BLL_2021_078. [DOI] [PubMed] [Google Scholar]
- 13.Wang X, Lin L, Zhao Z, Zhou W, Ge Z, Shen Y, et al. The predictive effect of the platelet-to-lymphocyte ratio (PLR) and the neutrophil-to-lymphocyte ratio (NLR) on the risk of death in patients with severe fever with thrombocytopenia syndrome (SFTS): a multi-center study in China. Ann Transl Med. 2021;9(3):208. doi: 10.21037/atm-20-4736. [DOI] [PMC free article] [PubMed] [Google Scholar]
- 14.Zhou CM, Yu XJ. Unraveling the underlying interaction mechanism between dabie bandavirus and innate immune response. Front Immunol. 2021;12:676861. doi: 10.3389/fimmu.2021.676861. [DOI] [PMC free article] [PubMed] [Google Scholar]
- 15.Sun L, Hu Y, Niyonsaba A, Tong Q, Lu L, Li H, et al. Detection and evaluation of immunofunction of patients with severe fever with thrombocytopenia syndrome. Clin Exp Med. 2014;14(4):389–95. doi: 10.1007/s10238-013-0259-0. [DOI] [PMC free article] [PubMed] [Google Scholar]
Associated Data
This section collects any data citations, data availability statements, or supplementary materials included in this article.
Supplementary Materials
Additional file 1: Table S1. Multivariate Cox regressionanalysis predicting the 28-day outcome.
Data Availability Statement
The datasets used and/or analyzed during the current study are available from the corresponding author on reasonable request.