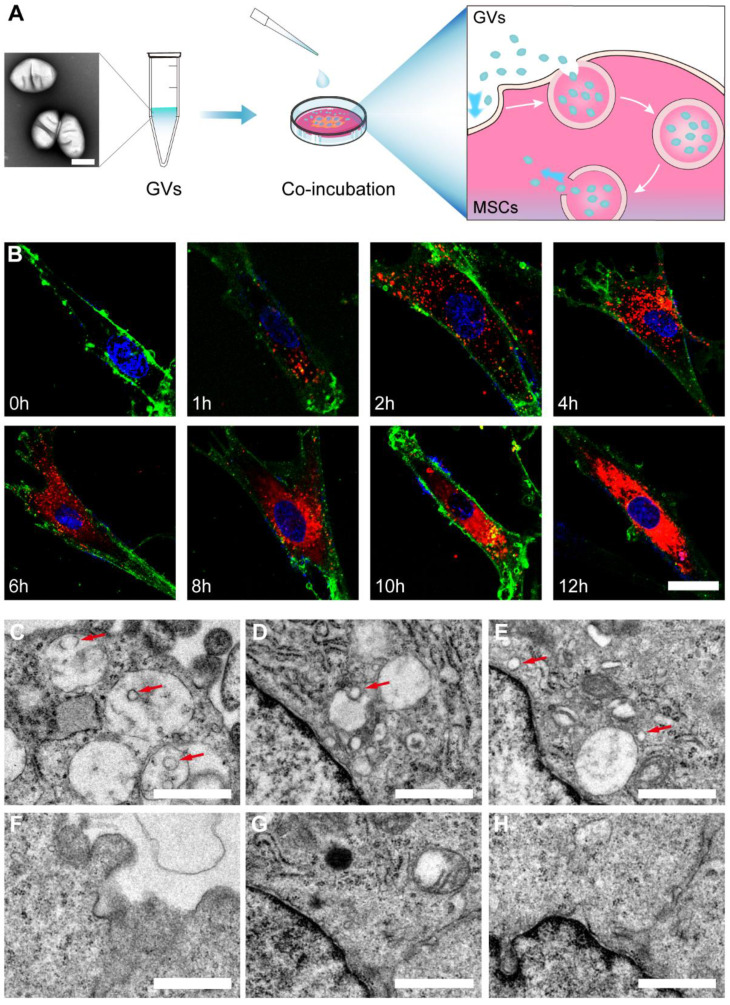
Figure 2.
The preparation and characterization of GV@MSCs. (A) Schematic illustration of GV@MSCs synthesis. (B) Confocal images showing time-dependent phagocytosis of DiI-labeled GV@MSCs by the MSCs. The nuclei were stained with DAPI (blue) and the cell membranes with FITC-conjugated wheat germ agglutinin (green). Scale bar = 3 µm. (C-H) TEM images of the GV@MSCs (C-E) and MSCs (F-E) showing the internalization of GVs into the MSCs through endosomes, followed by cytoplasmic release. Red arrows are used to indicate the GVs. Scale bar = 1 µm.

