Abstract
Socioeconomic deprivation has been linked to detrimental healthcare outcomes. We sought to examine whether patients with colorectal cancer (CRC) from socioeconomically disadvantaged areas experience worse survival outcomes and how it interacts with other factors. In this population-based study, patients with CRC diagnosed between 2007 to 2015 in the SEER program were reviewed. Socioeconomic deprivation was measured using the Area Deprivation Index (ADI) linked to patients’ residence addresses. The effect of ADI on cancer-specific survival and overall survival was evaluated using survival analysis. The Inverse Probability of Weighted (IPW) method and multiple regression was performed to account for the confounding bias. Subgroup analyses were used to test interactions. Multiple mediation analysis was used to estimate the mediating effects. Overall, 266,620 eligible patients were included in further analyses. Compared with low ADI patients, high ADI patients had more unfavorable characteristics and worse cancer-specific (hazard ratio [HR] 1.14, 95% CI 1.12-1.16, P<.001) and overall survival (HR 1.11, 95% CI 1.09-1.12, P<0.001). The results were similar after accounting for confounding factors using the IPW and multiple regression methods. Subgroup analyses revealed the relative robustness of ADI as a prognostic factor. They detected significant interactions between ADI and other covariates on cancer survival, such as age, race, insurance status, disease stage, and receipt of treatment. Multiple mediation analyses identified several factors mediating survival disparities, including anticancer therapy, insurance status, race, marital status, and age. This study suggested that high ADI CRC patients were associated with more unfavorable characteristics at presentation and lower cancer and noncancer survival after treatment than their low ADI counterparts. Multiple factors interacted and mediated these survival disparities associated with the ADI.
Keywords: Socioeconomic deprivation, neighbourhood disadvantage, area deprivation index, colorectal cancer, cancer survival, SEER program
Introduction
Colorectal cancer (CRC) is the most common gastrointestinal cancer in the United States, ranking the third in terms of cancer incidence and mortality among both sexes [1]. It is estimated that approximately 147,950 new cases of CRC and 53,200 deaths attributed to this disease will occur in 2020. Among them, 17,930 cases and 3,640 deaths will be recorded in people aged <50 years. Over the past few decades, significant progresses have been achieved in the prevention, diagnosis, and treatment of cancer. These improvements, along with early detection through screening, have led to a modest reduction in the incidence and mortality of CRC since 1990s [2,3].
However, not all patients have benefited equally from these overall improvements. In many instances, the impact of advances in oncology may vary considerably by race/ethnicity, sex, or age [2,4-11]. Previous studies have shown that non-Hispanic white males and the young may benefit more than their black, female, and elder counterparts from recent therapeutic advances, resulting in lower incidence and mortality of CRC. Reasons for the disparities in incidence and mortality are complex and not completely understood. But they largely reflect differences in lifestyle risk factors, access to healthcare driven by socioeconomic status, sex hormones, and potential complex interaction and moderation among these factors.
Socioeconomic deprivation has been linked to detrimental healthcare outcomes [12,13]. The Area Deprivation Index (ADI), a metrics of socioeconomic deprivation developed by the Health Resources & Services Administration decades earlier, has been refined and validated to the neighborhood level by Kind et al. in 2003 [14]. The ADI can rank neighborhoods by socioeconomic disadvantage comprehensively, involving factors for the theoretical components of family income, education attainment, employment, and quality of housing. The association between the ADI and health outcomes has been studied in many diseases, but not yet in patients with CRC [12,15-18]. Better understanding the relation between socioeconomic deprivation and cancer outcomes helps inform health delivery and policy. In the current study, we used population-based data to examine whether patients with CRC from socioeconomically deprived areas experience worse survival outcomes and how it interacts with other factors.
Material and methods
Study population
Research data were obtained from the Surveillance, Epidemiology, and End Results (SEER) database. The SEER database provides data on cancer incidence and survival from cancer registries, covering around 30% of the American population. This retrospective cohort study included data for CRC cases diagnosed between 2007 and 2015 when the sixth edition of the American Joint Committee on Cancer (AJCC) staging system and insurance status were accessible in the database. The main inclusion criteria were pathologically confirmed CRC and available information on age at diagnosis, race record, marital status, insurance status, area deprivation index, history of previous malignancies, disease stage, and survival data.
Area deprivation index and covariates
Data on patient sociodemographic factors, clinicopathological characteristics, treatment modality, and survival data were extracted from the SEER database directly via SEER*Stat software (version 8.3.8). The variables of interest included sex, age at diagnosis, race, marital status, insurance status, previous malignancies, histological subtypes, disease stage, receipt of anticancer treatment, and area deprivation index (ADI). Receipt of treatment was defined as receiving any course of surgery, radiotherapy, or chemotherapy. The ADI we used was a variation of Singh’s ADI, allowing for county-level estimation using different iterative data from the American Community Survey (ACS) [14,19]. We applied the get_adi() function of the “sociome” package to calculate the ADI of each patient, based on two ACS five-year estimates (2006 to 2010 and 2011 to 2015) linked to patient’s five-digit geographic identifiers [20]. Patients were classified as with low or high ADI based on overall rankings (low: 0-49.9%, high: 50.0%-100%).
Outcomes
The primary outcomes were cancer-specific survival (CSS) and overall survival (OS). The CSS was defined as the interval between the date of disease diagnosis and death attributed to CRC. The OS was defined as the interval between the date of disease diagnosis and death due to any causes. Patients who were still alive were censored at the days of the last contact.
Statistical analysis
Distributional differences between groups were examined using the χ2 test. Time-to-event data were estimated using the Kaplan-Meier curves, and differences in survival were compared using the log-rank test. Cox proportional hazard model was used to examine the relationship of ADI and survival outcomes. Covariate adjustments were made by multivariate modeling and Inverse Probability Weighting (IPW) [21]. We calculated IPWs based on propensity scores obtained from a logistic regression model with selected covariates following the formula of WATE = z/e + (1 - z)/(1 - e). The Z indicates ADI status (Z=0 for low ADI and Z=1 for high ADI), and the e is the propensity score. The average effect of ADI on survival was evaluated with IPWs in a simulative population where the selected covariates could not be confounded. Covariate balances before and after the IPW adjustment were examined using absolute Standardized Mean Differences (SMDs). SMDs are calculated using col_w_smd() function provided by “cobalt” package as follows: the numerator is the mean of the treated group minus the mean of the control group, and the denominator is a the “pooled” standard deviation (the square root of the mean of the group variances) [22]. A difference of SMD equal to zero is an ideal balance. Subgroup analyses were also done to examine the ADI effect’s robustness and explore underlying interaction effects. Finally, to evaluate whether mediation effects play roles in the survival difference between low and high ADI patients, multiple mediation analyses were used to calculate the direct and indirect effect of ADI on CRC survival. The general multiple mediation analysis method that proposed by Yu et al. enables consideration of multiple mediators/confounders in estimating mediation/confounding effects [23]. This method was further extended for time-to-event data and can be applied to explore the socioeconomic disparity in cancer survivals with the “mma” package [24]. Direct effect is the ADI disparity on cancer-specific survival that cannot be explained by all the mediators/confounders included in the model while the indirect effect the opposite.
Statistical analyses were done with R software (version 4.1.0). A 2-sided P value of <0.05 was considered statistically significant.
Results
Patient characteristics
Overall, 332,583 CRC patients diagnosed from 2007 to 2015 at the SEER program were identified. A total of 266,620 met the study’s eligibility criteria and were included in further analyses, with 131,980 classified as low ADI patients and 127,719 classified as high ADI patients (Figure 1). Of the subjects, 129,430 (48.5%) were 65 years old or older, 139,551 (52.3%) were male, and 31,050 (11.7%) were black. AJCC stages were as follows: 134,862 (50.6%) were stage I-II, and 131,758 (49.4%) were stage III-IV. A total of 249,041 patients (93.4%) had received some form of anticancer treatment, 227,363 patients (85.3%) underwent surgery, 107,081 patients (40.2%) received chemotherapy, and 38,377 patients (14.4%) received radiotherapy. Comparison of patient characteristics between low and high ADI groups is summarized in Table 1. High ADI patients were significantly associated with older age, male sex, black race, and no treatment. Low AID patients were likely to be married, insured, and without a history of previous malignancies.
Figure 1.
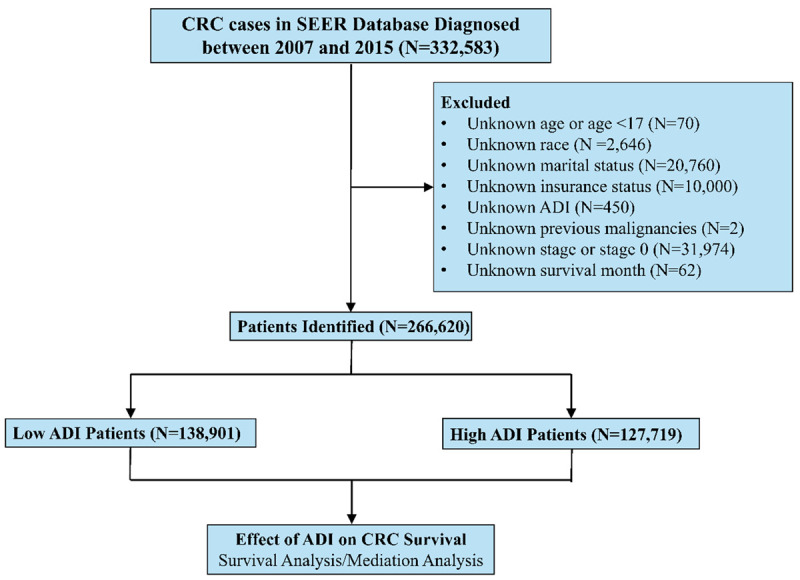
Patient selection diagram. Abbreviations: CRC, colorectal cancer; SEER: Surveillance, Epidemiology, and End Results; ADI: Area Deprivation Index.
Table 1.
Patient characteristics stratified by ADI
| Characteristics | ALL | Low ADI | High ADI | P value |
|---|---|---|---|---|
| (N=266,620) | (N=138,901) | (N=127,719) | ||
| Age (year) | <0.001 | |||
| <65 | 137190 (51.5) | 69477 (50.0) | 67713 (53.0) | |
| ≥65 | 129430 (48.5) | 69424 (50.0) | 60006 (47.0) | |
| Sex | <0.001 | |||
| Female | 127069 (47.7) | 67072 (48.3) | 59997 (47.0) | |
| Male | 139551 (52.3) | 71829 (51.7) | 67722 (53.0) | |
| Race | <0.001 | |||
| Black | 31090 (11.7) | 10266 (7.39) | 20824 (16.3) | |
| White | 212971 (79.9) | 113511 (81.7) | 99460 (77.9) | |
| Others | 22559 (8.46) | 15124 (10.9) | 7435 (5.8) | |
| Marital status | <0.001 | |||
| Married | 147025 (55.1) | 78333 (56.4) | 68692 (53.8) | |
| Unmarried or unpartnered | 119595 (44.9) | 60568 (43.6) | 59027 (46.2) | |
| Insurance status | <0.001 | |||
| Insured | 225377 (84.5) | 122380 (88.1) | 102997 (80.6) | |
| Medicaid | 32858 (12.3) | 13310 (9.6) | 19548 (15.3) | |
| Uninsured | 8385 (3.1) | 3211 (2.3) | 5174 (4.1) | |
| Previous malignancies | <0.001 | |||
| No | 216622 (81.2) | 112175 (80.8) | 104447 (81.8) | |
| Yes | 49998 (18.8) | 26726 (19.2) | 23272 (18.2) | |
| Histology | 0.237 | |||
| Adenocarcinoma | 236285 (88.6) | 123000 (88.6) | 113285 (88.7) | |
| Others | 30335 (11.4) | 15901 (11.4) | 14434 (11.3) | |
| AJCC stage | 0.404 | |||
| I-II | 134862 (50.6) | 70151 (50.5) | 64711 (50.7) | |
| III-IV | 131758 (49.4) | 68750 (49.5) | 63008 (49.3) | |
| Receipt of treatment | <0.001 | |||
| Yes | 249041 (93.4) | 130216 (93.7) | 118825 (93.0) | |
| No | 17579 (6.6) | 8685 (6.3) | 8894 (7.0) | |
| Surgery | <0.001 | |||
| Yes | 227363 (85.3%) | 118789 (85.5%) | 108574 (85.0%) | |
| No/unknown | 39257 (14.7%) | 20112 (14.5%) | 19145 (15.0%) | |
| Radiation | 0.256 | |||
| Yes | 38377 (14.4%) | 19890 (14.3%) | 18487 (14.5%) | |
| No/unknown | 228243 (85.6%) | 119011 (85.7%) | 109232 (85.5%) | |
| Chemotherapy | 0.008 | |||
| Yes | 107081 (40.2%) | 56121 (40.4%) | 50960 (39.9%) | |
| No/Unknown | 159539 (59.8%) | 82780 (59.6%) | 76759 (60.1%) |
Abbreviation: ADI, Area Deprivation Index; AJCC, American joint Committee on cancer.
Association of ADI and survival outcomes
Median follow-up in the current study was 65 months for low ADI patients and 64 months for high ADI patients, showing no significant difference. At the last follow-up, 62,170 death events (44.8%) were recorded in low ADI patients and 60,751 (47.6%) in high ADI patients. There were 33,735 (24.3%) and 34,110 (26.7%) deaths attributed to the CRC in low and high ADI patients, respectively. The Kaplan-Meier survival curves of CSS and OS for low and high ADI patients are shown in Figure 2. In crude Kaplan-Meier analysis, low ADI patients showed higher CSS rates than that of high ADI patients (8-year CSS: 67.0% [95% CI, 66.6-67.3] vs 63.5% [95% CI, 63.2-63.9]; Crude HR 1.14, 95% CI 1.12-1.16; P<0.001; Figure 2A). In terms of OS, low ADI patients showed higher OS rates than that of high ADI patients (8-year OS: 44.1% [95% CI, 43.8-44.4] vs 40.7% [95% CI, 40.3-41.0]; Crude HR 1.11, 95% CI 1.09-1.12; P<0.001; Figure 2B). We further applied IPW to adjust the potential confounding. Excellent balances between the two ADI groups were achieved regarding all covariates following IPW procedures (Figure 3). IPW-adjusted Kaplan-Meier analyses also demonstrated a significantly better CSS rate (8-year CSS: 66.2% [95% CI, 65.8-66.5] vs 64.2% [95% CI, 63.8-64.6]; IPW-adjusted HR: 1.08 [95% CI 1.06-1.09], P<0.001; Figure 2C) and OS rate (8-year CSS: 43.7% [95% CI, 43.3-44.0] vs 41.0% [95% CI, 40.7-41.4]; IPW-adjusted HR: 1.08 [95% CI 1.06-1.09], P<0.001; Figure 2D) for low ADI patients than high ADI patients. Subsequent multivariable analyses indicated that ADI was an independent prognostic factor for CSS (adjusted HR: 1.09, 95% CI 1.08-1.11; P<0.001) and OS (adjusted HR: 1.07, 95% CI 1.06-1.09; P<0.001) after covariable adjustment.
Figure 2.
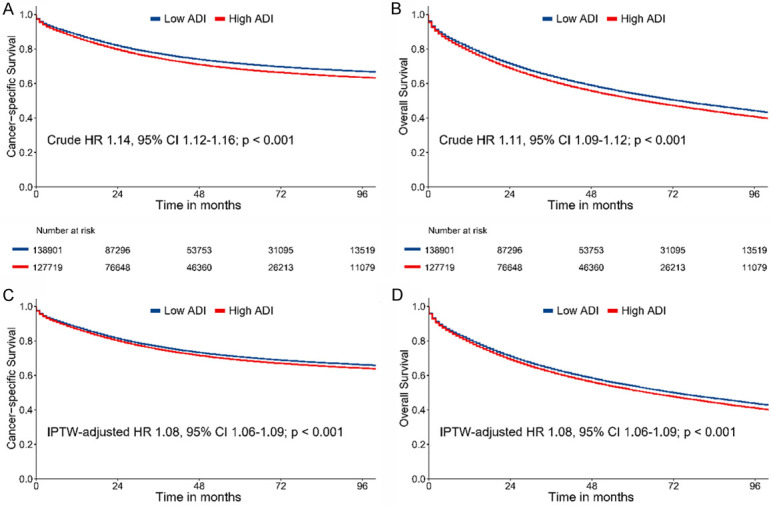
Crude Kaplan-Meier survival curves stratified by ADI for cancer-specific survival (A) and overall survival (B); IPW-adjusted Kaplan-Meier survival curves stratified by ADI for cancer-specific survival (C) and overall survival (D). Abbreviations: ADI: Area Deprivation Index; IPW: Inverse Probability of Weighting.
Figure 3.
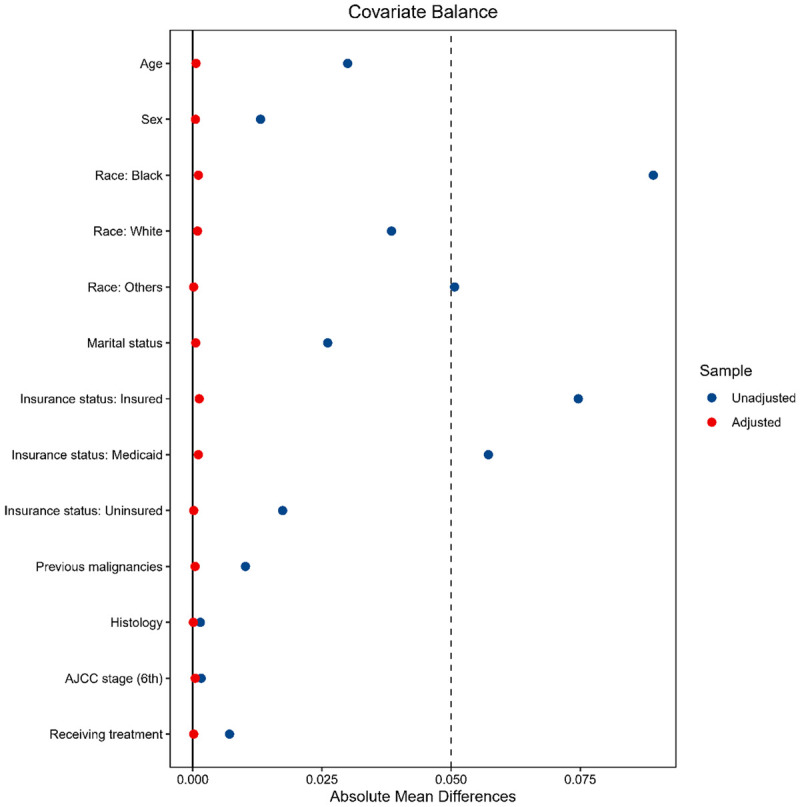
The covariate balances between the low and high ADI groups in patients with colorectal cancer are evaluated by the SMDs. SMDs are calculated as follows: the numerator is the mean of the treated group minus the mean of the control group, and the denominator is the “pooled” standard deviation (the square root of the mean of the group variances). A difference of SMD equal to zero is an ideal balance. The blue dots are SMDs for each variable before using the IPW adjustment. The red dots are SMDs for each variable after using IPW adjustment. Abbreviations: ADI: Area Deprivation Index; SMD: standardized mean difference; IPW: Inverse Probability of Weighting.
Subgroup analyses
Subgroup analyses for the association between ADI and CSS are summarized in a forest plot (Figure 4). The results showed the relative robustness of ADI as a prognostic factor in different patient subsets. Patients in the high ADI group had a significantly greater risk of cancer-specific mortality than patients in the low ADI group, except for black, uninsured, and untreated. Significant interaction effects between ADI and other covariates on CRC survival were detected, such as age, race, insurance status, disease stage, and receipt of treatment. The effect of ADI on CSS was more profound in those who were aged <65 years, non-black, insured, with early-stage disease, and with anticancer treatment.
Figure 4.
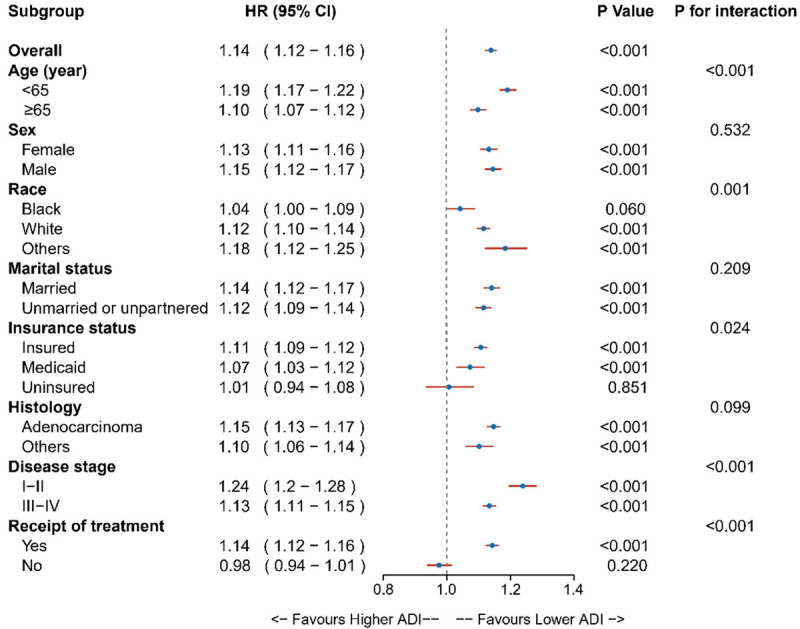
Results for the subgroup analyses for cancer-specific survival are summarized in a forest plot.
Multiple mediation analysis
The estimated direct and indirect effects that contribute to the CSS disparities between low and high ADI patients were calculated using multiple mediation analyses. The results were visualized using a bar plot with confidence intervals (Figure 5). Multiple mediation analyses showed that the estimated direct effect that mediating factors cannot explain is 54.7% (95% CI 46.6 to 63.5%). The percentage of indirect effect was 45.3% (95% CI 36.5 to 53.4%). Significant mediating factors contributed to the increased CRC mortality among high ADI patients, including receipt of anticancer treatment (26.3%), insurance status (16.5%), race (10.3%), marital status (5.3%), and age (-7.3%).
Figure 5.
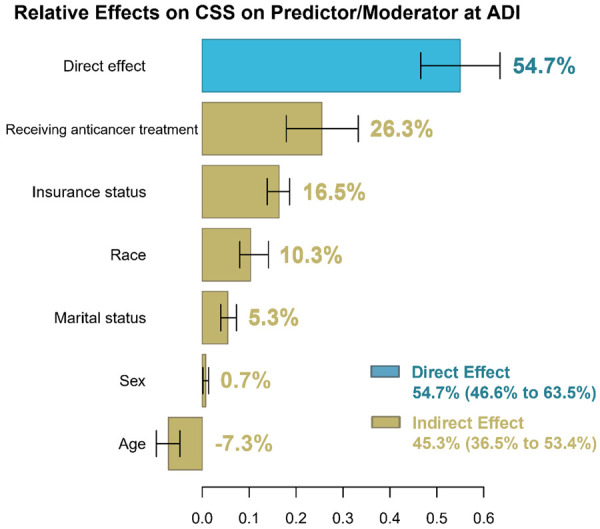
The estimation of direct and indirect effects contributing to the disparities associated with the ADI on cancer-specific survival in patients with colorectal cancer. Direct effect is the ADI disparity on cancer-specific survival that cannot be explained by all the mediators/confounders included in the model while the indirect effect is the opposite. Abbreviations: ADI: Area Deprivation Index.
Discussion
To the best of our knowledge, the current study is the first study to investigate the relationship between ADI and survival outcomes and its potential interactions with other factors in patients with CRC. In this population-based study involving more than 260,000 subjects, patients were uniformly staged by the 6th AJCC stage. High ADI patients were associated with older age, male sex, and black race. Low ADI patients were more likely to be married and insured, and received anticancer treatment. High ADI patients had lower rates of CSS and OS, even after adjusting for multiple factors. These results were consistently observed for most of patient subgroups, except for black, uninsured, and untreated people. Notably, several factors mediated these survival disparities associated with the ADI, including anticancer treatment, insurance status, race, marital status, and age, accounting for approximately 45% of the overall effect.
The association between individual socioeconomic status and survival outcomes has been well-documented in patients with CRC [2,4-11]. Unlike individual-level socioeconomic status, socioeconomic deprivation is a comprehensive metric that reflects neighborhood-disadvantage in a region of interest, involving multiple aspects of income, education, employment, housing quality, and poverty measures [14]. Previous studies of cancer registries data suggested that cancer patients living in socioeconomically disadvantaged areas have limited access to healthcare resources, resulting in more advanced disease at diagnosis and worse cancer outcomes [2,25,26]. Notably, neighborhood disadvantage can affect health independently of individual socioeconomic status. Poor people who live in highly disadvantaged communities may have worse health outcomes than poor people who live in wealthier communities [27,28].
In this study, high ADI was linked to worse cancer and noncancer survival, even though accounting for demographic, clinicopathological, individual socioeconomic status, and treatment factors. Our findings were in line with a previous study that examined the relationship between area-level socioeconomic deprivation and cancer survival outcomes in patients treated in clinical trials [12]. The study suggested that even though in cancer patients with equal opportunity to protocol-guided care participating in clinical trials, those from the most socioeconomically disadvantaged areas were associated with worse survival outcomes. The disparities were consistently observed after adequate covariate adjustment. Their findings suggested that equal access to high-quality healthcare, as represented by in the clinical trial setting, is insufficient of eliminating discrepancies associated with socioeconomic deprivation. They concluded that healthcare policies aiming at reducing socioeconomic disparities in outcomes should emphasize access to cancer care resources beyond initial treatment.
Better understanding disparities caused by socioeconomic deprivation provide valuable information on whether policies to enhance health delivery and cancer outcomes should address not just individuals but also neighborhoods. Our findings may offer some meaningful policy implications for patients with CRC. Health interventions and policies that ignore neighborhood disadvantage may be ineffectual or offer only limited benefit [13]. ADI can provide valuable information to inform risk adjustment strategies, payment reform, infrastructure targeting, and program eligibility [14]. Policymakers and payers need to take socioeconomic deprivation into account when making healthcare strategies.
There are some limitations in the current study. Although the study has accounted for many confounding factors in analyses. The SEER database did not capture some essential variables, such as individual income and education level, lifestyle risk factors (e.g., obesity, smoking, and alcohol consumption), concomitant diseases, targeted therapy, and supportive care administered during and after therapy. The potential moderation and interaction between ADI and these factors should be considered. The missing of these factors in the adjustment may overestimate the effect of ADI on CRC survival. Additionally, our findings were derived from the cancer population recorded in the SEER cancer registries. Whether the results could be generalizable to other groups outside the SEER registries warrants further investigation.
Conclusion
This study suggested that high ADI CRC patients were associated with more unfavorable characteristics at presentation and lower cancer and noncancer survival after treatment than their low ADI counterparts. Several factors mediated these survival disparities related to the ADI, including individual socioeconomic and treatment factors. Policymakers and payers need to take socioeconomic deprivation into account to maximize the efficiency and potency of healthcare strategies.
Acknowledgements
The authors would like to thank the Surveillance, Epidemiology, and End Results (SEER) program for public access to the database, and Dr Wang-Zhong Li (Department of Nasopharyngeal Carcinoma, Sun Yat-Sen University Cancer Center) for his professional guidance in statistical analyses. This study was supported by the Natural Science Foundation of China (81974386), and Central South University Xiangya Clinical Big Data Project (No. 2013-27).
Disclosure of conflict of interest
None.
References
- 1.Siegel R, Miller K, Fuchs H, Jemal A. Cancer statistics, 2021. CA Cancer J Clin. 2021;71:7–33. doi: 10.3322/caac.21654. [DOI] [PubMed] [Google Scholar]
- 2.Siegel R, Miller K, Goding Sauer A, Fedewa S, Butterly L, Anderson J, Cercek A, Smith R, Jemal A. Colorectal cancer statistics, 2020. CA Cancer J Clin. 2020;70:145–164. doi: 10.3322/caac.21601. [DOI] [PubMed] [Google Scholar]
- 3.Lin J, Perdue L, Henrikson N, Bean S, Blasi P. Screening for colorectal cancer: updated evidence report and systematic review for the US Preventive Services Task Force. JAMA. 2021;325:1978–1998. doi: 10.1001/jama.2021.4417. [DOI] [PubMed] [Google Scholar]
- 4.Wallace K, Sterba KR, Gore E, Lewin DN, Ford ME, Thomas MB, Alberg AJ. Prognostic factors in relation to racial disparity in advanced colorectal cancer survival. Clin Colorectal Cancer. 2013;12:287–293. doi: 10.1016/j.clcc.2013.08.001. [DOI] [PMC free article] [PubMed] [Google Scholar]
- 5.Patel A, Gantz O, Zagadailov P, Merchant AM. The role of socioeconomic disparity in colorectal cancer stage at presentation. Updates Surg. 2019;71:523–531. doi: 10.1007/s13304-019-00632-5. [DOI] [PubMed] [Google Scholar]
- 6.Laryea JA, Siegel E, Klimberg S. Racial disparity in colorectal cancer: the role of equal treatment. Dis Colon Rectum. 2014;57:295–302. doi: 10.1097/DCR.0000000000000056. [DOI] [PubMed] [Google Scholar]
- 7.Lansdorp-Vogelaar I, Kuntz K, Knudsen A, van Ballegooijen M, Zauber A, Jemal A. Contribution of screening and survival differences to racial disparities in colorectal cancer rates. Cancer Epidemiol Biomarkers Prev. 2012;21:728–736. doi: 10.1158/1055-9965.EPI-12-0023. [DOI] [PMC free article] [PubMed] [Google Scholar]
- 8.Du X, Fang S, Vernon S, El-Serag H, Shih Y, Davila J, Rasmus M. Racial disparities and socioeconomic status in association with survival in a large population-based cohort of elderly patients with colon cancer. Cancer. 2007;110:660–669. doi: 10.1002/cncr.22826. [DOI] [PubMed] [Google Scholar]
- 9.Doubeni C, Major J, Laiyemo A, Schootman M, Zauber A, Hollenbeck A, Sinha R, Allison J. Contribution of behavioral risk factors and obesity to socioeconomic differences in colorectal cancer incidence. J Natl Cancer Inst. 2012;104:1353–1362. doi: 10.1093/jnci/djs346. [DOI] [PMC free article] [PubMed] [Google Scholar]
- 10.Doubeni C, Laiyemo A, Major J, Schootman M, Lian M, Park Y, Graubard B, Hollenbeck A, Sinha R. Socioeconomic status and the risk of colorectal cancer: an analysis of more than a half million adults in the National Institutes of Health-AARP diet and health study. Cancer. 2012;118:3636–3644. doi: 10.1002/cncr.26677. [DOI] [PMC free article] [PubMed] [Google Scholar]
- 11.Carethers J, Doubeni C. Causes of socioeconomic disparities in colorectal cancer and intervention framework and strategies. Gastroenterology. 2020;158:354–367. doi: 10.1053/j.gastro.2019.10.029. [DOI] [PMC free article] [PubMed] [Google Scholar]
- 12.Unger J, Moseley A, Cheung C, Osarogiagbon R, Symington B, Ramsey S, Hershman D. Persistent disparity: socioeconomic deprivation and cancer outcomes in patients treated in clinical trials. J. Clin. Oncol. 2021;39:1339–1348. doi: 10.1200/JCO.20.02602. [DOI] [PMC free article] [PubMed] [Google Scholar]
- 13.Link BG, Phelan J. Social conditions as fundamental causes of disease. J Health Soc Behav. 1995:80–94. [PubMed] [Google Scholar]
- 14.Kind AJH, Buckingham WR. Making neighborhood-disadvantage metrics accessible-the neighborhood atlas. N Engl J Med. 2018;378:2456–2458. doi: 10.1056/NEJMp1802313. [DOI] [PMC free article] [PubMed] [Google Scholar]
- 15.Sheehy A, Powell W, Kaiksow F, Buckingham W, Bartels C, Birstler J, Yu M, Bykovskyi A, Shi F, Kind A. Thirty-day re-observation, chronic re-observation, and neighborhood disadvantage. Mayo Clin Proc. 2020;95:2644–2654. doi: 10.1016/j.mayocp.2020.06.059. [DOI] [PMC free article] [PubMed] [Google Scholar]
- 16.Rahman M, Meyers DJ, Wright B. Unintended consequences of observation stay use may disproportionately burden medicare beneficiaries in disadvantaged neighborhoods. Mayo Clin Proc. 2020;95:2589–2591. doi: 10.1016/j.mayocp.2020.10.014. [DOI] [PubMed] [Google Scholar]
- 17.Kind AJ, Jencks S, Brock J, Yu M, Bartels C, Ehlenbach W, Greenberg C, Smith M. Neighborhood socioeconomic disadvantage and 30-day rehospitalization: a retrospective cohort study. Ann Intern Med. 2014;161:765–774. doi: 10.7326/M13-2946. [DOI] [PMC free article] [PubMed] [Google Scholar]
- 18.Powell WR, Buckingham WR, Larson JL, Vilen L, Yu M, Salamat MS, Bendlin BB, Rissman RA, Kind AJH. Association of neighborhood-level disadvantage with alzheimer disease neuropathology. JAMA Network Open. 2020;3:e207559. doi: 10.1001/jamanetworkopen.2020.7559. [DOI] [PMC free article] [PubMed] [Google Scholar]
- 19.Singh G. Area deprivation and widening inequalities in US mortality, 1969-1998. Am J Public Health. 2003;93:1137–1143. doi: 10.2105/ajph.93.7.1137. [DOI] [PMC free article] [PubMed] [Google Scholar]
- 20.Nik K, Jarrod D, Cindy W, Adam P. https://github.com/NikKrieger/sociome. Accessed 02-15, 2022.
- 21.Austin PC, Stuart EA. Moving towards best practice when using inverse probability of treatment weighting (IPTW) using the propensity score to estimate causal treatment effects in observational studies. Stat Med. 2015;34:3661–3679. doi: 10.1002/sim.6607. [DOI] [PMC free article] [PubMed] [Google Scholar]
- 22.Greifer N. Covariate balance tables and plots: a guide to the cobalt package. Accessed March. 2020;10:2020. [Google Scholar]
- 23.Yu Q, Li B. Mma: an R package for mediation analysis with multiple mediators. J Open Res Softw. 2017;5:11. [Google Scholar]
- 24.Yu Q, Wu X, Li B, Scribner RA. Multiple mediation analysis with survival outcomes: with an application to explore racial disparity in breast cancer survival. Stat Med. 2019;38:398–412. doi: 10.1002/sim.7977. [DOI] [PMC free article] [PubMed] [Google Scholar]
- 25.Lin Y, Wimberly MC. Geographic variations of colorectal and breast cancer late-stage diagnosis and the effects of neighborhood-level factors. J Rural Health. 2017;33:146–157. doi: 10.1111/jrh.12179. [DOI] [PubMed] [Google Scholar]
- 26.Hines R, Markossian T, Johnson A, Dong F, Bayakly R. Geographic residency status and census tract socioeconomic status as determinants of colorectal cancer outcomes. Am J Public Health. 2014;104:e63–71. doi: 10.2105/AJPH.2013.301572. [DOI] [PMC free article] [PubMed] [Google Scholar]
- 27.Ludwig J, Sanbonmatsu L, Gennetian L, Adam E, Duncan G, Katz L, Kessler R, Kling J, Lindau S, Whitaker R, McDade T. Neighborhoods, obesity, and diabetes--a randomized social experiment. N Engl J Med. 2011;365:1509–1519. doi: 10.1056/NEJMsa1103216. [DOI] [PMC free article] [PubMed] [Google Scholar]
- 28.Hu J, Kind A, Nerenz D. Area deprivation index predicts readmission risk at an urban teaching hospital. Am J Med Qual. 2018;33:493–501. doi: 10.1177/1062860617753063. [DOI] [PMC free article] [PubMed] [Google Scholar]


