

SUMMARY
Objective:
To compare early hip osteoarthritis (OA) features on magnetic resonance imaging (MRI) in high-impact athletes with and without hip and/or groin pain, and to evaluate associations between early hip OA features, the International Hip Outcome Tool (iHOT33) and Copenhagen Hip and Groin Outcome Score (HAGOS).
Design:
This case-control study evaluated data of the femoroacetabular impingement and hip osteoarthritis cohort (FORCe). One hundred and eighty-two symptomatic (hip and/or groin pain >6 months and positive flexion-adduction-internal-rotation (FADIR) test) and 55 pain-free high-impact athletes (soccer or Australian football (AF)) without definite radiographic hip OA underwent hip MRI. The Scoring Hip Osteoarthritis with MRI (SHOMRI) method quantified and graded the severity of OA features. Each participant completed the iHOT33 and HAGOS.
Results:
Hip and/or groin pain was associated with higher total SHOMRI (0–96) (mean difference 1.4, 95% CI: 0.7–2.2), labral score (adjusted incidence rate ratio (aIRR) 1.33, 95% CI: 1.1–1.6). Differences in prevalence of cartilage defects, labral tears and paralabral cysts between symptomatic and pain-free participants were inconclusive. There was a lower prevalence of effusion-synovitis in symptomatic participants when compared to pain-free participants (adjusted odds ratio (aOR) 0.46 (95% CI: 0.3–0.8). Early hip OA features were not associated with iHOT33 or HAGOS.
Conclusions:
A complex and poorly understood relationship exists between hip and/or groin pain and early hip OA features present on MRI in high-impact athletes without radiographic OA. Hip and/or groin pain was associated with higher SHOMRI and labral scores.
Keywords: MRI, Hip osteoarthritis, Osteoarthritis, Hip pain
Introduction
Hip osteoarthritis (OA) is associated with substantial personal and societal burden1, with its pathogenesis involving genetic, biological, biomechanical and environmental factors1–3. Mechanical joint overload may represent one disease pathway1,4, with subtle alterations in bony anatomy (i.e., cam morphology) also related to hip OA development5–8. Repetitive high-impact physical activity (such as football) might even increase the risk for hip OA9,10, with many young adults experiencing hip-related pain with sports participation11. Once established, the radiological joint changes seen in OA are irreversible12. Identifying early disease may be important, as this may represent a point in time where interventions aimed at slowing disease progression could be effective12.
Radiographs are often used to evaluate hip OA but are insensitive to the soft-tissue findings seen in the early stages of OA10. Magnetic resonance imaging (MRI) provides superior soft-tissue contrast, enabling assessment of articular cartilage, labrum and other joint features10,13,14. Semi-quantitative MRI measures enable structured evaluation of soft-tissues involved in the pathogenesis of OA, with such approaches recommended for use in clinical studies of hip OA13. The Scoring of Hip Osteoarthritis with MRI (SHOMRI) is a reliable and valid semi-quantitative measure, which has been used to characterise and monitor the burden of hip OA15.
Little is known about hip OA features on MRI in younger people participating in high-impact physical activity who are free from radiographic OA, and who have or do not have hip and/or groin pain16. Evaluating early OA features in younger active symptomatic individuals, may aid in the understanding of early hip joint degeneration and assist in establishing the relationship between specific OA features and symptoms. The aims of this study were: 1) to compare early hip OA features on MRI between people with and without hip and/or groin pain participating in high-impact physical activity (i.e., soccer or Australian football (AF)); 2) to compare early hip OA features separately in men and women; and 3) to evaluate the relationship between early hip OA features, the International Hip Outcome Tool (iHOT33) and Copenhagen Hip and Groin Outcome Score (HAGOS) symptom and pain subscales.
Methods
Study design
This case-control study used baseline data of the femoroacetabular impingement and hip osteoarthritis cohort (FORCe). The FORCe study is an ongoing prospective study investigating changes to hip joint structures in 184 symptomatic men and women (cases) participating in high-impact physical activity (soccer or AF)17. A convenience sample of 55 pain-free men and women participating in high-impact physical activity were recruited to match the mean age and sex distribution of the 184 symptomatic participants of the FORCe study and serve as a control group. Symptomatic and control participants were participating in the same league/competition level and were recruited between August 2015 and October 2018 from sporting clubs or organisations and via online or print advertising in Melbourne and Brisbane, Australia. This study had ethics approval (La Trobe University Human Ethics Committee [HEC 15–019 and HEC 16–045] and the University of Queensland Human Ethics Committee [2015000916 & 2016001694] and all participants provided written informed consent. The Strengthening the Reporting of Observational Studies in Epidemiology (STROBE) guidelines were followed18.
Participants
The eligibility criteria for symptomatic and control participants are described in Table I. For symptomatic participants, each hip was classified as either 1) symptomatic or 2) other. The contralateral hip was classified as other if 1) no hip and/or groin was reported; or 2) hip and/or groin pain was reported but the participant had a negative FADIR test (Appendix (A), Table I). Control participants had no history of hip and/or groin pain and a negative FADIR test in both hips.
Table I.
Participant inclusion and exclusion criteria
| Symptomatic group | Control group | |
|---|---|---|
|
| ||
| Inclusion criteria | • Age: 18–50 years • Playing in a sub-elite football competition • Undertaking at least two sessions (games or training) of football (soccer/Australian football (AF)) per week • Self-reported hip (anterior/lateral/posterior) and/or groin pain which fulfilled criteria one to 3 1. Gradual onset 2. Greater than 6 months in duration 3. >3 and < 8 on an 11-point Numerical Pain Rating Scale* with football or football specific movements (squatting, kicking or cutting/change of direction) + or − symptoms including clicking, giving way, locking or catching • Positive flexion-adduction-internal-rotation (FADIR) test in at least one hip |
• Age: 18–50 years • Playing in a sub-elite football competition • Undertaking at least two sessions (games or training) of football (soccer/AF) per week • Negative FADIR test in both hips |
| Exclusion criteria | • Self-reported history of significant hip or groin condition, specifically: ○ Bursitis, congenital dislocation of the hip, fractures, osteochondritis dissecans, Legg-Calvé-Perthes disease, septic or rheumatoid arthritis, slipped capital femoral epiphysis or subluxations/dislocations • Previous hip, groin or pelvic surgery • Kellgren and Lawrence (KL) grade two or greater on anteroposterior (AP) pelvis radiograph • Any lumbar spine or lower limb injury/complaint in the previous 3 months (i.e., hamstring muscle injury or sprained ankle) that resulted in the inability to weight-bear fully or undertake testing procedures • Contra-indications to radiographs (i.e., pregnancy) or magnetic resonance imaging (MRI) (i.e., claustrophobia) • Received intra-articular hip injection (of any type) in the previous 3 months • Unable to understand spoken and written English |
• Self-reported history of hip and/or groin pain, or significant hip or groin condition (see exclusion criteria for symptomatic participants) • Past history of lower limb surgery (e.g., anterior cruciate ligament reconstruction) • KL grade two or greater on AP pelvis radiograph • Any lumbar spine or lower limb injury/complaint in the previous 3 months (e.g., hamstring muscle injury or sprained ankle) that resulted in the inability to weight-bear fully or undertake testing procedures • Contra-indications to radiographs (i.e., pregnancy) or MRI (i.e., claustrophobia) • Unable to understand spoken and written English |
Use of the numerical pain rating scale is a deviation from the original femoroacetabular impingement and hip osteoarthritis cohort study protocol (Crossley et al., 2018).
Radiographs
Each participant underwent a supine anteroposterior (AP) pelvis radiograph using a standardised protocol (Appendix (A)). Features of radiographic hip OA were evaluated using the OARSI atlas19 by a blinded registrar orthopaedic surgeon (RA) with more than 10 years’ experience reading pelvic radiographs. This resulted in a Kellgren and Lawrence (KL) classification (KL) (grade 0–4), with hip OA defined as a KL grade of 2 or greater20. Intra-observer reliability for KL classification had a kappa of 0.87 (95% CI: 0.71,1.0)21.
Magnetic resonance imaging
Each participant underwent an unenhanced 3.0 T MRI (Phillips Ingenia, The Netherlands). Participants were positioned in supine with patient positioning aids used to maintain each hip in internal rotation and neutral abduction/adduction, with a 32-channel torso coil placed over the hips and pelvis, with right and left hips imaged independently. The MRI protocol included the following sequences: coronal proton density (PD) spectral attenuated inversion recovery (SPAIR), sagittal PD SPAIR and oblique axial PD SPAIR (Appendix (A), Table II).
Table II.
Demographic characteristics, radiographic and patient reported outcome measures for symptomatic and control participants
| Symptomatic group (n = 182) | Control group (n = 55) | |
|---|---|---|
|
| ||
| Demographic characteristics | ||
| Age, y | 26.0 (23, 30) | 26.0 (23, 31) |
| Sex, % women | 20% | 25% |
| Height, m | 1.79 (1.73, 1.85) | 1.79 (1.72, 1.85) |
| Weight, kg | 77.9 (72, 86) | 78.7 (67, 89) |
| BMI, kg/m2 | 24.2 (23, 26) | 24.3 (22, 27) |
| Football code, % soccer | 50% | 55% |
| Training/competition (per week), % | ||
| 2 to 3 sessions | 89 | 82 |
| ≥4 sessions | 11 | 18 |
| Duration of symptoms, months* | 24 (18, 49) | – |
| Radiographic measures | ||
| KL grade, hips (%) | ||
| Grade 0 | 347 (96%) | 105 (95%) |
| Grade 1 | 15 (4%) | 5 (5%) |
| Patient reported outcome measures | ||
| iHOT33 | 64 (50, 74) | 98 (97, 100) |
| HAGOS–Symptoms† | 61 (51, 68) | 100 (93, 100) |
| HAGOS–Pain† | 75 (65, 83) | 100 (100, 100) |
Values are presented as %, or median (interquartile range).
181 symptomatic participants.
176 symptomatic participants/54 control participants.
SHOMRI scoring
All MRI scans were evaluated by one musculoskeletal radiologist (RS) with 8 years of experience, who was blinded to radiographic and clinical findings. The SHOMRI scoring system has been defined previously15. Briefly, eight different OA features were evaluated including: articular cartilage (graded 0–2), bone marrow edema pattern (BMEP) (graded 0–3), subchondral cysts (graded 0–2), labrum (graded 0–5), paralabral cysts (present or absent), intra-articular bodies (present or absent), effusion-synovitis (present or absent) and ligamentum teres (graded 0–3). Articular cartilage, BMEP and subchondral cysts were evaluated in six femoral and four acetabular subregions, with the labrum evaluated in four acetabular subregions15. Intra-observer reliability was determined in 20 randomly selected hips, re-read 2 weeks after the initial scoring.
OA feature scoring
For cartilage, acetabular and femoral subregions were combined, providing a total cartilage score (0–20). BMEP and subchondral cysts were evaluated in 10 subregions, with a total feature score ranging from 0 to 30 and 0 to 20, respectively. The labrum was scored in four subregions (0–20). Ligamentum teres was scored from 0 to 3. The remaining features (paralabral cysts, intra-articular bodies and effusion-synovitis) were scored as present or absent. To be consistent with previous studies22,23, the total SHOMRI score (0–96) was calculated for each hip by adding the scores for each of the eight OA features, with a higher score indicating more severe whole joint degenerative change.
Dichotomous scoring
Cartilage defects were scored as present if cartilage loss was evident in at least one acetabular or femoral subregion and were defined as: any cartilage defect (grade one or grade two) or full-thickness defect (grade two only). A labral tear was scored as present if a grade two or above finding was reported in one or more subregions. For BMEP and subchondral cysts, acetabular and femoral subregions were combined, with the feature scored as present if a grade one or above was scored in at least one subregion. Ligamentum teres tears were scored as present if a partial (grade two) or full-thickness tear (grade three) was reported. Finally, paralabral cysts, intra-articular bodies and effusion-synovitis were scored as present or absent.
Patient reported outcome measures
Demographic information (age, sex, height, weight, football code participation and training/competition frequency) was collected. Each participant completed the iHOT3324 and the HAGOS25, which are recommended patient reported outcome measures (PROM) in young to middle-aged people with hip and/ or groin conditions26.
Statistical analysis
Data analyses were performed with SPSS version 25 (SPSS Inc, Chicago, Illinois, USA) and Stata/IC 15.0 for Windows (StataCorp LC, College Station, Texas, USA). Intra-observer reliability for OA feature scores (including total SHOMRI) were determined with intra-class correlation coefficients (ICC) using a two-way mixed-effects model with absolute agreement27. Intra-observer reliability for individual OA features (dichotomous scoring) was determined with kappa and prevalence adjusted bias adjusted kappa (PABAK). The kappa statistic conveys the proportion of agreement greater than expected by chance; however, the magnitude of the kappa coefficient is affected by the prevalence of a finding and bias between observers. The PABAK adjusts for differences in prevalence of each hip OA feature and bias between observers; therefore, providing a more complete assessment of observer agreement28.
Linear regression models utilising generalised estimating equations (GEE) to account for within-person correlation between right and left hip data were used to evaluate differences in total SHOMRI score between symptom groups, with 95% confidence intervals (CI) and associated P values estimated using bootstrapping (1,000 repetitions) to account for right skew in total SHOMRI scores29. Differences between groups in individual OA feature scores (cartilage, BMEP, subchondral cysts, labral and ligamentum teres) were evaluated using negative binomial regression utilising GEE, with group differences reported as incidence rate ratios (IRR) with associated 95% CI and P-values. For the presence of individual OA features (dichotomous scoring), the prevalence of each feature was reported per hip for primary analysis, with per-person prevalence reported descriptively (Appendix (A), Table III). Differences between groups in feature prevalence were evaluated using logistic binomial regression utilising GEE, with group differences reported as odds ratios (ORs) with associated 95% CI and P-values. For the first study aim, data from men and women were pooled and analyses adjusted for sex, age and body mass index (BMI). For the second aim of the study, differences between symptom groups were estimated in men and women separately by including an interaction term between sex and symptom group in the statistical analyses described above (total SHOMRI score, individual OA feature scores and prevalence of OA features), adjusted for age and BMI.
Table III.
Intra-observer reliability of SHOMRI features (20 hips)
| % agreement | Kappa (95%CI) | PABAK (95%CI) | ICC (95%CI)‡ | |
|---|---|---|---|---|
|
| ||||
| SHOMRI feature* | ||||
| Cartilage defect any (n = 200) | 88 | 0.66 (0.54, 0.78) | 0.76 (0.67, 0.85) | 0.66 (0.28, 0.85) |
| Cartilage defect full thickness (n = 200) | 98 | −0.01 (−0.27, 0.01) | 0.96 (0.91, 1.00) | |
| BMEP (n = 200) | 100 | 0.89 (0.67, 1.00) | 0.99 (0.97, 1.00) | 0.91 (0.80, 0.97) |
| Subchondral cysts (n = 200) | 98 | 0.59 (0.22, 0.96) | 0.96 (0.92, 1.00) | 0.65 (0.30, 0.84) |
| Labral tear (n = 80) | 90 | 0.77 (0.62, 0.92) | 0.80 (0.67, 0.93) | 0.77 (0.51, 0.90) |
| Ligamentum teres tear (n = 20) | 80 | 0.60 (0.24, 0.95) | 0.60 (0.25, 0.95) | 0.61 (0.23, 0.83) |
| Paralabral cyst (n-20) | 95 | 0.89 (0.67, 1.00) | 0.90 (0.71, 1.00) | – |
| Intra-articular bodies (n = 20)† | 100 | – | – | – |
| Effusion-synovitis (n = 20) | 95 | 0.83 (0.50, 1.00) | 0.90 (0.71, 1.00) | – |
| Total SHOMRI | - | – | – | 0.84 (0.62, 0.93) |
PABAK, prevalence adjusted bias adjusted kappa.
n describes the number of subregions scored in 20 hips.
Feature not present in 20 hips assessed for reliability.
Intra-class coefficient values only used for features that provided a total score (including total SHOMRI score).
For the third aim of the study, Spearman's rank correlation was used to evaluate the relationship between individual OA feature scores (including total SHOMRI score) and hip and/or groin pain specific PROMs (iHOT33 and HAGOS symptoms and pain subscales) in football players overall with hip and/or groin pain, and in men and women with hip and/or groin pain separately. For all analyses, the total SHOMRI and individual OA features scores were taken from the most symptomatic hip, as defined by the iHOT33, with the HAGOS subscale scores applied to this hip. The absence of non-linear relationships were evaluated graphically using a locally weighted smoothing filter.
Results
Participants
A total of 539 football players with hip and/or groin pain were screened eligibility, with 182 (symptomatic group) included (Fig. 1). In two symptomatic participants, one hip was excluded due to the presence of hip OA (KL≥2), with the remaining 362 hips included for these analyses. One hundred and forty-seven asymptomatic football players were evaluated for eligibility, with 55 participants (110 hips) included in the control group (Fig. 2). Symptomatic and control participant characteristics are presented in Table II. The prevalence of KL grade one was low in both symptomatic (4%) and control (5%) participants. Symptomatic participants had a median symptom duration of 24 months (interquartile range 18–49 months).
Fig. 1.
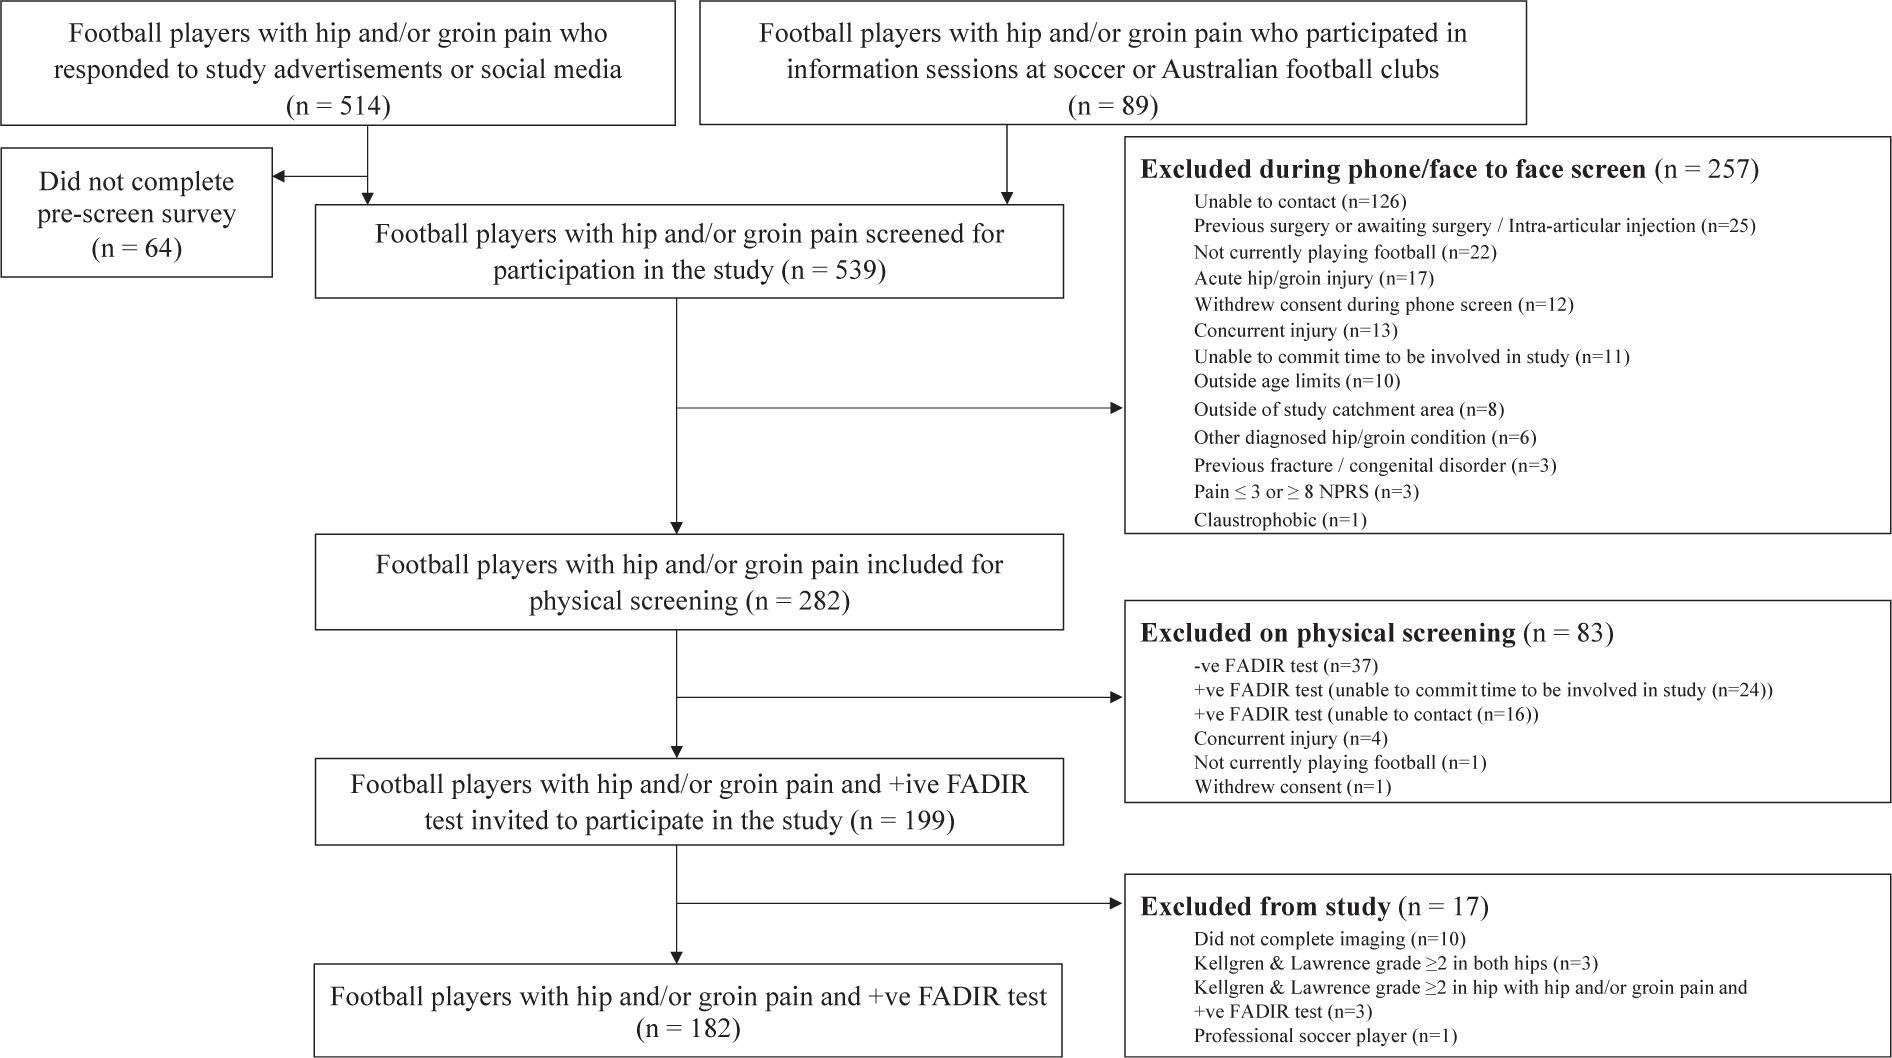
Flowchart of symptomatic participants.
Fig. 2.
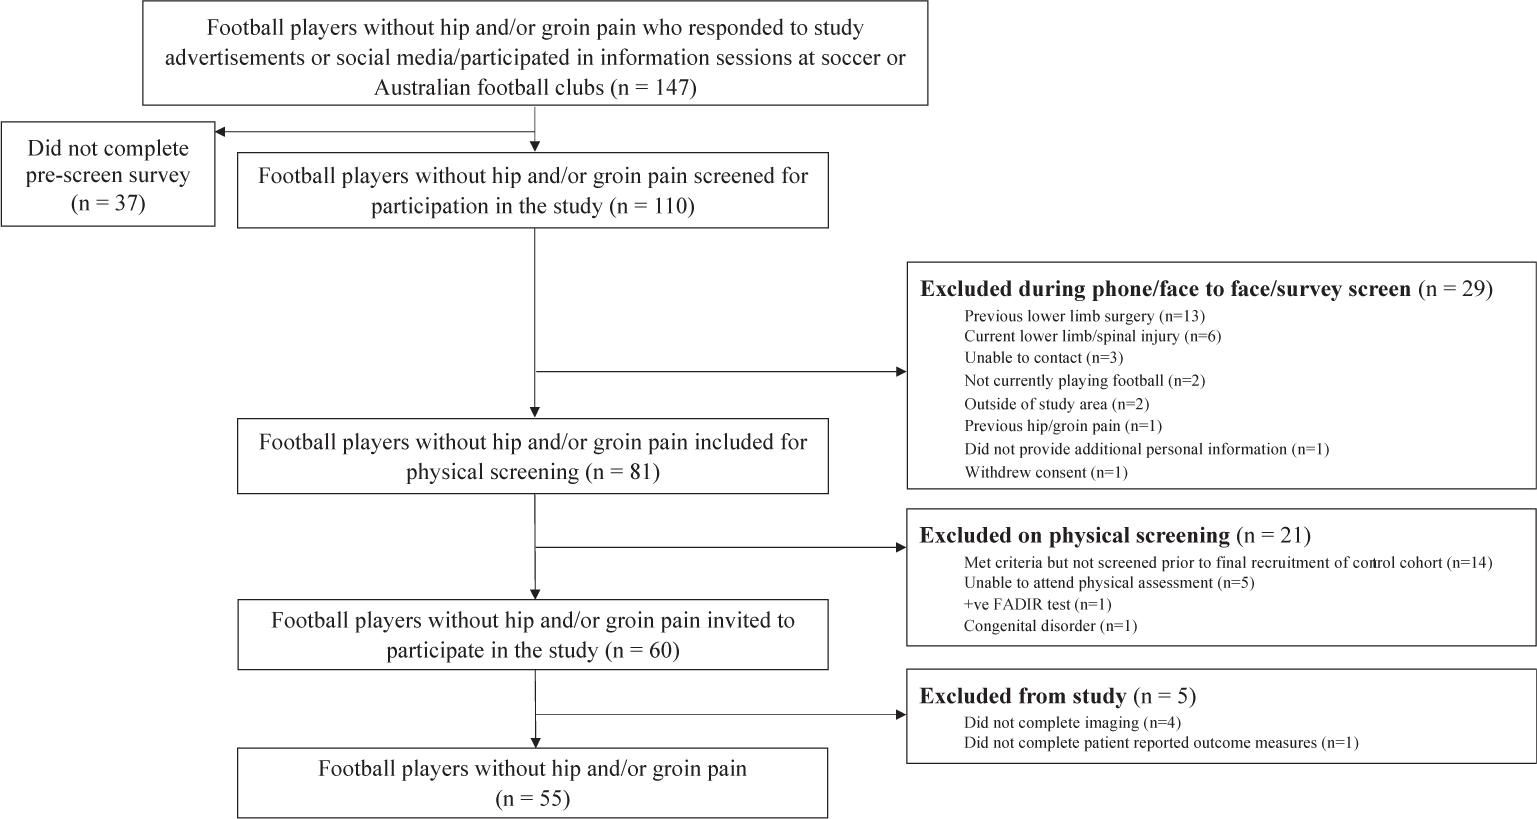
Flowchart of control participants.
Reliability
Percent agreement ranged from 80 (ligamentum teres tears) to 100% (BMEP). For OA feature scores, ICCs ranged from 0.66 to 0.91. For individual features (dichotomous scoring) kappa values ranged from -0.01 to 0.89, with PABAK 0.60 to 0.99 (Table III).
Total SHORMI score
In football players, higher total SHOMRI scores were observed in symptomatic [mean difference (MD) = 1.4 (95% CI: 0.7, 2.2)] and other [M = 1.2 (95% CI: 0.1, 2.2)] hips than in control hips (Table IV). When stratified by sex, a similar finding was observed in men, with symptomatic [M = 1.8 (95% CI: 1.0, 2.7)] and other [M = 1.7 (95% CI: 0.4, 2.9)] hips having higher total SHOMRI scores. In contrast, symptomatic [M = 0.1 95% CI: 1.0, 1.2)] and other [M = 0.4 (95% CI: 2.2,1.4)] hips had similar total SHOMRI scores to control hips in women (Table IV). Unadjusted total SHOMRI scores are presented in Appendix (A), Table IV. An interaction between sex and symptom group was found for total SHOMRI score, whereby higher scores were found in men but not women in both symptomatic and other hips when compared to control hips (Table IV).
Table IV.
Differences in total SHOMRI score between control, symptomatic and other hips
| Mean (95%CI) total SHOMRI score |
Between group comparisons |
||||
|---|---|---|---|---|---|
| Control (ref) | Symptomatic | Other | Symptomatic vs control |
Other vs control |
|
| Mean difference (95% CI)‡ | Mean difference (95% CI)‡ | ||||
|
| |||||
| All football players, hips* | 110 | 288 | 74 | ||
| Mean (95% CI) | 5.3 (4.7, 5.8) | 6.7 (6.2, 7.2) | 6.5 (5.6, 7.4) | 1.4 (0.7, 2.2) | 1.2 (0.1, 2.2) |
| Men, hips† | 82 | 229 | 59 | ||
| Mean (95%CI) | 5.4 (4.7, 6.0) | 7.2 (6.6, 7.8) | 7.0 (6.0, 8.1) | 1.8 (1.0, 2.7) | 1.7 (0.4, 2.9) |
| Women, hips† | 28 | 59 | 15 | ||
| Mean (95%CI) | 4.7 (4.1, 5.4) | 4.8 (3.8, 5.8) | 4.3 (2.6, 6.0) | 0.1 (−1.0, 1.2 | −0.4 (−2.2, 1.4) |
Football players adjusted for sex, age and BMI.
Men and women adjusted for age and BMI.
Normal based 95%CI.
Individual osteoarthritis feature scores
In all football players, results for differences in cartilage score between symptomatic, other and control hips were inconclusive (Table V). For men, higher cartilage scores were found in symptomatic [adjusted incidence rate ratio (aIRR) = 1.60 (95% CI: 1.15, 2.22)] and other hips [aIRR = 1.61 (95% CI: 1.09, 2.39)] relative to control hips. In women, differences in cartilage score between symptom groups were inconclusive (Table V).
Table V.
Differences in individual osteoarthritis (OA) feature scores between control, symptomatic and other hips
| OA feature | Mean (95%CI) OA feature score |
Incidence rate ratios (IRR) |
|||||
|---|---|---|---|---|---|---|---|
| Control (ref) | Symptomatic | Other | Symptomatic vs control |
Other vs control |
|||
| Unadjusted IRR (95%CI) | Adjusted IRR (95CI) | Unadjusted IRR (95%CI) | Adjusted IRR (95CI) | ||||
|
| |||||||
| All football players, hips* ‡ | 110 | 288 | 74 | ||||
| Cartilage | 1.0 (0.7, 1.3) | 1.4 (1.1, 1.6) | 1.3 (1.0, 1.6) | 1.38 (1.01, 1.88) | 1.34 (0.98,1.83) | 1.38 (0.95, 2.00) | 1.30 (0.89, 1.88) |
| BMEP | 0.1 (0.0, 0.1) | 0.1 (0.0, 0.1) | 0.1 (0.0, 0.2) | 1.72 (0.40, 7.44) | 1.75 (0.42, 7.26) | 1.98 (0.40, 9.73) | 1.89 (0.39, 9.30) |
| Labrum | 3.0 (2.5, 3.6) | 4.0 (3.6, 4.5) | 4.0 (3.3, 4.7) | 1.30 (1.04, 1.62) | 1.33 (1.08, 1.64) | 1.29 (1.00, 1.67) | 1.32 (1.03, 1.68) |
| Ligamentum teres | 0.5 (0.4, 0.6) | 0.6 (0.5, 0.7) | 0.6 (0.5, 0.8) | 1.19 (0.90, 1.56) | 1.20 (0.92, 1.57) | 1.26 (0.92, 1.73) | 1.26 (0.93, 1.71) |
| Men, hips † | 82 | 229 | 59 | ||||
| Cartilage | 1.0 (0.7, 1.2) | 1.5 (1.3, 1.8) | 1.6 (1.1, 2.0) | 1.50 (1.07, 2.11) | 1.60 (1.15, 2.22) | 1.56 (1.04, 2.33) | 1.61 (1.09, 2.39) |
| BMEP | 0.1 (0.0, 0.1) | 0.1 (0.0, 0.2) | 0.1 (0.0, 0.2) | 1.65 (0.31, 8.84) | 1.81 (0.36, 9.22) | 2.21 (0.37, 13.23) | 2.27 (0.38, 13.69) |
| Subchondral cysts | 0.1 (0.0, 0.2) | 0.1 (0.1, 0.2) | 0.1 (0.0, 0.3) | 1.10 (0.51, 2.41) | 1.22 (0.56, 2.65) | 1.46 (0.55, 3.87) | 1.41 (0.54, 3.70) |
| Labrum | 3.2 (2.5, 3.8) | 4.3 (3.8, 4.9) | 4.4 (3.6, 5.2) | 1.28 (1.00, 1.64) | 1.38 (1.08, 1.76) | 1.30 (0.98, 1.74) | 1.40 (1.06, 1.85) |
| Ligamentum teres | 0.5 (0.3, 0.6) | 0.6 (0.5, 0.7) | 0.6 (0.5, 0.8) | 1.24 (0.88, 1.74) | 1.28 (0.93, 1.78) | 1.29 (0.88, 1.90) | 1.31 (0.91, 1.90) |
| Women, hips† § | 28 | 59 | 15 | ||||
| Cartilage | 1.0 (0.4, 1.5) | 0.7 (0.4, 1.0) | 0.4 (0.1, 0.8) | 0.79 (0.37, 1.67) | 0.73 (0.36, 1.49) | 0.49 (0.18, 1.35) | 0.43 (0.15, 1.22) |
| Labrum | 2.5 (1.7, 3.3) | 3.0 (2.2, 3.8) | 2.6 (1.4, 3.9) | 1.30 (0.84, 2.00) | 1.19 (0.81, 1.74) | 1.11 (0.63, 1.97) | 1.05 (0.60, 1.83) |
| Ligamentum teres | 0.6 (0.3, 0.8) | 0.5 (0.4, 0.7) | 0.6 (0.4, 0.9) | 1.03 (0.66, 1.61) | 0.98 (0.61, 1.56) | 1.19 (0.70, 2.02) | 1.14 (0.66, 1.97) |
Football players adjusted for sex, age and BMI.
Men and women adjusted for age and BMI.
Subchondral cysts not analysed in football players.
Subchondral cysts and BMEP not analysed in women.
In all football players, labral scores were higher in symptomatic [aIRR = 1.33 (95% CI: 1.08,1.64)] and other hips [aIRR = 1.32 (95% CI: 1.03, 1.68)] than in control hips. A similar finding was observed in men, with higher labral scores in symptomatic [aIRR = 1.38 (95% CI: 1.08, 1.76)] and other [aIRR = 1.40 (95% CI: 1.06, 1.85)] hips when compared to control hips. In women, results for differences in labral score between symptomatic, other and control hips were inconclusive (Table V).
In all football players, differences in BMEP and ligamentum teres scores between symptomatic, other and control hips were inconclusive (Table V). For men, results for BMEP, ligamentum teres and subchondral cyst scores between symptom groups were inconclusive. For women, differences in ligamentum score between symptom groups were inconclusive (Table V).
Of the individual OA feature scores, an interaction between sex and symptom group was only found for cartilage, whereby higher scores were observed for men but not women in both symptomatic and other hips versus control hips (Table V).
Prevalence of osteoarthritis features
In all football players, and in men and women, results for differences in cartilage defect and labral tear prevalence between symptomatic, other and control hips were inconclusive (Table VI). In all football players, symptomatic [aOR = 0.46 (95% CI: 0.26, 0.81)] and other [aOR = 0.38 (95% CI: 0.18, 0.77)] hips had a lower prevalence of effusion-synovitis relative to control hips. In men, a lower prevalence of effusion-synovits was also observed in symptomatic [aOR = 0.49 (95% CI: 0.25, 0.96)] and other [aOR = 0.36 (95% CI: 0.15, 0.83)] than in control hips. For women, results for differences in effusion-synovitis prevalence between symptom groups were inconclusive (Table VI).
Table VI.
Differences in prevalence of individual osteoarthritis (OA) features (present or absent definition) between control, symptomatic and other hips
| OA feature | Number of hips with OA feature (%) |
Odds Ratios (OR) |
|||||
|---|---|---|---|---|---|---|---|
| Control (ref) |
Symptomatic |
Other |
Symptomatic vs control |
Other vs control |
|||
| Unadjusted OR (95%CI) | Adjusted OR (95CI) | Unadjusted OR (95%CI) | Adjusted OR (95CI) | ||||
|
| |||||||
| All football players, hips* ‡ | 110 | 288 | 74 | ||||
| No. of hips (%) | |||||||
| Cartilage defect (any) | 52 (47) | 144 (50) | 38 (51) | 1.13 (0.67, 1.91) | 1.12 (0.65, 1.92) | 1.15 (0.62, 2.14) | 1.11 (0.58, 2.09) |
| Labral tear | 73 (66) | 206 (72) | 54 (73) | 1.32 (0.77, 2.26) | 1.34 (0.78, 2.30) | 1.21 (0.62, 2.34) | 1.21 (0.62, 2.35) |
| Paralabral cysts | 21 (19) | 74 (26) | 12 (16) | 1.48 (0.80, 2.71) | 1.49 (0.81, 2.74) | 0.80 (0.36, 1.81) | 0.79 (0.35, 1.78) |
| Effusion-synovitis | 44 (40) | 67 (23) | 15 (20) | 0.46 (0.26, 0.81) | 0.46 (0.26, 0.81) | 0.37 (0.18, 0.75) | 0.38 (0.18, 0.77) |
|
| |||||||
| Men, hips† § | 82 | 229 | 59 | ||||
|
| |||||||
| No. of hips (%) | |||||||
| Cartilage defects (any) | 39 (48) | 125 (55) | 36 (61) | 1.38 (0.76, 2.52) | 1.49 (0.81, 2.74) | 1.51 (0.74, 3.07) | 1.55 (0.75, 3.18) |
| Subchondral cysts | 8 (10) | 24 (11) | 8 (14) | 1.12 (0.45, 2.76) | 1.29 (0.51, 3.23) | 1.36 (0.46, 4.04) | 1.30 (0.43, 3.95) |
| Labral tear | 52 (63) | 166 (73) | 46 (78) | 1.59 (0.86, 2.93) | 1.66 (0.90, 3.08) | 1.71 (0.80, 3.69) | 1.75 (0.81, 3.79) |
| Ligamentum teres tear | 4 (5) | 8 (4) | 3 (5) | 0.78 (0.18, 3.33) | 0.85 (0.22, 3.35) | 0.74 (0.13, 4.26) | 0.78 (0.14, 4.20) |
| Paralabral cysts | 17 (21) | 63 (28) | 11 (19) | 1.45 (0.74, 2.85) | 1.53 (0.78, 3.00) | 0.88 (0.37, 2.11) | 0.89 (0.37, 2.14) |
| Effusion-synovitis | 30 (37) | 52 (23) | 10 (17) | 0.51 (0.27, 0.98) | 0.49 (0.25, 0.96) | 0.36 (0.16, 0.83) | 0.36 (0.15, 0.83) |
|
| |||||||
| Women, hips† ∥ | 28 | 59 | 15 | ||||
|
| |||||||
| Cartilage defects (any) | 13 (46) | 19 (32) | 2 (13) | 0.48 (0.16, 1.45) | 0.44 (0.14, 1.32) | 0.34 (0.08, 1.43) | 0.32 (0.07, 1.35) |
| Labral tear | 21 (75) | 40 (68) | 8 (53) | 0.70 (0.22, 2.23) | 0.67 (0.21, 2.15) | 0.39 (0.10, 1.55) | 0.38 (0.10, 1.52) |
| Paralabral cysts | 4 (14) | 11 (19) | 1 (7) | 1.42 (0.36, 5.62) | 1.36 (0.34, 5.36) | 0.35 (0.03, 4.15) | 0.35 (0.03, 4.14) |
| Effusion-synovitis | 14 (50) | 15 (25) | 5 (33) | 0.36 (0.12, 1.10) | 0.37 (0.12, 1.14) | 0.42 (0.11, 1.65) | 0.43 (0.11, 1.71) |
Football players adjusted for sex, age and BMI.
Men and women adjusted for age and BMI.
Full thickness cartilage defects, BMEP, subchondral cysts, ligamentum teres tears and intra-articular loose bodies not analysed in football players.
Full thickness cartilage defects, BMEP and intra-articular loose bodies not analysed in men.
Full thickness cartilage defects, BMEP, subchondral cysts, ligamentum teres tears and intra-articular loose bodies not analysed in women.
In all football players, differences in paralabral cyst prevalence between symptomatic, other and control hips were inconclusive (Table VI). In men, differences in subchondral cyst, ligamentum teres tear and paralabral cyst prevalence between symptom groups were inconclusive. Lastly in women, differences in paralabral cyst prevalence between symptom groups were inconclusive. The prevalence of all OA features (including features not compared statistically due to low prevalence) in football players are presented in Fig. 3, with men and women presented in Appendix (A), Figs. 1 and 2.
Fig. 3. Prevalence of individual osteoarthritis (OA) features in symptomatic, other and control hips in football players.
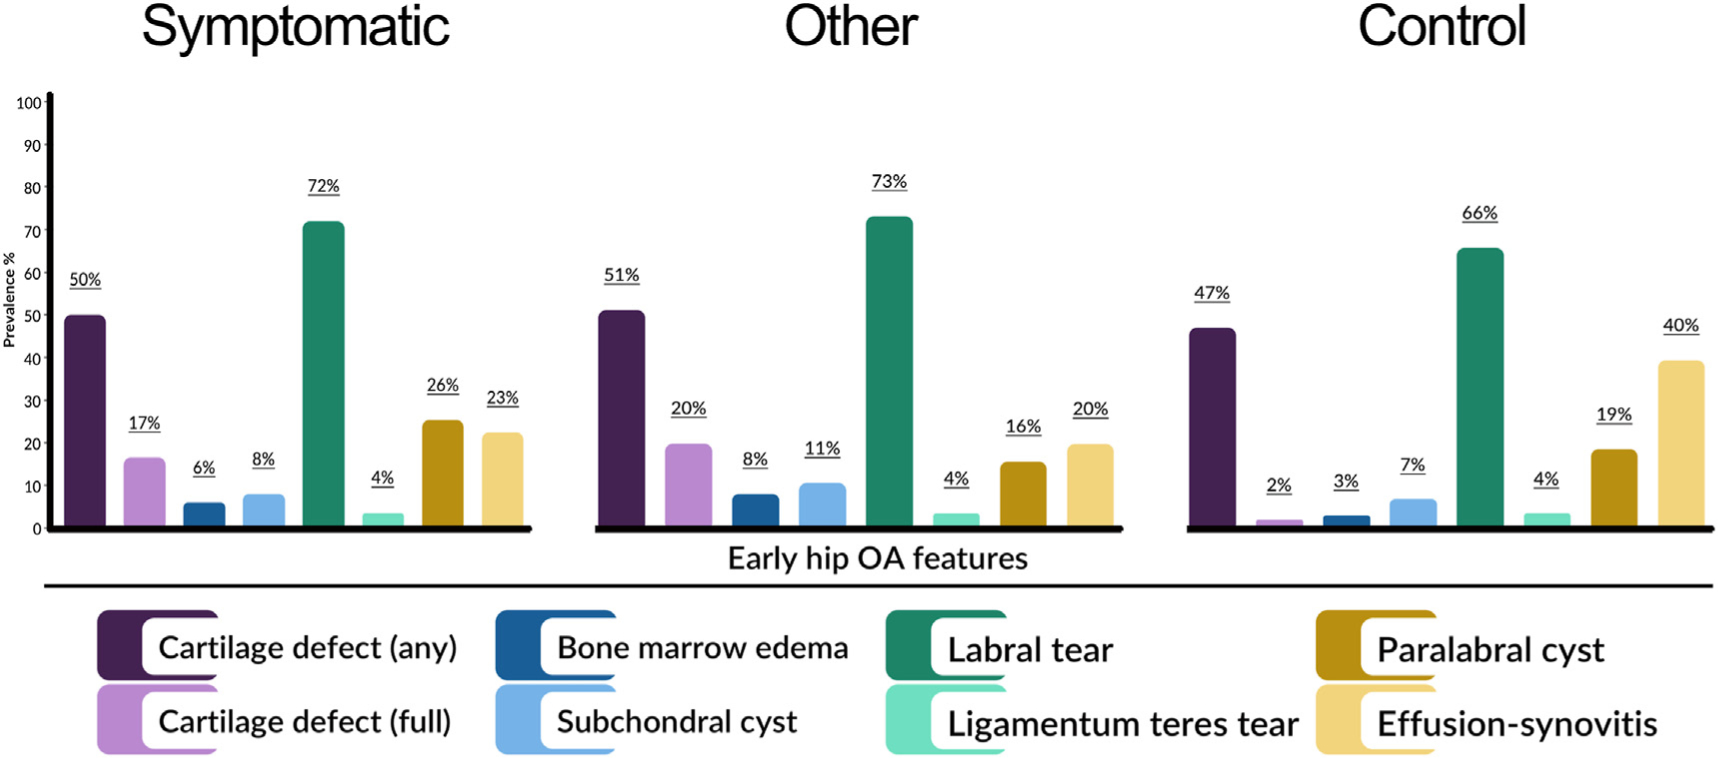
Intra-articular loose bodies not included in figure due to low prevalence in symptom groups (symptomatic 1 %, other and control hips feature absent)
No interaction was found between sex and symptom group for cartilage, labral tears, paralabral cysts or effusion-synovitis.
Correlation between Scoring of hip osteoarthritis with MRI feature Scores, International Hip Outcome Tool and Hip and Groin Outcome Score
The total SHOMRI and individual OA features scores were not associated with iHOT33 or HAGOS symptoms and pain subscale scores in all football players, or in men or women separately (Appendix (A), Table V).
Discussion
Football players frequently exhibited MRI-defined early hip OA features. The high prevalence of early hip OA features, irrespective of symptomatic status, suggests a complex and poorly understood relationship between pain and most OA features. Football players with longstanding hip and/or groin pain exhibited higher total SHOMRI, labral and cartilage scores. There was no relationship between OA feature scores (including total SHOMRI) and the iHOT33 or HAGOS.
Cartilage defects were present in 47–51% of football players hips without definite radiographic hip OA, regardless of whether they had hip and/or groin pain or not. A higher prevalence of full thickness cartilage defects was found in symptomatic hips than control hips, with more extensive cartilage damage (i.e., higher cartilage scores) present in symptomatic hips in men. Overall, there was a low prevalence of full-thickness defects in football players (17%), suggesting that this feature is unlikely to be the primary driver of nociception. The severity of cartilage damage was not associated with either the iHOT33 or HAGOS. Osteoarthritis is an active disease that affects nearly all joint tissues, with structural changes evident in articular cartilage, synovium, subchondral bone and surrounding muscles1–3,12. The discordant relationship between pain and cartilage damage is consistent with our earlier systematic review16 and the knowledge that articular cartilage is deficient of neural supply, and incapable of nociception in early disease30. Evaluation of cartilage damage with MRI is challenging due to the closely apposed and curved joint surfaces and thin layer of acetabular and femoral articular cartilage13,31. Despite this, the SHOMRI system may provide accurate grading (when compared to hip arthroscopy) of cartilage damage if performed with high resolution, unenhanced 3-T MRI, as in our study32. While the use of contrast-enhanced MRI might provide superior assessment of cartilage damage33, such approaches are not without risk12 and not appropriate in people without pain. Imaging-defined cartilage damage is associated with poor surgical outcomes34. As such, further work is needed to establish factors associated with progressive cartilage damage, and the role that altered cartilage structure plays in expediating whole joint disease.
Labral findings were observed in symptomatic (68–73%) and control (63–75%) football players. The high prevalence of incidental labral findings in pain-free football players is consistent with our earlier systematic review showing labral changes on MRI in over 50% of active individuals without pain16. In general, higher labral scores were observed in symptomatic participants. However, there was not a relationship between more extensive labral pathology and pain or symptom severity, consistent with earlier studies using semi-quantitative MRI measures15,31,35. we did not evaluate for extra-articular causes of hip and/or groin pain36. It is possible that an interrelationship may exist between labral tear severity and PROMs in football players without coexisting extra-articular conditions. High-resolution, unenhanced 3-T MRI may afford similar accuracy to contrast-enhanced approaches for the assessment of labral abnormalities37,38. Despite this, existing literature supports the use of contrast-enhanced over unenhanced MRI33,39–41. Therefore, the prevalence and/or severity of labral abnormalities may be underreported in both groups. Labral damage may increase cartilage loading42,43, possibly initiating cartilage degradation and other soft tissue changes, which may lead to the genesis of symptoms44. Our findings suggest that labral abnormalities might represent a normal anatomical variant in some, but not all people participating in high-impact sports. Further work is needed to understand if the location or severity of labral abnormalities is associated with the development of symptoms and/or progression of early hip OA. Clinical treatments that target labral tears require careful consideration as they may not be appropriate in some high-impact athletes.
We observed a low prevalence of BMEP, subchondral cysts, paralabral cysts and ligamentum teres tears. While studies in older people have described associations between BMEP, subchondral cysts and pain severity15,35, in our younger cohort of active individuals there was inconclusive evidence of a higher prevalence. Longitudinal studies are needed to establish if BMEP or subchondral cysts are associated with symptom and/or disease progression in high-impact athletes. Ligamentum teres tears can be a source of hip and/or groin pain45. We did not observe a higher prevalence of ligamentum teres tears in football players with symptoms or an association between tear severity and PROMs. Reliable and accurate grading of ligamentum teres tears is challenging with unenhanced MRI46. Therefore, we may under-report the presence and severity of ligament teres tears, and subsequently the relationship between such findings and symptoms. The role that effusion-synovitis plays in the genesis of hip symptoms and progression of joint disease is unclear. Hip and/or groin pain was associated with a lower prevalence of effusion-synovitis in all football players, men and women. Our findings are consistent with prior work using unenhanced MRI15,47, but differ to those observed in female ballet dancers47. By using unenhanced MRI we could not differentiate effusion from synovitis48,49. As such, a relationship may exist between either feature (effusion or synovitis) and symptoms. The SHOMRI has a crude scoring (present or absent), meaning we were unable to determine if the size of effusion-synovitis was associated with symptoms. Further work is required to understand the role that the presence and/or size of effusion-synovitis plays in the pathogenesis of hip OA, in particular the progression of cartilage degradation.
In football players and men without definitive radiographic hip OA, longstanding hip and/or groin pain was associated with higher total SHOMRI scores, indicating a greater number and/or severity of MRI hip OA features, than pain-free controls. However, total SHOMRI scores were not associated with the iHOT33 or HAGOS, suggesting that more extensive ‘whole joint’ disease may be associated with the presence, but not the level of pain or symptoms. The similarity in SHOMRI scores with those of older individuals22, suggests that early hip joint disease may be evident in young high-impact athletes. The SHOMRI score has been used as a measure of whole joint disease23; however, the relative importance of each specific OA feature remains unknown. Future studies may investigate if specific SHOMRI profiles exist in people who display symptom and/or disease progression.
Our finding of no substantive relationship between the severity of hip OA features and PROMs may be influenced by the reliability of the SHOMRI measure. Intra-observer reliability values were good to excellent for most OA features. For select features (cartilage, ligamentum teres and subchondral cysts) we found only modest reliability (0.61–0.66). Therefore, we may under or over-report the extent of early hip OA and subsequently the relationship between certain features and symptoms. Although recommended for people with hip and/or groin conditions, the construct and content validity of the iHOT33 and HAGOS is still to be clarified50. A relationship may exist between hip OA features and PROMs that measure different dimensions (e.g., intensity and unpleasantness) of hip and/or groin pain and/or symptoms.
An interaction between sex and hip and/or groin symptoms was only evident for total SHOMRI and cartilage score, whereby higher scores were seen in symptomatic and other hips relative to control hips in men, but not women. Future studies evaluating the relationship between symptoms and features of early hip OA should consider our findings.
We recognise that there are number of limitations that require consideration when interpreting our findings. First, hip and/or groin pain can originate from pathologies present in bony and musculotendinous structures around the hip joint, as well the lumbar spine and pelvis51. Symptomatic participants were not evaluated for other clinical entities observed in high-impact athletes36, meaning such conditions may have contributed the generation of symptoms. The FADIR test is sensitive but not specific for intra-articular hip conditions52, which prevents us from concluding that hip and/groin symptoms were being generated from intra-articular hip pathologies alone. The SHOMRI scoring was completed by a single trained musculoskeletal radiologist and we did not establish inter-observer reliability. Our cohort consisted of soccer and AF players, and not those participating in other high-impact physical activities (e.g., ice hockey and handball). This should be considered when generalising our findings to other groups of athletes. Nonetheless, the high prevalence of OA features on MRI observed in our cohort is comparable to earlier studies of other high-impact athletes53–55, suggesting that high-impact athletes exhibit MRI-defined OA features to a similar extent. Unenhanced MRI provides variable accuracy relative to contrast-enhanced approaches for both cartilage and non-osteochondral features (labrum, ligamentum teres and synovium)33,40,46,49. We used an optimised 3-T MRI protocol which increases confidence in our findings, as such approaches have comparable accuracy to contrast-enhanced MRI37,56. Further, the SHOMRI scoring system has demonstrated precision for identification of cartilage and labral conditions when compared to hip arthroscopy32. We have previously reported the prevalence of bony morphology in our cohort of football players21. The relationship between bony morphology and early hip OA is still to be established in active high-impact athletes and will be the focus of future studies. The present case-control study precludes assumptions about causal relationships between OA features present on MRI and hip and/or groin pain.
Conclusion
Early hip OA features on MRI were prevalent in a high number of football players without radiographic OA. Our findings suggest a complex relationship between self-reported symptoms and most hip OA features observed on MRI. Hip and/or groin pain was associated with more extensive cartilage loss and higher total SHOMRI and labral scores. Labral findings were present in over 60% of football players with and without pain, questioning the clinical relevance of this specific feature. Further work is required to establish the natural history of early hip OA features and the identification of factors associated with the progression of structural disease in high-impact athletes.
Supplementary Material
Acknowledgements
The authors would like to thank the staff at Imaging at Olympic Park and Qscan radiology clinics, as well as the study participants, who all assisted in the collection of data for this study. JH, MK, MS are supported by the La Trobe University Postgraduate Research Scholarship. KJC is supported in part by funding from the National Health and Medical Research Council (NHMRC) project grant (GNT1088683).
Role of funding source
The study was supported by an Australian National Health and Medical Research Council (NHMRC) project grant (GNT1088683). The funding body did not have a role in study design, collection, analysis and interpretation of data, writing of the manuscript or decision to submit the manuscript for publication.
Footnotes
Competing interests
The authors declare they have no competing interests.
Supplementary data
Supplementary data to this article can be found online at https://doi.org/10.1016/j.joca.2020.12.013.
References
- 1.Hunter DJ, Bierma-Zeinstra S. Osteoarthritis. Lancet 2019;393(10182):1745–59, 10.1016/S0140-6736(19)30417-9. [DOI] [PubMed] [Google Scholar]
- 2.Glyn-Jones S, Palmer AJR, Agricola R, et al. Osteoarthritis. Lancet 2015;386(9991):376–87, 10.1016/S0140-6736(14)60802-3. [DOI] [PubMed] [Google Scholar]
- 3.Prieto-Alhambra D, Judge A, Javaid MK, Cooper C, Diez-Perez A, Arden NK. Incidence and risk factors for clinically diagnosed knee, hip and hand osteoarthritis: influences of age, gender and osteoarthritis affecting other joints. Ann Rheum Dis 2014;73(9):1659–64, 10.1136/annrheumdis-2013-203355. [DOI] [PMC free article] [PubMed] [Google Scholar]
- 4.Deveza LA, Loeser RF. Is osteoarthritis one disease or a collection of many? Rheumatology 2018;57(Suppl l_4): iv34–42, 10.1093/rheumatology/kex417. [DOI] [PMC free article] [PubMed] [Google Scholar]
- 5.Wright AA, Naze GS, Kavchak AE, Paul D, Kenison B, Hegedus EJ. Radiological variables associated with progression of femoroacetabular impingement of the hip: a systematic review. J Sci Med Sport 2015;18(2):122–7, 10.1016/j.jsams.2014.03.004. [DOI] [PubMed] [Google Scholar]
- 6.Kowalczuk M, Yeung M, Simunovic N, Ayeni OR. Does femoroacetabular impingement contribute to the development of hip osteoarthritis? A systematic review. Sports Med Arthrosc Rev 2015;23(4):174–9, 10.1097/JSA.0000000000000091. [DOI] [PubMed] [Google Scholar]
- 7.Saberi Hosnijeh F, Zuiderwijk ME, Versteeg M, et al. Cam deformity and acetabular dysplasia as risk factors for hip osteoarthritis. Arthritis Rheum 2017;69(1):86–93, 10.1002/art.39929. [DOI] [PubMed] [Google Scholar]
- 8.Shapira J, Chen JW, Bheem R, et al. Radiographic factors associated with hip osteoarthritis: a systematic review. J Hip Preserv Surg 2020;7(1):4–13, 10.1093/jhps/hnz073. [DOI] [PMC free article] [PubMed] [Google Scholar]
- 9.Vigdorchik JM, Nepple JJ, Eftekhary N, Leunig M, Clohisy JC. What Is the association of elite sporting activities with the development of hip osteoarthritis? Am J Sports Med 2017;45(4):961–4, 10.1177/0363546516656359. [DOI] [PubMed] [Google Scholar]
- 10.Siebelt M, Agricola R, Weinans H, Kim YJ. The role of imaging in early hip OA. Osteoarthritis Cartilage 2014;22(10):1470–80, 10.1016/j.joca.2014.04.030. [DOI] [PubMed] [Google Scholar]
- 11.Rankin AT, Bleakley CM, Cullen M. Hip joint pathology as a leading cause of groin pain in the sporting population:a 6-year review of 894 cases. Am J Sports Med 2015;43(7):1698–703, 10.1177/0363546515582031. [DOI] [PubMed] [Google Scholar]
- 12.Pollard TC, Gwilym SE, Carr AJ. The assessment of early osteoarthritis. J Bone Joint Surg Br 2008;90(4):411–21, 10.1302/0301-620x.90b4.20284. [DOI] [PubMed] [Google Scholar]
- 13.Gold GE, Cicuttini F, Crema MD, et al. OARSI clinical trials recommendations: hip imaging in clinical trials in osteoarthritis. Osteoarthritis Cartilage 2015;23(5):716–31, 10.1016/j.joca.2015.03.004. [DOI] [PMC free article] [PubMed] [Google Scholar]
- 14.Crema MD, Watts GJ, Guermazi A, Kim Y-J, Kijowski R, Roemer FW. A narrative overview of the current status of MRI of the hip and its relevance for osteoarthritis research e what we know, what has changed and where are we going? Osteoarthritis Cartilage 2017;25(1):1–13, 10.1016/j.joca.2016.08.015. [DOI] [PubMed] [Google Scholar]
- 15.Lee S, Nardo L, Kumar D, et al. Scoring hip osteoarthritis with MRI (SHOMRI): a whole joint osteoarthritis evaluation system. J Magn Reson Imag 2015;41(6):1549–57, 10.1002/jmri.24722. [DOI] [PMC free article] [PubMed] [Google Scholar]
- 16.Heerey JJ, Kemp JL, Mosler AB, et al. What is the prevalence of hip intra-articular pathologies and osteoarthritis in active athletes with hip and groin pain compared with those without? A systematic review and meta-analysis. Sports Med 2019;49(6):951–72, 10.1007/s40279-019-01092-y. [DOI] [PubMed] [Google Scholar]
- 17.Crossley KM, Pandy MG, Majumdar S, et al. Femoroacetabular impingement and hip OsteoaRthritis Cohort (FORCe): protocol for a prospective study. J Physiother 2018;64(1):55, 10.1016/j.jphys.2017.10.004. [DOI] [PubMed] [Google Scholar]
- 18.Vandenbroucke JP, von Elm E, Altman DG, et al. Strengthening the reporting of observational studies in Epidemiology (STROBE): explanation and elaboration. Epidemiology 2007;18(6): 805–35, 10.1097/EDE.0b013e3181577511. [DOI] [PubMed] [Google Scholar]
- 19.Altman RD, Gold GE. Atlas of individual radiographic features in osteoarthritis, revised. Osteoarthritis Cartilage 2007;15: A1–A56, 10.1016/j.joca.2006.11.009. [DOI] [PubMed] [Google Scholar]
- 20.Kellgren JH, Lawrence JS. Radiological assessment of osteoarthrosis. Ann Rheum Dis 1957;16(4):494–502, 10.1136/ard.16.4.494. [DOI] [PMC free article] [PubMed] [Google Scholar]
- 21.Heerey J, Agricola R, Smith A, et al. The size and prevalence of bony hip morphology does not differ between football players with and without hip and/or groin pain: findings from the FORCe cohort. J Orthop Sports Phys Ther 2020, 10.2519/jospt.2021.9622. Epub 25 Dec. [DOI] [PubMed] [Google Scholar]
- 22.Schwaiger BJ, Gersing AS, Lee S, et al. Longitudinal assessment of MRI in hip osteoarthritis using SHOMRI and correlation with clinical progression. Semin Arthritis Rheum 2016;45(6): 648–55, 10.1016/j.semarthrit.2016.04.001. [DOI] [PMC free article] [PubMed] [Google Scholar]
- 23.Grace T, Neumann J, Samaan MA, et al. Using the scoring hip osteoarthritis with magnetic resonance imaging (SHOMRI) system to assess intra-articular pathology in femoroacetabular impingement. J Orthop Res 2018;36(11):3064–70, 10.1002/jor.24102. [DOI] [PMC free article] [PubMed] [Google Scholar]
- 24.Mohtadi NGH, Griffin DR, Pedersen ME, et al. The development and validation of a self-administered quality-of-life outcome measure for young, active patients with symptomatic hip disease: the International Hip Outcome Tool (iHOT-33). Arthroscopy 2012;28(5):595–610, 10.1016/j.arthro.2012.03.013. e1. [DOI] [PubMed] [Google Scholar]
- 25.Thorborg K, Hölmich P, Christensen R, Petersen J, Roos EM The copenhagen hip and groin outcome score (HAGOS): development and validation according to the COSMIN checklist. Br J Sports Med 2011;45(6):478, 10.1136/bjsm.2010.080937. [DOI] [PubMed] [Google Scholar]
- 26.Thorborg K, Tijssen M, Habets B, et al. Patient-Reported Outcome (PRO) questionnaires for young to middle-aged adults with hip and groin disability: a systematic review of the clinimetric evidence. Br J Sports Med 2015;49(12):812, 10.1136/bjsports-2014-094224. [DOI] [PubMed] [Google Scholar]
- 27.Shrout PE, Fleiss JL. Intraclass correlations: uses in assessing rater reliability. Psychol Bull 1979;86(2):420–8. [DOI] [PubMed] [Google Scholar]
- 28.Byrt T, Bishop J, Carlin JB. Bias, prevalence and kappa. J Clin Epidemiol 1993;46(5):423–9, 10.1016/0895-4356(93)90018-V. [DOI] [PubMed] [Google Scholar]
- 29.Bland JM, Altman DG. Statistics notes: bootstrap resampling methods. BMJ 2015;350:h2622, 10.1136/bmj.h2622. [DOI] [PubMed] [Google Scholar]
- 30.Hunter DJ, Guermazi A, Roemer F, Zhang Y, Neogi T. Structural correlates of pain in joints with osteoarthritis. Osteoarthritis Cartilage 2013;21(9):1170–8, 10.1016/j.joca.2013.05.017. [DOI] [PubMed] [Google Scholar]
- 31.Roemer FW, Hunter DJ, Winterstein A, et al. Hip Osteoarthritis MRI Scoring System (HOAMS): reliability and associations with radiographic and clinical findings. Osteoarthritis Cartilage 2011;19(8):946–62, 10.1016/j.joca.2011.04.003. [DOI] [PubMed] [Google Scholar]
- 32.Neumann J, Zhang AL, Schwaiger BJ, et al. Validation of scoring hip osteoarthritis with MRI (SHOMRI) scores using hip arthroscopy as a standard of reference. Eur Radiol 2019;29(2): 578–87, 10.1007/s00330-018-5623-8. [DOI] [PMC free article] [PubMed] [Google Scholar]
- 33.Saied AM, Redant C, El-Batouty M, et al. Accuracy of magnetic resonance studies in the detection of chondral and labral lesions in femoroacetabular impingement: systematic review and meta-analysis. BMC Muscoskel Disord 2017;18:83, 10.1186/s12891-017-1443-2. [DOI] [PMC free article] [PubMed] [Google Scholar]
- 34.Hanke MS, Steppacher SD, Anwander H, Werlen S, Siebenrock KA, Tannast M. What MRI findings predict failure 10 years after surgery for femoroacetabular impingement? Clin Orthop Relat Res 2017;475(4):1192–207, 10.1007/s11999-016-5040-8. [DOI] [PMC free article] [PubMed] [Google Scholar]
- 35.Kumar D, Wyatt CR, Lee S, et al. Association of cartilage defects, and other MRI findings with pain and function in individuals with mild-moderate radiographic hip osteoarthritis and controls. Osteoarthritis Cartilage 2013;21(11):1685–92, 10.1016/j.joca.2013.08.009. [DOI] [PMC free article] [PubMed] [Google Scholar]
- 36.Weir A, Brukner P, Delahunt E, et al. Doha agreement meeting on terminology and definitions in groin pain in athletes. Br J Sports Med 2015;49(12):768–74, 10.1136/bjsports-2015-094869. [DOI] [PMC free article] [PubMed] [Google Scholar]
- 37.Linda DD, Naraghi A, Murnaghan L, Whelan D, White LM. Accuracy of non-arthrographic 3T MR imaging in evaluation of intra-articular pathology of the hip in femoroacetabular impingement. Skeletal Radiol 2017;46(3): 299–308, 10.1007/s00256-016-2551-z. [DOI] [PubMed] [Google Scholar]
- 38.Chopra A, Grainger AJ, Dube B, et al. Comparative reliability and diagnostic performance of conventional 3T magnetic resonance imaging and 1.5T magnetic resonance arthrography for the evaluation of internal derangement of the hip. Eur Radiol 2018;28(3):963–71, 10.1007/s00330-017-5069-4. [DOI] [PMC free article] [PubMed] [Google Scholar]
- 39.Naraghi A, White LM. MRI of labral and chondral lesions of the hip. AJR Am J Roentgenol 2015;205(3):479–90, 10.2214/ajr.14.12581. [DOI] [PubMed] [Google Scholar]
- 40.Reiman MP, Thorborg K, Goode AP, Cook CE, Weir A, Holmich P. Diagnostic accuracy of imaging modalities and injection techniquesforthe diagnosisof femoroacetabular impingement/labral tear. Am J Sports Med 2017;45(11):2665–77, 10.1177/0363546516686960. [DOI] [PubMed] [Google Scholar]
- 41.Smith TO, Hilton G, Toms AP, Donell ST, Hing CB. The diagnostic accuracy of acetabular labral tears using magnetic resonance imaging and magnetic resonance arthrography: a meta-analysis. Eur Radiol 2011;21(4):863–74, 10.1007/s00330-010-1956-7. [DOI] [PubMed] [Google Scholar]
- 42.Ferguson SJ, Bryant JT, Ganz R, Ito K. The influence of the acetabular labrum on hip joint cartilage consolidation: a poroelastic finite element model. J Biomech 2000;33(8): 953–60, 10.1016/S0021-9290(00)00042-7. [DOI] [PubMed] [Google Scholar]
- 43.Ferguson SJ, Bryant JT, Ganz R, Ito K. An in vitro investigation of the acetabular labral seal in hip joint mechanics. J Biomech 2003;36(2):171–8, 10.1016/S0021-9290(02)00365-2. [DOI] [PubMed] [Google Scholar]
- 44.Reiman MP, Agricola R, Kemp JL, et al. Consensus recommendations on the classification, definition and diagnostic criteria of hip-related pain in young and middle-aged active adults from the International Hip-related Pain Research Network, Zurich 2018. Br J Sports Med 2020;54(11):631–41, 10.1136/bjsports-2019-101453. [DOI] [PubMed] [Google Scholar]
- 45.O'Donnell JM, Devitt BM, Arora M. The role of the ligamentum teres in the adult hip: redundant or relevant? A review. J Hip Preserv Surg 2018;5(1):15–22, 10.1093/jhps/hnx046. [DOI] [PMC free article] [PubMed] [Google Scholar]
- 46.Shakoor D, Farahani SJ, Hafezi-Nejad N, et al. Lesions of ligamentum teres: diagnostic performance of MRI and MR arthrography-a systematic review and meta-analysis. AJR Am J Roentgenol 2018;211(1):W52–w63, 10.2214/ajr.17.19198. [DOI] [PubMed] [Google Scholar]
- 47.Mayes S, Ferris A-R, Smith P, Cook J. Hip joint effusion-synovitis is associated with hip pain and sports/recreation function in female professional ballet dancers. Clin J Sport Med 2020;30(4):341–7, 10.1097/JSM.0000000000000595. [DOI] [PubMed] [Google Scholar]
- 48.Roemer FW, Kassim Javaid M, Guermazi A, et al. Anatomical distribution of synovitis in knee osteoarthritis and its association with joint effusion assessed on non-enhanced and contrast-enhanced MRI. Osteoarthritis Cartilage 2010;18(10): 1269–74, 10.1016/j.joca.2010.07.008. [DOI] [PubMed] [Google Scholar]
- 49.Guermazi A, Roemer FW, Crema MD, Englund M, Hayashi D. Imaging of non-osteochondral tissues in osteoarthritis. Osteoarthritis Cartilage 2014;22(10):1590–605, 10.1016/j.joca.2014.05.001. [DOI] [PubMed] [Google Scholar]
- 50.Impellizzeri FM, Jones DM, Griffin D, et al. Patient-reported outcome measures for hip-related pain: a review of the available evidence and a consensus statement from the International Hip-related Pain Research Network, Zurich 2018. Br J Sports Med 2020;54(14):848–57, 10.1136/bjsports-2019-101456. [DOI] [PubMed] [Google Scholar]
- 51.Reiman MP, Thorborg K. Clinical examination and physical assessment of hip joint-related pain in athletes. Int J Sports Phys Ther 2014;9(6):737–55. [PMC free article] [PubMed] [Google Scholar]
- 52.Reiman MP, Goode AP, Cook CE, Hölmich P, Thorborg K. Diagnostic accuracy of clinical tests for the diagnosis of hip femoroacetabular impingement/labral tear: a systematic review with meta-analysis. Br J Sports Med 2015;49(12):811, 10.1136/bjsports-2014-094302. 811. [DOI] [PubMed] [Google Scholar]
- 53.Ayeni OR, Banga K, Bhandari M, et al. Femoroacetabular impingement in elite ice hockey players. Knee Surg Sports Traumatol Arthrosc 2014;22(4):920–5, 10.1007/s00167-013-2598-5. [DOI] [PubMed] [Google Scholar]
- 54.Farrell G, McGrath F, Hogan B, et al. 95% prevalence of abnormality on hip MRI in elite academy level rugby union: a clinical andimagingstudyofhipdisorders.JSciMedSport 2016;19(11): 893–7, 10.1016/j.jsams.2016.01.005. [DOI] [PubMed] [Google Scholar]
- 55.Silvis ML, Mosher TJ, Smetana BS, et al. High prevalence of pelvic and hip magnetic resonance imaging findings in asymptomatic collegiate and professional hockey players. Am J Sports Med 2011;39(4):715–21, 10.1177/0363546510388931. [DOI] [PubMed] [Google Scholar]
- 56.Schleich C, Hesper T, Hosalkar HS, et al. 3D double-echo steady-state sequence assessment of hip joint cartilage and labrum at 3 Tesla: comparative analysis of magnetic resonance imaging and intraoperative data. Eur Radiol 2017;27(10):4360–71, 10.1007/s00330-017-4834-8. [DOI] [PubMed] [Google Scholar]
Associated Data
This section collects any data citations, data availability statements, or supplementary materials included in this article.