Figure 6.

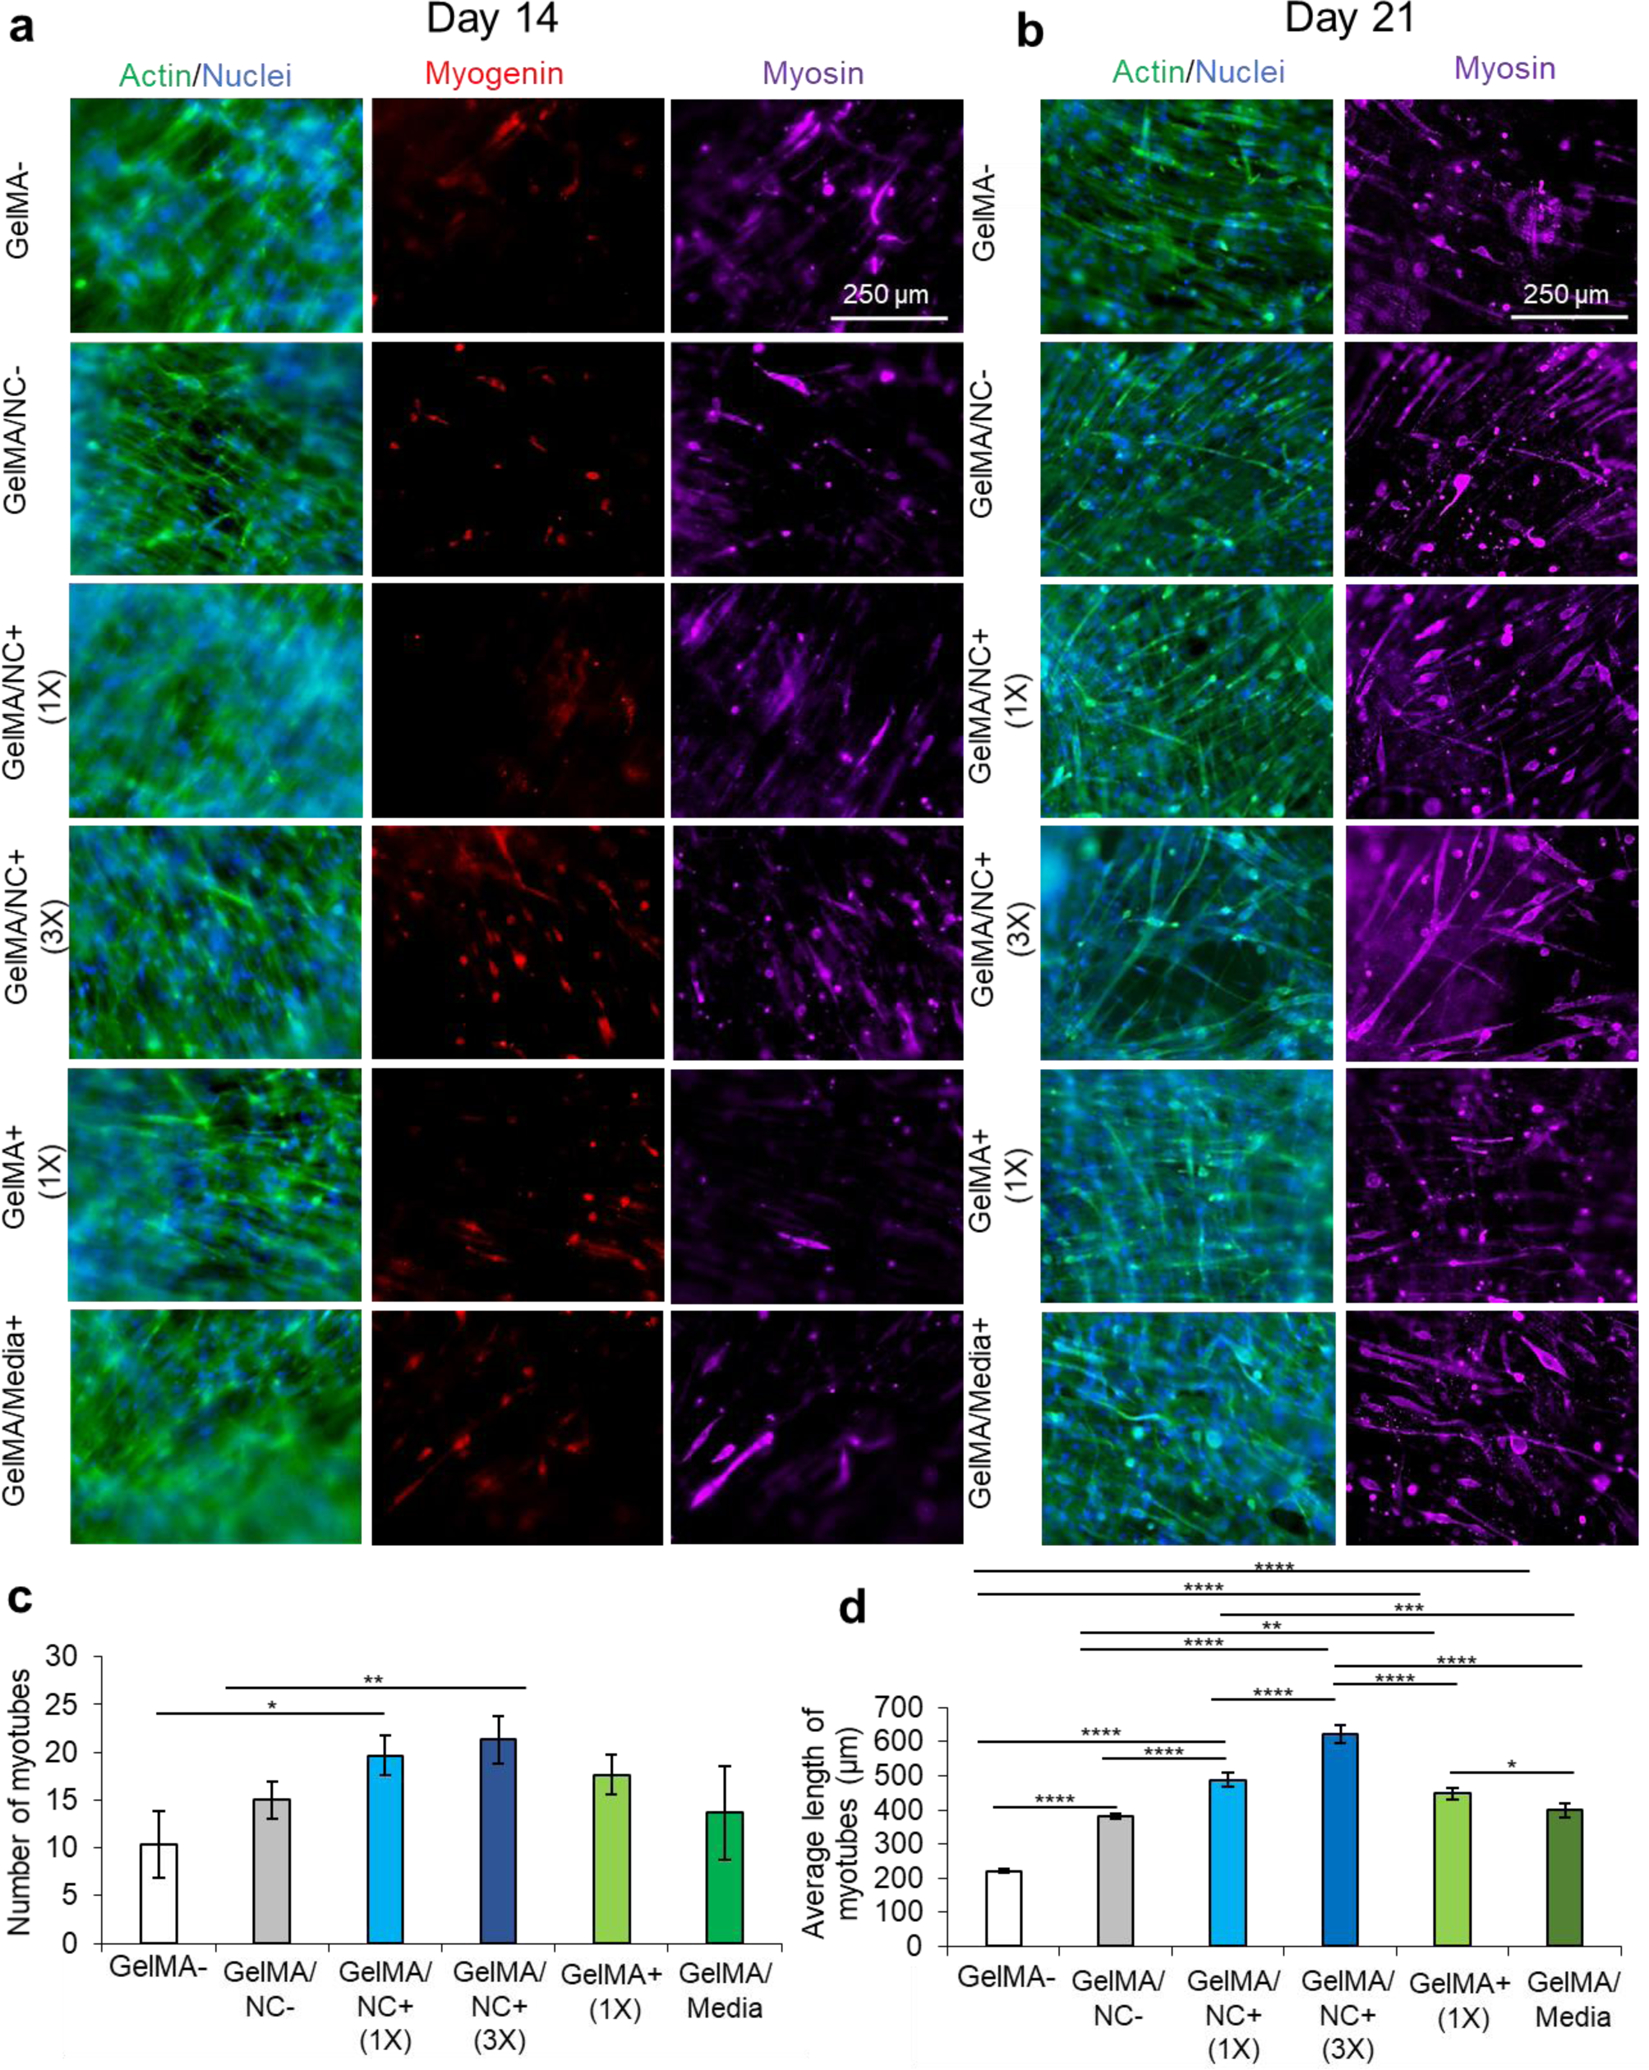
Immunofluorescent imaging of C2C12 differentiation at 14 and 21 days of culture. a) Immunofluorescent staining of actin (green) and nuclei (blue), myogenin (red), and myosin heavy chain (MHC) (purple) at 14 days of culture and 7 days after serum-starved induced differentiation. On day 14, the GelMA/NC+ (3X) condition has the most myosin-positive myotubes. b) Immunofluorescent staining of actin (green) and nuclei (blue); and myosin (purple) at 21 days of culture and 14 days after serum-starved induced differentiation. The longest myosin positive myotubes formed in the GelMA/NC+ (3X) samples. c) Quantified number of MHC myotubes per micrograph. The GelMA/NC+ (1X) and GelMA/NC+ (3X) had significantly more myotubes per micrograph. d) Quantified average length of MHC myotubes per micrograph. All groups had longer myotubes than the GelMA- control. The longest myotubes were found in the GelMA/NC+ (1X) and the GelMA/NC+ (3X) groups. Scale bars of 250 μm for all micrographs.
