Fig. 6.
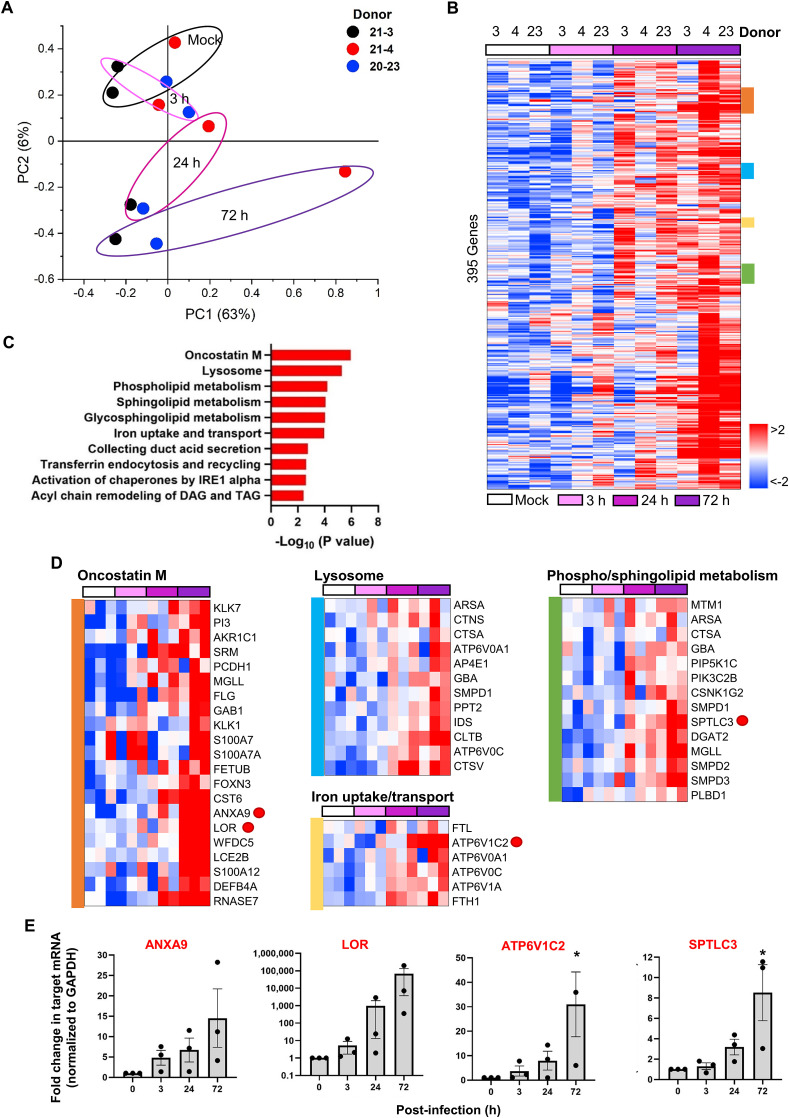
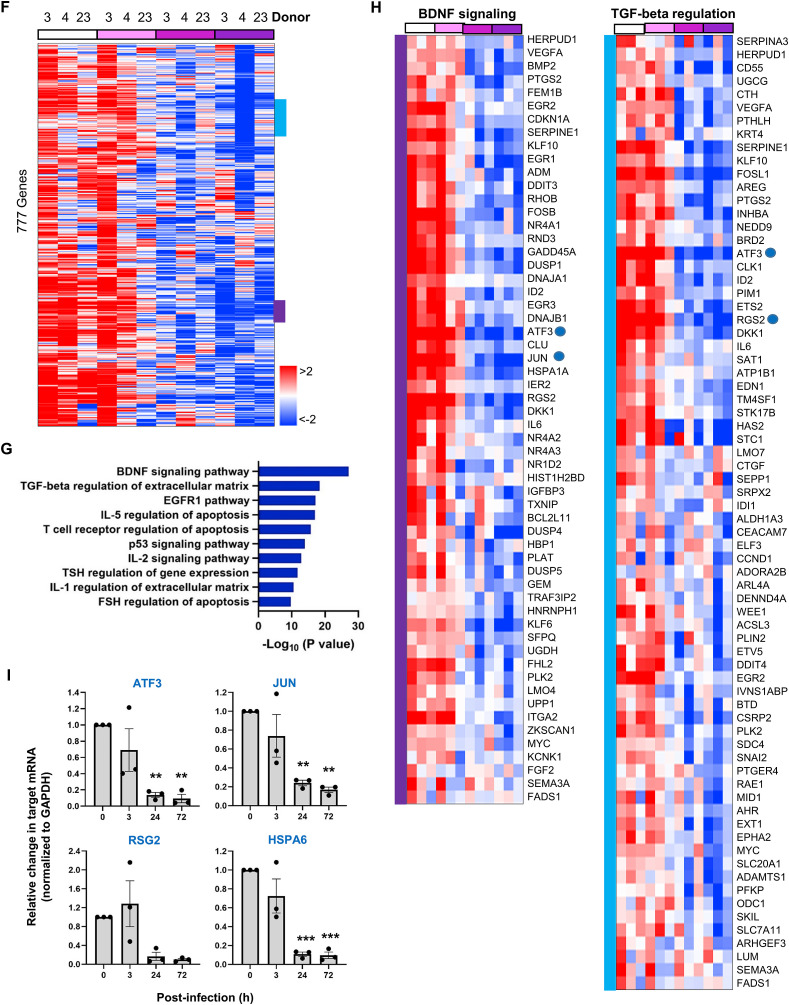
Gene expression changes in human tonsil epithelial organoids in response to SARS-CoV-2 infection. (A) PCA plot of time-course microarray samples from three different donors, 21-3 (black), 21-4 (red) and 20–23 (blue). PCA scores on PC1 (63%) and PC2 (6%) are grouped on the basis of time course, 0 (Mock), 3, 24 and 72 h post-infection. (B) Heatmap showing 395 genes upregulated after SARS-CoV-2 infection in tonsil epithelial organoids from three different donors, 21-3 (simply 3), 21-4 (4), and 20–23 (23). Red and blue represent upregulation and downregulation, respectively (with > 2-fold changes). (C) Top 10 enriched GO categories of differentially upregulated genes in SARS-CoV-2-infected samples. (D) Representative upregulated gene clusters colored in (B) are enlarged with their gene lists. (E) Quantitative RT-PCR of upregulated genes, ANXA9, LOR, ATP6V1C2 and SPTLC3, which are randomly selected among DEGs, marked with red spots in (D). Values are presented as means ± SEM of three independent experiments from the three donors. (F) Heatmap showing 777 genes downregulated after SARS-CoV-2 infection in tonsil epithelial organoids from three different donors, 21-3 (3), 21-4 (4), and 20–23 (23). (G) Top 10 enriched GO categories of differentially downregulated gene in SARS-CoV-2-infected samples. (H) Representative downregulated gene clusters colored in (F) are enlarged with their gene lists. (I) Quantitative RT-PCR of downregulated genes, ATF3, JUN, RSG2 and HSPA6, which are randomly selected among DEGs, marked with blue spots in (D). HSPA6 is downregulated in the IL-5 regulation pathway, thus not marked with a dot. Values are presented as means ± SEM of three independent experiments from the three donors. (For interpretation of the references to color in this figure legend, the reader is referred to the Web version of this article.)


