Abstract
Cancer is one of the most devastating diseases that the world is currently facing, accounting for 10 million deaths in 2020 (WHO). In the last two decades, advanced medical imaging has played an ever more important role in the early detection of the disease, as it increases the chances of survival and the potential for full recovery. To date, dynamic glucose-enhanced (DGE) MRI using glucose-based chemical exchange saturation transfer (glucoCEST) has demonstrated the sensitivity to detect both d-glucose and glucose analogs, such as 3-oxy-methyl-d-glucose (3OMG) uptake in tumors. As one of the recent international efforts aiming at pushing the boundaries of translation of the DGE MRI technique into clinical practice, a multidisciplinary team of eight partners came together to form the “glucoCEST Imaging of Neoplastic Tumors (GLINT)” consortium, funded by the Horizon 2020 European Commission. This paper summarizes the progress made to date both by these groups and others in increasing our knowledge of the underlying mechanisms related to this technique as well as translating it into clinical practice.
Keywords: MRI, Cancer, glucoCEST, DGE MRI, Glucose, CEST, 3-Oxy-methyl-d-glucose
Introduction
Cancer is a devastating disease which accounts for 16.7% of all deaths worldwide and its early detection is vital to increase the chances of survival (https://www.who.int/health-topics/cancer). Presently, cancer is detected, staged, and followed-up radiologically, through computed tomography (CT), magnetic resonance imaging (MRI), or positron emission tomography (PET). In particular, for over 30 years, diagnosis in oncology has exploited the elevated glucose uptake of tumors by using PET in combination with 2-deoxy-2-18F-Fluoro-d-glucose (FDG). It relies on the so-called Warburg effect, characterized by the fact that tumor cells preferentially uptake glucose (or structural analogs) over normal cells, as they rely on enhanced aerobic glycolysis for their energy supply through early metabolic reprogramming [1–4]. Based on the relative uptake of tissues, FDG-PET has enabled the distinction of areas of active tumor from non-tumor or necrotic regions. Furthermore, FDG uptake has been correlated with tumor grade in a wide range of cancers, with an intense PET signal associated to fast proliferating malignant cells [5]. Yet, the technique has its limitations. The radiation exposure restricts repeated scans as well as excludes certain patient groups. Currently, there is an urgent need for an effective and accurate metabolic imaging technique for the detection of new or recurrent tumors and monitoring of treatment response.
Glucose as a contrast agent for MRI: the hopes, the hype, and the facts
Chemical exchange saturation transfer (CEST) is an MRI method that enables indirect detection of exchangeable amide, amine, or hydroxyl proton groups in small concentrations [6, 7]. In particular, dynamic glucose-enhanced (DGE) MRI is based on glucose uptake through its exchangeable hydroxyl proton groups by CEST (glucoCEST) or glucose-based chemical exchange-sensitive spin-lock (glucoCESL). In the latter case, it will be referred to as T1ρ-based DGE (DGEρ) MRI, hereafter. Finally, there are several ways to calculate the signal enhancement, either based on the so-called magnetic transfer ratio asymmetry (MTRasym) method, in which case it will be referred to as “mDGE” MRI, hereafter. Note that there is a general trend, when moving from early clinical studies toward more recent clinical ones, to no longer report the difference in MTRasym, but to calculate the changes from baseline on a single frequency reference downfield from the water peak. Generally, mDGE MRI seems to be less sensitive than single frequency reference assessment which will be referred to as DGE/DGEρ MRI for a dynamic acquisition, while glucoCEST or glucoCESL will be referred for a non-dynamic acquisition, hereafter. List of such abbreviation and acronyms used in the paper is summarized in Table 1.
Table 1.
List of data acquisition-related abbreviation and acronyms used in the paper
| Abbreviation | Definition | Acquisition |
|---|---|---|
| glucoCEST | glucose-based chemical exchange saturation transfer (d-glucose only) | Non-dynamic |
| 3OMG-based glucoCEST | 3-O-methyl-d-glucose-based glucoCEST | Non-dynamic |
| glucoCESL | glucose-based chemical exchange sensitive spin-lock (d-glucose only) | Non-dynamic |
| DGE MRI | Dynamic glucose-enhanced MRI (d-glucose only) | Dynamic |
| 3OMG-based DGE MRI | 3-O-methyl-d-glucose-based DGE MRI | Dynamic |
| DGEρ MRI | T1ρ-based DGE MRI (glucoCESL; d-glucose only) | Dynamic |
| MTRasym | Magnetization transfer ration asymmetry | Dynamic or Non-dynamic |
| mDGE MRI | MTRasym based dynamic glucose-enhanced MRI (d-glucose only) | Dynamic |
DGE MRI has come up as one of the possibly most interesting CEST applications in cancer [8–10]. Preliminary animal data demonstrated a pattern of DGE signal increase using either D-glucose (Glc) [8, 9] (hereafter referred to as “DGE”) or glucose analogs, e.g., 3-O-methyl-D-glucose (3OMG) (hereafter referred to as analog-based DGE, e.g., 3OMG-based DGE) in various tumor models [11, 12] (Table 1). In addition, recent work by several groups showed the possibility of detecting other metabolites based on the CEST effect from hydroxyl protons, such as sucrose, glucosamine (2-amino-2-deoxy-d-glucose, GlcN), and N-acetyl-glucosamine (GlcNAc) [13–15]. Thus, developing new MRI techniques with increased sensitivity to substrate levels of non-radioactive glucose analogs holds promise as a potential replacement for the ubiquitous FDG-PET [16], with the caveat of course that FDG is used in tracer quantities, while any MRI contrast agent requires orders of magnitude larger concentrations for it to be detectable (usually in the mM range). Following early animal studies, several groups have started working on the clinical demonstration of the technique. While some demonstrations of enhanced CEST signal in the human brain following the injection of Glc have been shown at 7 Tesla (T) [17–21], the results at more clinical field strengths of 3 T have been less impressive so far [22, 23]. Finally, three studies have attempted applying this technique outside of the brain at 3 T [24–26]. Therefore, development of DGE MRI methodology for clinical use is far from being complete, and many opportunities still remain.
GLINT consortium
One of the recent international efforts aiming at pushing the boundaries of this translation of the DGE MRI technique into clinical practice has been the glucoCEST Imaging of Neoplastic Tumors (GLINT) consortium, made up of a multidisciplinary team of eight partners and funded by the Horizon 2020 European Commission (2016–2019; http://www.glint-project.eu/). The main aims of that project were to try and assess both Glc and a non-metabolizable glucose derivative (3OMG), used either independently or as a combined examination in clinical radiological oncology practice to assess cancer glucose uptake and metabolism. To establish this new diagnostic in vivo imaging tool, the following main scientific objectives were defined:
-
I.
To improve MRI technologies and image processing tools to be able to better detect the expected small changes in DGE signal at clinical field strength;
-
II.
To establish the compartmental origin of the signal using both Glc and methylated glucose in DGE MRI;
-
III.
To establish detection thresholds and response to therapy in animal models of solid cancers of both native and methylated glucose;
-
IV.
To demonstrate efficacy and safety of the DGE MRI method using Glc through extensive testing in human neoplasms;
-
V.
To assess 3OMG toxicology, bio-distribution and pharmacokinetics in rodents;
-
VI.
To develop an integrated software for the efficient detection and analysis of DGE MRI in the clinic.
As such, this consortium was ideally positioned to push the envelope of the knowledge and technology in this nascent field, and we aim in this paper to review the progress achieved both within and outside this consortium to date.
Origin of the DGE signal
Despite considerable research effort in identifying the specifics of the DGE contrast, its exact cellular origin is still unclear. While the glucose hydroxyl protons are thought to provide a main source for the DGE signal, other effects might also contribute to a change in the observed signal upon glucose injection. In particular, a sudden increase in arterial osmotic pressure could also trigger large changes in the signal. Such osmotic effect would artificially increase the CEST effect after injection, which can be important if the DGE contrast is acquired without corresponding upfield reference [27]. However, the contribution due to osmolarity changes has been shown to be rather small [28] when using the MTRasym method [29] to calculate the DGE effect (mDGE). Other effects, such as alteration in flow and oxygenation levels in the blood, or even volume changes of blood and CSF, might also contribute to signal changes. However, Walker-Samuel et al. [9] could not detect any changes in pH or cerebral blood flow (CBF), thus excluding direct hyperglycemia-related effects as a source of contrast for DGE MRI. If the blood oxygenation levels were to change, it would lead to a small signal change in the vessels due to the change of T2*, similar to the blood oxygenation level dependent (BOLD) effect. Yet, Nasrallah et al. showed a lack of detectable CEST (mDGE) signal after the bolus injection of l-glucose, a glucose analog with identical hydroxyl protons yet limited blood–brain barrier (BBB) permeability [28]. This observation seems to indicate the lack of a vascular contribution to the signal. However, further studies would be needed to fully validate this somewhat counterintuitive finding, given the high levels of l-glucose in the blood compartment after bolus injection.
In vivo assessment of glucose metabolism at single cell level
In addition to l-glucose, Nasrallah et al. also detected a DGE signal using both Glc and 2-deoxy-d-Glucose (2DG) [28]. As such, the DGE signal was assessed, as part of the GLINT consortium, in this organ model. In particular, the individual contributions of the two main brain cell populations, neurons, and glia to the cerebral DGE signal, as opposed to the extracellular compartment, remained unknown at the start of the project. Knowledge about the underlying cellular origin should therefore help better interpret the DGE data. As part of the GLINT consortium, the combination of fiber photometry and DGE MRI was chosen for a direct comparison of the MR-based glucose measurements with the intracellular variations of the concentration of glucose and its metabolites (e.g., pyruvate). Thus, Eleftheriou et al. [30] performed simultaneous CEST MRI and optical measurements, to assess the intracellular glucose response in the somatosensory cortex of the healthy mouse brain in vivo upon injection of Glc.
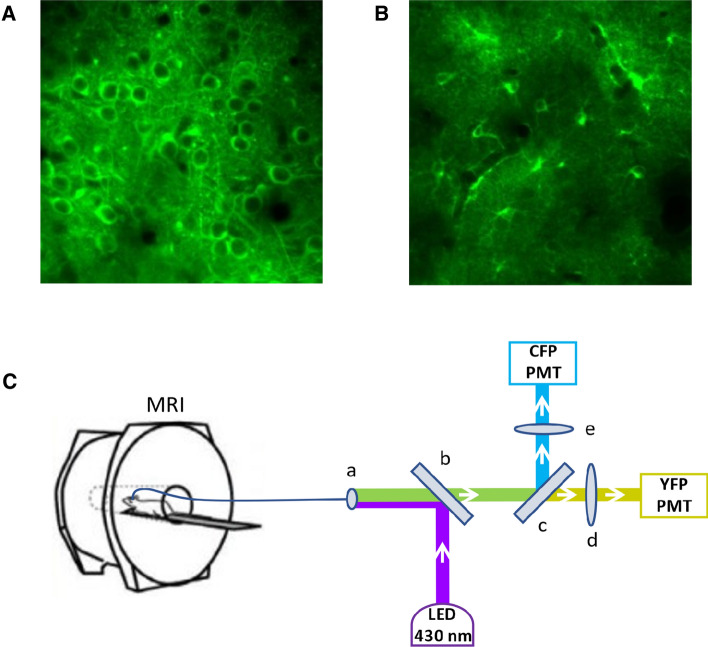
As part of these experiments, DGE measurements were performed on a 7 T Bruker BioSpec 70/30 MRI scanner. Recordings of relative intracellular Glc concentration changes were performed using a custom-made fiber photometry setup optimized for Förster resonance energy transfer (FRET) sensors, that require two detection channels and accurate subtraction of the optic fiber autofluorescence. The Glc-dependent fluorescent signal was generated using the genetically encoded nanosensor FLII12Pglu600μΔ6 (FLIIP) [31], which was codon diversified, to overcome homologous recombination problems [32], and expressed in the somatosensory neocortex of adult mice using an Adeno-Associated Viral (AAV) vector. The cell-specific promoters human Synapsin (hSyn) and short Glial Fibrillary Acidic Protein (GFAP) were used to ensure selectivity of expression in neurons and astrocytes, respectively (Fig. 1A, B).
Fig. 1.
A 2PLSM image of neuronal expression of FLIIP, B 2PLSM image of astrocytic expression of FLIIP, C Experimental setup of simultaneous DGE MRI (7 T Bruker BioSpec 70/30) and fiber photometry measurements: (a) optic fiber connector, (b) dichroic mirror 455 nm, (c) dichroic mirror 515 nm, (d) bandpass filter 530/43 nm, (e) bandpass filter 475/42 nm
The feasibility of measuring changes in the FLIIP signal using fiber photometry was validated by comparison with two-photon laser scanning microscopy (2PLSM), using the same Glc injection protocol. Upon injection of 120 μl of a 50% w/v Glc solution intravenously at normoglycemic conditions, Eleftheriou et al. observed a rapid increase in the DGE signal, reaching a maximum within a few minutes and stabilizing at that level for more than an hour (Fig. 2A), in accordance with previous studies [16, 33, 34]. In contrast, 2PLSM showed slower kinetics both in astrocytes and neurons, taking about 40 min to reach a maximum and then progressively decreasing (Fig. 2B). Differences were observed between the two cell populations, with astrocytes reaching the maximum about 10 min faster than neurons. These results show that simultaneous monitoring by fiber photometry is a promising approach to produce both qualitative and quantitative insights on the origin of DGE signals.
Fig. 2.
Glucose response curves upon intravenous injection of 120 μl 50% w/v glucose solution at normoglycemia after 10 min baseline. A DGE signal, whole brain, 1 mm slice, B 2PLSM (λexc = 870 nm) in astrocytes and neurons, respectively
In particular, the observed intracellular responses of the two most abundant brain cell types allow to draw important conclusions about the origin of DGE signal. The initial rapid increase in DGE signal is unlikely to be of cellular origin, but seems to predominantly reflect the intravascular and/or extracellular concentration of Glc [8], that is known to respond rapidly to blood glucose concentration changes upon injection of Glc [35]. However, the precise relative contribution of the different compartments (intravascular, extracellular, intracellular) cannot be assessed using this method. Based on a direct comparison between mDGE signal response following Glc and l-glucose administration, Nasrallah et al. [28] hypothesized that the early signal increase in the brain could be of extracellular origin. The remarkable stability of the DGE signal during the raising phase of the 2PLSM traces might be explained by the mix of different extra- and intracellular compartments. In fact, whether blood glucose is detectable or not by glucoCEST, the known progressive decrease in blood glucose levels after bolus injection would be directly translated into a reduction in extravascular extracellular glucose levels. With the ongoing glycolytic activity, the glucose concentrations are expected to decrease everywhere. The lack of a corresponding decrease in DGE signal in these experiments remains therefore difficult to explain.
Based on the present study, it can be concluded that the cerebral DGE signal most likely originates from both the extracellular space and potentially from a mix of intracellular neuronal and astrocytic concentrations, with a relative contribution that dynamically changes over time. These temporal dynamics remain, however, undetectable by DGE MRI itself, due to the lack of specificity of the CEST signal. Moreover, in the experimental conditions applied here, the decrease of intracellular glucose concentration due to its consumption is not reflected in the DGE response. Therefore, while DGE MRI is an excellent technique to observe the localization of injected glucose in different brain areas and tumor tissue, the interpretation of the underlying glucose kinetics remains challenging, and for a large part, unresolved.
In vivo assessment of glucoCEST signal dependence on extracellular pH
As shown previously, certain aspects of the glucoCEST signal might be related to pH changes. Indeed, the CEST effect is primarily affected by pH [36]. The fast exchange rate of hydroxyl protons might be reduced in an acidic pH environment, leading to an improved detection of the glucoCEST signal at clinical field strengths. As such, the potential influence of the tumor extracellular pH has to be considered in glucoCEST MRI studies. In fact, the majority of cancerous cells exhibit increased glucose uptake and dysregulated glycolysis, with a consequent decrease of extracellular pH, an established hallmark of tumor microenvironment. As part of GLINT, Longo and co-workers have developed several MRI-based approaches for imaging in vivo tumor acidosis [37–40], showing a robust correlation between tumor glycolysis and extracellular acidification [41].
To optimize detection of glucoCEST images in the small animal, a fast and whole volume coverage CEST sequence was developed, using a multi-slice centric reordered single-shot RARE (Rapid Acquisition and relaxation enhancement) acquisition based on uneven saturation irradiation [42]. This sequence exploits a longer saturation period for the first slice and repeated shorter saturation pulses (to maintain a constant saturation) for all the subsequent slices. Consequently, it can provide a superb high spatial resolution (0.23 × 0.23 × 1.5 mm3) in animals within the whole tumor by sampling ca. 50 frequencies in less than 10 min.
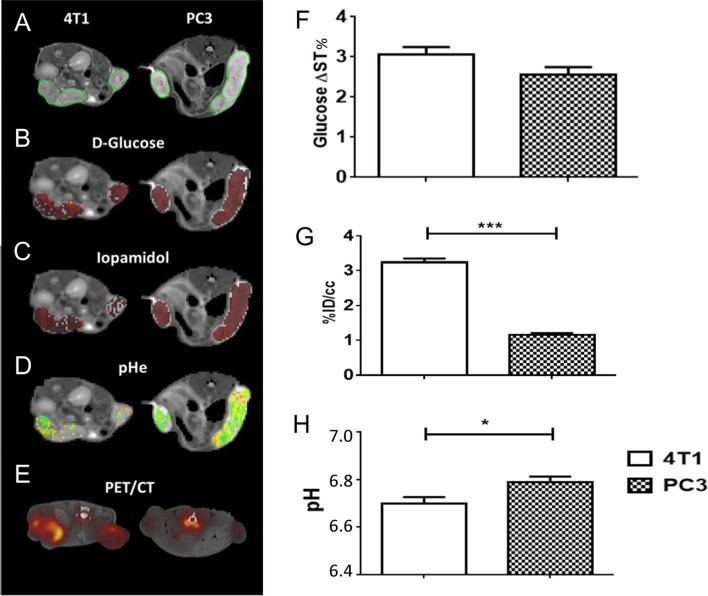
To provide insights about the in vivo glucoCEST signal dependence with the tumor extracellular pH, Aime’s group combined glucoCEST MRI with tumor pH imaging in two tumor models exhibiting distinct metabolic rates (4T1: murine triple negative breast cancer and PC3: human prostate cancer) by sequential imaging following Glc and Iopamidol injection [43]. Moreover, 18F-FDG-PET imaging was performed in the same animals to assess glucose uptake. They observed that 4T1 tumor model displayed a greater glucoCEST contrast and higher 18F-FDG uptake in comparison to the PC3 tumors. Consistently with the higher glucose uptake, 4T1 tumor model presented a more acidic extracellular pH than the PC3 model, reflecting an increased tumor acidosis (Fig. 3). In this study, a moderate correlation was observed between tumor acidosis and glucoCEST contrast, with more acidic tumor models showing higher glucoCEST contrast, in line with the expectation of reduced exchange rate for extracellular glucose hydroxyls at low pH [8, 9].
Fig. 3.
Representative T2w images (A), DGE map after d-glucose i.v. injection (B), CEST contrast (C) and tumor pH maps (D) after iopamidol I.v. injection, fused 18F-FDG-PET/CT images (E) for 4T1 and PC3 tumor-bearing mice. Average values calculated for each tumor model of Glucose ΔST% (F), 18F-FDG PET uptake as %ID/cc (G) and tumor pH (H)
CEST MRI contrast and environmental considerations
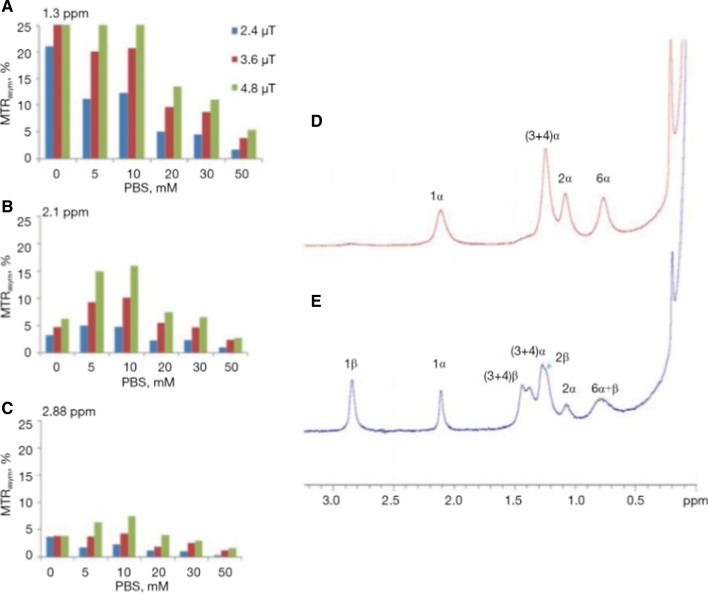
The CEST contrast depends on the proton exchange rate of the labile protons with water. However, since proton exchange rates in biological systems depend on many physiological parameters, translation to a clinical setting is challenging. CEST contrast is often affected by the acidity of the detected environment, the type and concentration of buffer solution, etc. An example of the acute effects caused by the change in buffer concentrations is shown in Fig. 4. The drastic changes in the MTRasym plot around the resonance frequency of the hydroxyl peaks due to the buffer change may indicate the difficulty in characterizing the source of the effect. Therefore, in most cases, it should be considered that the CEST contrast represents a contribution from multiple sources [44].
Fig. 4.
Bar graph showing % of MTRasym of 20 mM glucose solution (10% D2O) at several PBS concentrations at the typical frequency offsets of the hydroxyl peaks (A) 1.3 ppm, (B) 2.1 ppm and (C) 2.88 ppm from the water peak (T = 37 °C, 11.7 T). 1H NMR spectra of the hydroxyl protons of 0.1 M D-Glc solution (T = 4 °C, pH = 5.4, 11.7 T). Spectra were recorded on a fresh sample (D) and several hours after the sample preparation (E). From [44], with permission
Glucose and analogs in preclinical animal models
Comparison between Glc and 3OMG
Sehgal et al. [45] showed the feasibility of using 3OMG as a CEST agent for detecting a malignant human brain tumor (U-87 MG) in a mouse model. They demonstrated that 3OMG shows a CEST contrast enhancement that is approximately twice as much as that of Glc for a similar tumor line. These results are consistent with that obtained for the breast tumor model (4T1) [46] and show the feasibility of using 3OMG as a CEST agent for detecting malignancies.
Both Glc and 3OMG have been investigated in several studies for their CEST contrast. To the best of our knowledge, this is the first study to examine the side-by-side comparison of the two methods in the same animals. For that purpose, mice bearing the 4T1 breast tumor model were scanned in a 7 T scanner using the same CEST protocol on the same day, with an interval of ∼8 h between the two methods to ensure that the CEST signal returned to its baseline level. The results showed that these two agents have different CEST profiles: 3OMG-based DGE MRI showed a higher CEST effect than Glc for the breast cancer model, even at only half the dose used for the latter (0.7 g/kg 3OMG versus 1.5 g/kg Glc). Moreover, the 3OMG-based DGE effect lasted for more than an hour, whereas the DGE effect lasted for only a short time, causing the contrast to disappear completely [46]. That is, the CEST signal of Glc was less stable than that of 3OMG, which is a clear disadvantage in clinical practice.
In addition, Anemone et al. investigated, for the first time, under the same experimental conditions, CEST image analysis and tumor model the CEST contrast efficiency of Glc and 3OMG with the aim of a robust comparison of their properties and CEST efficiency at the two field strengths of 3 T and 7 T [47]. Interestingly, a strong and different pH dependence of the CEST contrast was observed between Glc and 3OMG, with Glc showing higher CEST contrast moving toward acidic pH values (max ST% at pH 6.0–6.2), whereas 3OMG displayed higher CEST effects when the pH was closer to neutral values. Despite the marked differences in pH behavior and metabolic fate of the two molecules, in vivo results in a melanoma tumor murine model showed comparable glucoCEST contrast following intravenous administration. Both Glc and 3OMG provided similar CEST contrast (in the range of 2–3%) at 7 T and at 3 T (range 1–2%) upon i.v. administration with a dose of 3 g/kg. Lower doses resulted in reduced CEST contrast that was lower than 1% at 3 T. Of note, the CEST increase in tumor was almost constant for 3OMG over the 30 min period of observation, whereas a marked increase along time was detected for Glc. This different time-dependent behavior of the CEST contrast suggests unequal contributions from the intracellular and extracellular compartments, linked to the specific metabolic fate and to the observed dissimilar pH dependence of Glc and 3OMG. It also looks like these different concentrations between intra- and extracellular compartments is much different in the brain than in tumors, as shown by Eleftheriou et al. [30]. Moreover, one may surmise that the agent use, in the case of Glc, might directly lead to a reduction in pH due to the enhanced glycolysis as a consequence of the higher availability of glucose to cancer cells. However, in vivo detection at clinical magnetic field strength (3 T) turned out to remain quite challenging for both the molecules and requires accurate parameter optimization [48].
Comparison of MRI glucoCEST signals to PET for monitoring response to therapy
As mentioned in the introduction, 18F-FDG-PET imaging is commonly performed for tumor diagnosis and plays an important role in therapy monitoring [49, 50]. Although glucose and 18F-FDG possess a different metabolic fate, with both readily taken up by cancer cells, a good spatial accordance between the 18F-FDG autoradiography and glucoCEST images was observed in colorectal tumor murine models in the original glucoCEST investigations [9]. On the other hand, few studies had investigated in vivo relationship between the glucoCEST signal and 18F-FDG-PET [45, 46].
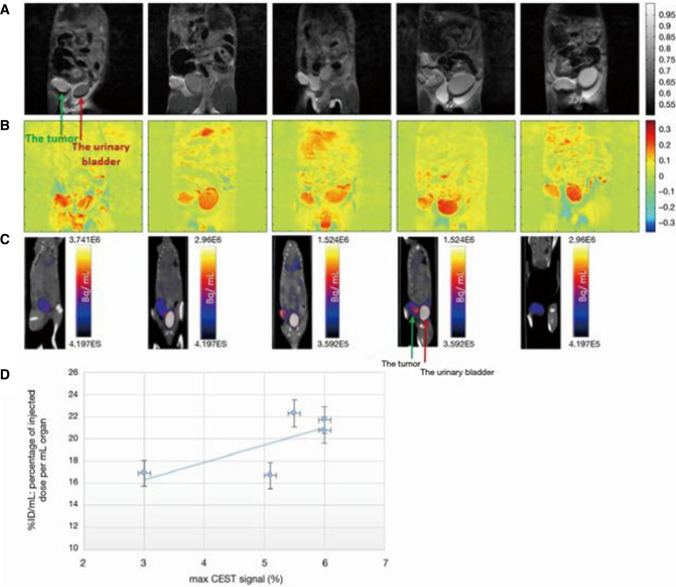
In particular, Rivlin and Navon [46] undertook to compare CEST contrast and 18F-FDG-PET uptake, following the administration of the 3OMG in a breast murine tumor model (4T1). PET measurements were performed 2 days after CEST-MRI acquisitions, 3OMG was administrated per os (1 g/kg), and CEST images were acquired for 60 min after the administration. A similar trend and imaging outcomes were found between two modalities as demonstrated in Fig. 5. From these experiments, a correlation between FDG uptake and 3OMG-based glucoCEST MRI can be established, providing further validation of the use of 3OMG-based glucoCEST MRI as an indicator of glucose uptake.
Fig. 5.
3OMG-based DGE MRI and 18F-FDG-PET/CT images from five tumors of a murine model (4T1 cells). A A coronal view of an anatomical T2-weighted MR images (7 T field) before 3OMG administration showing the tumor (green arrow) and the urinary bladder (red arrow). B % CEST images 60 min after per os administration with 3OMG, 1.0 g/kg (at a frequency offset of 1.2 ppm, B1 = 2.4 µT). A significant CEST contrast was obtained in the tumor and the urinary bladder as well as areas suspected to be metastases. C 18F-FDG-PET/CT coronal view obtained 60 min after IV injection of 18FDG showing accumulation mainly in the tumor (green arrow) and urinary bladder (red arrow). D Correlation between 3OMG % CEST contrast and % ID/mL value in the five tumors from a murine model ± S.D [44]. From [44], with permission
Regarding therapy monitoring, to date, glucoCEST imaging has been assessed in a glioblastoma murine model for evaluating the treatment response to rapamycin, an inhibitor of the mTOR pathway, but without any comparison with the 18F-FDG-PET technique [51]. Consequently, a proper assessment of the glucoCEST technique in evaluating treatment response should be investigated for a potential replacement of the 18F-FDG-PET imaging.
Thus, Capozza et al. investigated whether the glucoCEST approach can monitor the metabolic response to anticancer therapies in a breast murine cancer model and compared the results with those obtained with the 18F-FDG-PET approach [52]. In this study the metastasizing triple negative breast tumor 4T1-bearing mice were treated for two weeks with i) a conventional chemotherapeutic drug (doxorubicin) or ii) with dichloroacetate (DCA) that targets tumor metabolism by reversing the Warburg effect [53].
4T1 tumor volume was dramatically reduced after three cycles of doxorubicin treatment in comparison to the untreated group, whereas tumor size was not reduced after DCA therapy. In accordance with the tumor volumetric changes, the glucoCEST contrast decreased upon doxorubicin treatment, whereas no changes were observed following DCA administration, in agreement with the lack of effect on tumor size. Of interest, 18F-FDG-PET imaging did not report any change in glucose uptake or metabolism for both doxorubicin and dichloroacetate treatments.
Overall, this study indicated a higher sensitivity for glucoCEST imaging in comparison to 18F-FDG-PET for assessing the early response to doxorubicin treatment, although additional studies in other cancer types and therapeutic regimens are needed to confirm these findings.
Specificity of glucose analogs
3-O-methyl-glucose
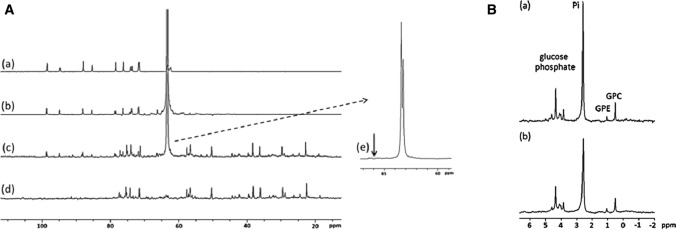
The potential biochemical pathways and sources of CEST contrast for glucose analogs were evaluated by exploring their uptake and metabolism. Enhanced uptake of glucose or glucose analogs in tumors occurs through overexpression of glucose transporter proteins (GLUTs), which are highly expressed in tumor tissues. Therefore, 13C and 31P NMR spectroscopy measurements were first performed to analyze the origin of 3OMG signal. The 13C NMR spectra of combined extracts from 4T1 tumors after per os administration of [6-13C] 3OMG (1.0 g/kg) are shown in Fig. 6A. The results indicate the penetration of 3OMG into the tumors (peak at 63.3 ppm), while no other metabolite was observed. The 31P NMR spectra of extracts from 4T1 tumors also showed no evidence of phosphorylated products in the treated tumors (Fig. 6B). Both results confirm the generally accepted notion that 3OMG can be considered as a “non-metabolized” glucose analog that enters cells via the membrane concentrating sodium-dependent glucose transporter and exits cells via the membrane-facilitated diffusion transporter [54].
Fig. 6.
A 1H‐decoupled 13C NMR spectra of 100 mM 3OMG solution (a), 100 mM [6‐13C]‐3OMG solution (b), combined extracts from 4T1 tumors treated with [6‐13C]‐3OMG (1 g/kg) (c), combined untreated extracts from 4T1 tumors (d), enlargement of (c and e). The arrow represents the expected position of the phosphorylated product of 3OMG (3OMG‐6‐phosphate) on the basis of the observed glucose‐6‐phosphate at 65.6 ppm and the 2‐DG‐6‐phosphate peak at 66.0 ppm. B 1H‐decoupled 31P NMR spectra of combined extracts from 4T1 tumors treated with [6‐13C]‐3OMG (1 g/kg) (a), combined untreated extracts from 4T1 tumors (b). GPC‐glycerophosphocholine, GPE‐glycerophosphoethanolamine, Pi‐inorganic phosphate; spectra were calibrated according to GPC (0.49 ppm). From [46], with permission
Finally, the absence of 6-phospho-O-methyl-d-glucose in the brains of mice after administration of [6-13C] 3OMG (1.0 g/kg, PO) was demonstrated by both 13C and 31P NMR spectroscopy studies of the metabolites extracted from the brains, reinforcing the fact that 3OMG can indeed enter the brains, albeit without any other metabolite as described in Rivlin et al. [44].
Glucose analogs with accumulation effects
The two glucose analogs 2DG and FDG are both taken up by cancer cells, undergo phosphorylation, however, without being further metabolized, and thus accumulate in the cells. As such, 2DG and FDG were shown to give enhanced and stable CEST MRI signal when injected in orthotopic rodent models of mammary tumors [12, 28]. These two glucose analogs present, however, with a very clear toxicity. Indeed, preclinical studies on FDG showed a LD50 of 600 mg/kg in mice and rats injected IP [55].
Furthermore, in clinical trials where 2DG was used to improve the efficacy of radiotherapy, 200–300 mg/kg of 2DG was administered orally after overnight fasting, resulting in significant side effects [56]. Therefore, 2DG and FDG at high concentration are not suitable for cancer diagnosis in humans and should be restricted to laboratory animals. However, in recent publication, proof-of-principle was provided that 2DG can be encapsulated in liposomes, which has the side effect of enhancing the CEST signal while potentially reducing the side effects of the agent for use in humans [57].
On the other side of the spectrum, glucosamine (GlcN) and N-Acetyl-d-glucosamine (GlcNAc) are two amino monosaccharides that are components of glycosaminoglycans, both of which are available over the counter as dietary supplements. Both can also be used as CEST contrast agents as they enter and accumulate in tumor cells via members of the GLUT family. The ability to image tumors by GlcN or GlcNAc CEST MRI has been demonstrated in several tumors of murine model [9, 14, 15]. The CEST detection of GlcN and GlcNAc allows the differentiation of tumors according to their aggressiveness. GlcN has also been shown to allow the detection of metastases, similar to FDG-PET [9]. The contribution of GlcN to CEST contrast can be attributed to GlcN itself and to its phosphorylated products. It can also be explained by tissue acidosis associated with lactate buildup [13, 15]. The NOE effect indicates that the CEST arises from intracellular GlcN and its metabolites, since free GlcN molecules do not elicit such effects [13, 15]. Another advantage of using GlcN or GlcNAc is that they can be detected for their amine/amide peaks around ~ 2–3 ppm, unlike other glucose analogs whose hydroxyl protons have a small chemical shift relative to the water signal (around 1–1.5 ppm). This raises the possibility that they can be detected with clinical scanners. GlcN is already available for clinical trials as it has an excellent safety profile, as evidenced by its widespread use as a dietary supplement.
Other non-metabolizable analogs
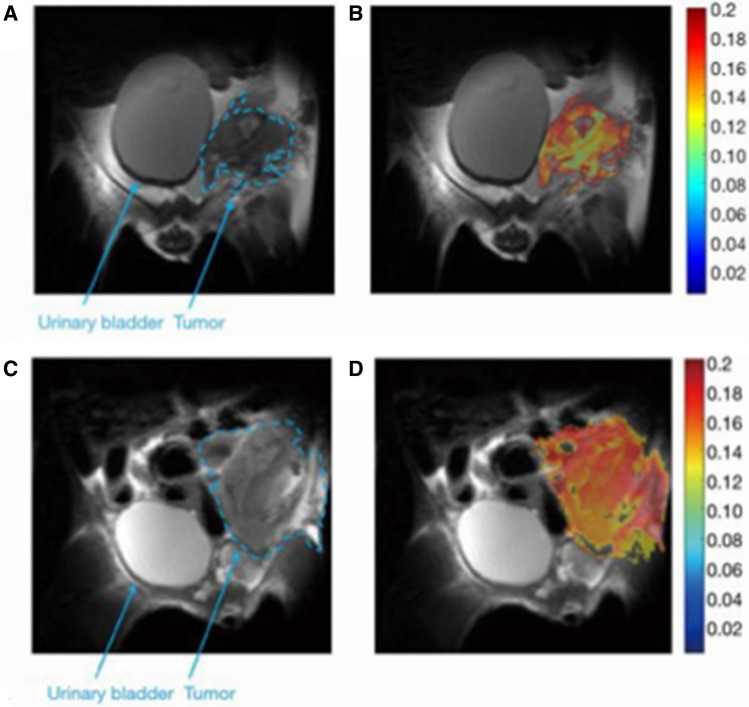
Other non-metabolized glucose analogs, such as 2-O-Methyl-D-glucose (2OMG) and 6-deoxy-D-glucose (6DG), were also tested to avoid risking the whole program on a single pair of molecules (Glc and 3OMG). These glucose analogs had to meet the following three criteria to be considered as potential CEST contrast agents: high uptake by tumors, high CEST signal or exchange-related effects, and very low or on toxic effects. Glucose analogs transported by GLUTs but not recognized by hexokinase have a low toxicity because they are not metabolized and are therefore excreted unchanged. Therefore, 2OMG and 6DG have shown promising results for imaging cancer cells using the CEST technique. Rivlin and Navon investigated and confirmed the inability of 2OMG and 6DG to undergo phosphorylation by 31P NMR spectroscopy studies of extracts from breast tumors (4T1 model) [44]. The Z-spectra of both 2OMG and 6DG were stable and unchanged over time [44], which can be explained by the fact that both agents are known to have a non-glycolytic metabolic profile. The sensitivity of 2OMG and 6DG in identifying regional differences is shown in Fig. 7. Therefore, it can be concluded that glucose analogs that are not phosphorylated by hexokinase are advantageous for cancer diagnosis using the CEST MRI technique.
Fig. 7.
In vivo 2OMG and 6DG CEST MRI measurements in 4T1 tumors (7 T field). A, C T2-RARE anatomical images before administration of the agents. B, D MTRasym images at 1.0 and 1.2 ppm following treatment with 2OMG (3 g/kg, IP) and 6DG (2.0 g/kg, IP), respectively, overlaid onto the T2 anatomical image. From [44], with permission
In another set of experiments, GlcNAc was also compared to sucrose, owing to its high safety profile, as another alternative to Glc [14]. Both sucrose and GlcNAc provided a marked CEST effect that in contrast to Glc and 3OMG seemed to show a reduced dependency to pH. Interestingly, a remarkable CEST contrast was observed in two tumor murine models (breast and melanoma) up to 30 min post intravenous injection as demonstrated in Longo et al. [14]. The combination of good tumor CEST contrast enhancements and lack of toxicity makes sucrose, just as GlcNAc, as another potential interesting candidate contrast agent for tumor detection.
Finally, polymers of glucose units belonging to the class of plasma volume expanders, such as voluven (hydroxyethyl starch, 130 kDa) and dextran 70 (70 kDa), have also been explored as novel and clinically approved macromolecular CEST contrast agents by other groups [58–60]. They represent a novel platform based on the hydroxylic protons of the glucose moieties, although they were primarily exploited as blood pool MRI‐CEST agents to assess tumor vascularization upon increased accumulation and prolonged contrast enhancement in tumors.
Translation of DGE MRI to clinics
Development of novel imaging sequences and data postprocessing algorithms
For DGE MRI to be feasible in the clinics, a robust dynamic imaging is needed, as well as a pre-saturation with minimal direct water saturation. To achieve this, Zaiss et al. developed a 3D spiral centric reordered gradient echo (GRE) acquisition method called snapshot CEST MRI, and demonstrated the feasibility at 3 T and 9.4 T [61, 62]. Snapshot CEST imaging at 3 T consists of an adjustable saturation period and a subsequent readout phase of 2.5 s realized by a centric-spiral reordered 3D GRE readout. The snapshot sequence is a general readout and can be used for B0 and B1 mapping using a WASABI (simultaneous mapping of water shift and B1) preparation [21], CEST, spin-lock (SL), or T1ρ-weighted images as well as T1 mapping with a saturation recovery preparation. The phase information of the GRE also allows for online relative B0 inhomogeneity estimation and correction.
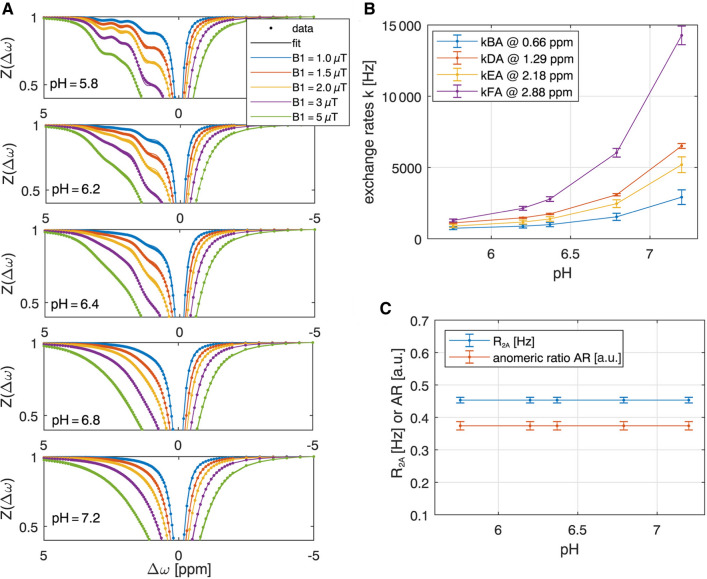
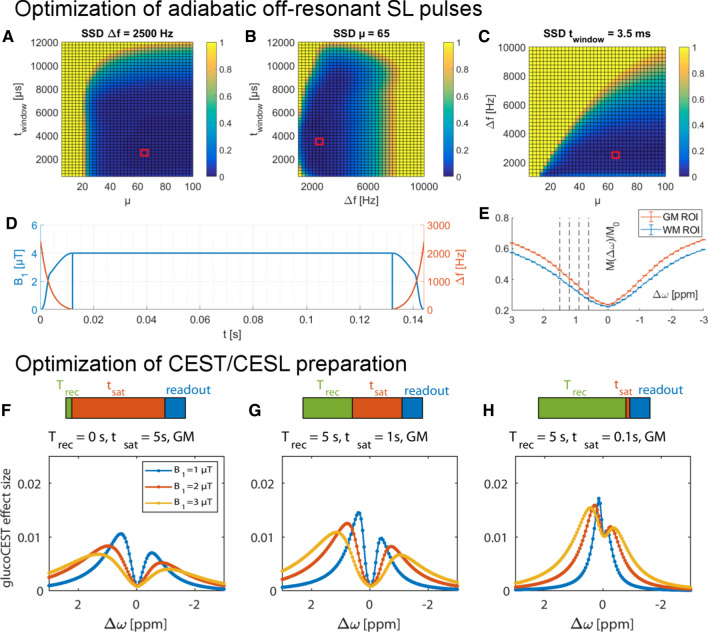
To make the best choice for both pre-saturation and MR readout of a DGE MR sequence, a simulation for the estimation of CEST signal intensities for different setups is needed. It was realized using an N-pool Bloch-McConnell equations with and without RF irradiation. A CEST sequence simulation was thus conducted and a fitting framework, based on a newly developed analytical CEST theory [48, 63–65], was applied for verification [48]. The simulation framework, postprocessing scripts, and sample data can be found in an online repository (https://www.cest-sources.org). The individual exchange rates of the glucose individual hydroxyl groups under in vivo conditions were estimated by a Bloch-McConnell least-squares fit to multi-pH and multi B1 data acquired in glucose solutions at 14.1 T. At pH = 7.2 and T = 37 °C the exchange rates of 1200 Hz (0.66 ppm), 2997 Hz (1.3 ppm), 3543 Hz (2.1 ppm), and 5863 Hz (2.88 ppm) were obtained for the different Glc hydroxyl groups resonating at different frequencies (Fig. 8). Based on these results, the optimal recovery delay and pre-saturation parameters in terms of contrast-to-noise ratio could be determined by Bloch-McConnell simulations including tissue-like direct water saturation and semi-solid magnetization transfer. For CESL or DGEρ at 3 T the best pre-saturation in tissue was achieved by short but strong saturation (see Fig. 9F–H), realized by one SL pulse of duration 100 ms and B1 = 4 μT at 0.4 ppm. The results for higher field strength (9.4 T) were similar, with slightly higher power for CEST pre-saturation (5 µT) and a maximum signal at 0.25 ppm.
Fig. 8.
A Simultaneous multi‐B1‐pH‐fit of 25 Z‐spectra of 20 mM glucose model solutions acquired at 14.1 T yields glucose hydroxyl exchange rates as a function of pH at T = 37 °C B and R2A and anomeric ratio C. From [48], with permission
Fig. 9.
Optimization of the HSExp pulse for 3 T. A–C SSD to an analytical T1ρ spectrum, which were used for pulse optimization [22]. Parameters resulting in a minimal SSD were ∆f = 2.5 kHz, µ = 65, and twindow = 3.5 ms, marked with a red square. D The SL cluster at 0 ppm for a TSL = 120 ms. E Measured Z‐spectra and their standard error for this pulse cluster in a WM and GM ROI. DGEρ offsets acquired in the dynamic experiment are marked with a dashed line (0.6, 0.9, 1.2, and 1.5 ppm). Simulated DGEρ effect after d-glucose injection (F–H) in the steady‐state CEST regime (F), the intermediate regime with only one second of saturation (G), and the SL regime with 100 ms of saturation (H). From [22] and [48], with permission
For optimization and robustness against B1 and B0 inhomogeneities, HSExp adiabatic SL pulses [66] were optimized for the use at 3 T. Based on the requirements for optimal saturation parameters obtained by the Bloch-McConnell fitting [64], a T1ρ-weighted SL imaging with an optimal locking power of 4 µT was set up at 3 T with a locking time TSL = 120 ms after 4 s of relaxation.
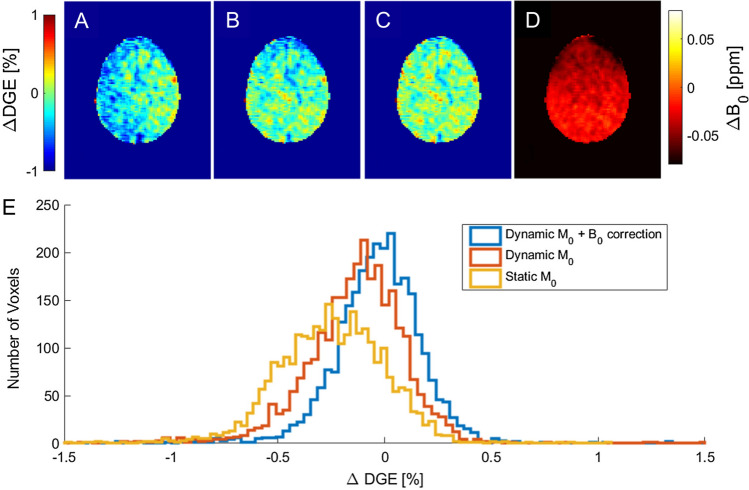
As motion and B0 shifts during the dynamic measurement can lead to artifacts [67], the post-processing of DGEρ MRI data consisted of the following steps: (I) optimized retrospective rigid body motion correction, (II) dynamic normalization by repetitive M0 scans at − 300 ppm, and (III) dynamic B0 correction using the phase information from the GRE readout [68]. The impact of steps (II) and (III) on the data is shown in Fig. 10.
Fig. 10.
Effect of motion correction, interleaved M0, and dynamic B0 correction. A ∆DGEρ [%] map of a volunteer measurement (image number 16 at ∆ω = 0.9 ppm) after motion correction. Here, the entire left hemisphere seems to be affected by a strong hypointensity. B ∆DGEρ map with a normalization to the corresponding image at − 300 ppm. Here, the image is more flat, but still shows slight correlation with B0 (D), especially in the anterior part. C ∆DGEρ map with the same normalization as (B) and an additional B0 correction as proposed in Windschuh et al. [68]. The dynamic B0 correction normalizes the anterior part that is hypointense in (B). D ∆B0 map [ppm] relative to the beginning of the measurement. E Histogram for the images in (A–C). From [22], with permission
mDGE imaging in body
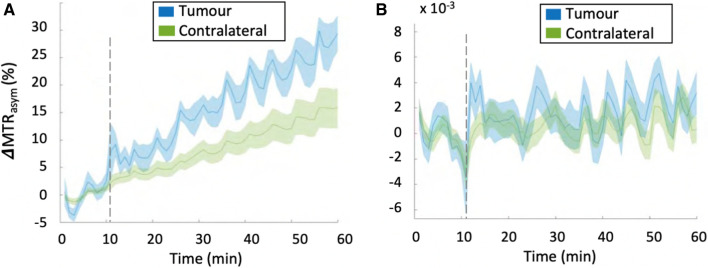
To date, only a few studies have been reported for mDGE MRI outside the brain at 3 T [24–26], while several groups have demonstrated signal changes of mDGE MRI in human brain, following the injection of Glc at 3 T and 7 T [17–23]. The signal responses to Glc injection in human body among a few studies were irregular as the methods used for each mDGE MRI study were diverse in terms of CEST acquisition, as well as B0 shift and B1+ correction. Additionally they may be due to numerous aspects of the experiment, including a combination of differences in injection protocol in addition to variations in the metabolic response of individual patients, as well as the inherent low SNR and sensitivity to motion [67]. To better understand the signal variability from the different mDGE MRI studies in human body applications, Kim et al. [25] optimized mDGE MRI protocols based on rapid assessment of B0 and B1+ and sought to characterize the mDGE MRI signal in two types of cancer with varying expected metabolic rates and blood volume. Additionally, an infusion protocol for intravenous (i.v.) 20% Glc was optimized using a hyperglycemic clamp to maximize the likelihoods of detecting the mDGE MRI signal, by separating measurement of perfusion from metabolism. Results showed that B0 inhomogeneity leading to a shift in the Z-spectra affects the magnitude of mDGE signal over time. In addition, the results suggest that motion correction in addition to B0 is crucial to avoid mistaking mDGE MRI signal changes for a Glc response while B0 field drift remained a significant contributor. Finally, in spite of all these optimizations, no significant mDGE MRI signal was observed in tumor regions of any patients with lymphoma and prostate cancer at 3 T after B0 field drift correction (Fig. 11). Therefore, it has been concluded that mDGE MRI signal at 3 T remains elusive in human body regions, where detection of the originally small mDGE MRI signal is difficult due to physiological movements and substantial effects of B1+ and B0.
Fig. 11.
A MTRasym signal integrated in the range of 2—3 ppm before B0 and B1 correction shows field drifts both in tumor and contralateral regions of a patient with prostate cancer. It is worthwhile to note that the changes due to B0 drift are much larger in the body, due to the increased drift observed. In this case the B0 drifts across slice and entire scan duration were found to be 25 Hz (0.2 ppm) and 200 Hz (1.56 ppm), respectively. B After B0 correction, no significant enhancement in MTRasym signal is observed and the signal intensity is significantly reduced. From [25], with permission
DGE and DGEρ imaging in brain
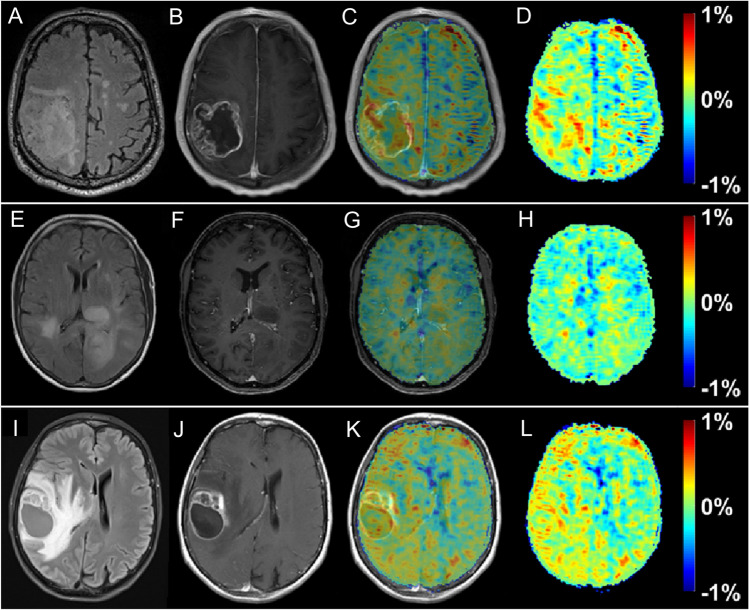
Contrary to body applications, early experience shows that DGE and DGEρ signal detection in human brain seem possible at 3 T [22, 23] if appropriate post-processing steps, i.e., corrections for motion-related artifacts are applied. Although the effect size was small, generated DGEρ maps showed unique patterns, partially correlated with the gadolinium (Gd)-based T1 tumor ring enhancement. In a study of 3 glioma patients, a significant glucose uptake could be observed with a DGEρ effect strength in the range of 0.5% of the water signal for the patients with BBB breakdown. Statistical evidence can decrease when uncorrected motion is included as a thorough analysis revealed.
Compared to reported effects at 7 T in humans of 2–6% [17, 19], the observed DGE⍴ effect size of ~ 0.5% at a clinical field strength of 3 T is small, but consistent with Bloch simulations, where the effect was calculated to be two to three times smaller than at 7 T. The maximum effect size was observed approximately 8 to 9 min after beginning of glucose injection in general, which is in good agreement with the literature on animal experiments [69]. The different contributions to the signal, especially vascular and intracellular contributions are still discussed in the literature. On the contrary, there is a consent in the community that glucose leaking through a damaged BBB into the extravascular, extracellular space contributes to a large extent to the glucoCEST signal. Therefore, a correlation between Gd contrast-enhanced images and DGE⍴ images is expected as Gd-based agents would also enter this space via a BBB breakdown. The following observations were made further [70]: first, when a visible strong or faint BBB breakdown can be observed, in general a positive DGE⍴ signal was also detected. However, spatially, there was only a rough match with the tumor region indicated by the Gd enhancement, i.e., between the hyper-intensity patterns in the DGE⍴ and the DCE contrast. The observed hyper-intense areas in the DGE⍴ maps might originate primarily from higher glucose levels or lower pH values attributed to higher tumor activity. However, it is impossible to define at this stage what the main source of signal enhancement is. Such a conclusion requires a larger dataset if possible with a higher signal to noise ratio and higher contrast to noise ratio for DGE⍴. At the moment, the relation between DCE and DGE⍴ cannot be fully described and one cannot rule out that some of the differences are due to the lower sensitivity of DGE⍴ compared to DCE (Fig. 12).
Fig. 12.
T2 FLAIR (A, E, I), T1‐ce (B,F,J), T1‐ce with overlaid ∆DGEρ map (C, G, K), and the ∆DGEρ‐maps (D,H,L) of patient 1 (A–D, ~ 7 min post-injection), 2 (E–H, ~ 7 min post-injection), and 3 (I–L, ~ 9 min post-injection). From [22], with permission
Finally, in general, the current signal to noise ratio (SNR) renders the possibility to analyze the signal changes over time through the use of a pharmacokinetic (pK) model, as originally proposed in the GLINT application, very unlikely, unless a solution to boost the SNR can be found, which could, inter alia, be the exclusive use of this contrast at higher field strength.
Future direction
Implementation into clinical practice
One of the main conclusions that can be drawn from most studies so far is that the signal of DGE and DGE⍴ MRI is generally small, and thus very sensitive to motion artifacts. If motion is not too severe it can be corrected, and a reliable contrast can be generated. If at all, then deeper insight can be gained at 7 T, and we would also generally recommend aiming for 7 T to be used for further applications of DGE and DGE⍴ MRI due to the increase in both CNR (contrast to noise ratio) and SNR. Pre-saturation using pulsed adiabatic spinlock was very close to the ideal CW (continuous wave)-CEST case. However, other groups reported that this can be outperformed using on-resonant variable delay multi-pulses, which should be considered and compared to the approach reported here [71].
Currently, the response from brain tumor patients seems variable and the small number of patients scanned does not allow to provide a final clinical picture. However, there seem to be a subtle increase in the DGE and DGE⍴ signal over time which, if not overshadowed by motion artifacts, should provide further insights into the biological characterization of brain tumors.
As motion can severely impact the reliability, whole-brain snapshot approaches with prospective motion correction and B0, B1, and motion navigator scans for each CEST acquisition would be ideal. This being said, DGE and DGE⍴ MRI outside the brain might be achievable in the near future, for instance, breast applications, where motion and B0 are not too severe, but in other parts of the body, motion artifacts have to be under control first to achieve a required temporal SNR in the order of 100:1 to be able to detect any signal at all.
Finally, one of the biggest issues to be addressed is possibly the actual risks based on the injection of a large bolus of a high volumetric concentration of Glc, which might, among others, lead to venous thrombosis or thrombophlebitis [72].
Potential diagnostic benefits
As observed from the presented data, the DGE and DGE⍴ signal detected so far in patients at 3 T resembles DCE increases in areas of broken-down BBB. Based on the preclinical data shown in this review, it is, however, still unclear whether DGE and DGE⍴ signal might also shed a light on tumor basal metabolism, expression of tumor markers, or the metabolic alteration induced by constitutive activation of oncogenes in tumor development. If the results from animal models can be transferred into clinical practice, DGE and DGE⍴ MRI could be a promising tool for evaluation of treatment response in patients with gliomas and brain metastases, especially in light of new therapies based on immunomodulation and oncolytic viruses. However, the current state of the art shows that work is needed to improve the specificity and detection power at clinical field strengths.
Conclusion
Through a thorough review of the literature on applications of glucoCEST/CESL so far, one can draw several conclusions. First, it is now clear that Glc can be detected in vivo, and may provide a very unique signature in primary brain cancer (glioma) patients. Several glucose analogs can also be detected and have shown promising results in preclinical settings. Then, several non-metabolizable glucose derivatives (among which 3OMG) have been tested and showed promising early results for translation into the clinics. 3OMG in particular also showed comparable imaging results as the gold standard FDG-PET in animals, thereby highlighting its intracellular contribution (being taken up, yet not phosphorylated), and might be considered therefore as a prime candidate for first-in-man studies. Finally, at this point, further translation into body oncological applications remain limited by the small signal and large number of confounding factors present, e.g., B0 and B1 inhomogeneities, as well as elevated motion artifacts.
Acknowledgements
This work was supported in parts by funding from the National Institute for Health Research (NIHR) University College London Hospitals Biomedical Research Centre (UCLH BRC), and from the European Union’s Horizon 2020 research and innovation program under the Grant Agreement No 667510. The authors would like to thank European Institute for Biomedical Imaging Research (EIBIR), External International Advisory Board (EIAB) and External Data and Safety Monitoring Board (EDSMB) for their support and help throughout this journey.
Conflict of interest
Dr X. Golay is CEO, founder and shareholder of Gold Standard Phantoms.
Footnotes
Publisher's Note
Springer Nature remains neutral with regard to jurisdictional claims in published maps and institutional affiliations.
References
- 1.Warburg O. On the origin of cancer cells. Science. 1956;123:309–314. doi: 10.1126/science.123.3191.309. [DOI] [PubMed] [Google Scholar]
- 2.Maddams J, Utley M, Moller H. Projections of cancer prevalence in the United Kingdom, 2010–2040. Br J Cancer. 2012;107(7):1195–1202. doi: 10.1038/bjc.2012.366. [DOI] [PMC free article] [PubMed] [Google Scholar]
- 3.Etzioni R, Urban N, Ramsey S, McIntosh M, Schwartz S, Reid B, Radich J, Anderson G, Hartwell L. The case for early detection. Nat Rev Cancer. 2003;3(4):243–252. doi: 10.1038/nrc1041. [DOI] [PubMed] [Google Scholar]
- 4.Day SE, Kettunen MI, Gallagher FA, Hu DE, Lerche M, Wolber J, Golman K, Ardenkjaer-Larsen JH, Brindle KM. Detecting tumor response to treatment using hyperpolarized 13C magnetic resonance imaging and spectroscopy. Nat Med. 2007;13(11):1382–1387. doi: 10.1038/nm1650. [DOI] [PubMed] [Google Scholar]
- 5.Gambhir SS, Czernin J, Schwimmer J, Silverman DH, Coleman RE, Phelps ME. A tabulated summary of the FDG PET literature. J Nucl Med. 2001;42(5 Suppl):1S–93S. [PubMed] [Google Scholar]
- 6.Ward KM, Balaban RS. Determination of pH using water protons and chemical exchange dependent saturation transfer (CEST) Magn Reson Med. 2000;44(5):799–802. doi: 10.1002/1522-2594(200011)44:5<799::aid-mrm18>3.0.co;2-s. [DOI] [PubMed] [Google Scholar]
- 7.Ward KM, Aletras AH, Balaban RS. A new class of contrast agents for MRI based on proton chemical exchange dependent saturation transfer (CEST) J Magn Reson. 2000;143(1):79–87. doi: 10.1006/jmre.1999.1956. [DOI] [PubMed] [Google Scholar]
- 8.Chan KW, McMahon MT, Kato Y, Liu G, Bulte JW, Bhujwalla ZM, Artemov D, van Zijl PC. Natural d-glucose as a biodegradable MRI contrast agent for detecting cancer. Magn Reson Med. 2012;68(6):1764–1773. doi: 10.1002/mrm.24520. [DOI] [PMC free article] [PubMed] [Google Scholar]
- 9.Walker-Samuel S, Ramasawmy R, Torrealdea F, Rega M, Rajkumar V, Johnson SP, Richardson S, Goncalves M, Parkes HG, Arstad E, Thomas DL, Pedley RB, Lythgoe MF, Golay X. In vivo imaging of glucose uptake and metabolism in tumors. Nat Med. 2013;19(8):1067–1072. doi: 10.1038/nm.3252. [DOI] [PMC free article] [PubMed] [Google Scholar]
- 10.Jin T, Mehrens H, Hendrich KS, Kim SG. Mapping brain glucose uptake with chemical exchange-sensitive spin-lock magnetic resonance imaging. J Cereb Blood Flow Metab. 2014;34(8):1402–1410. doi: 10.1038/jcbfm.2014.97. [DOI] [PMC free article] [PubMed] [Google Scholar]
- 11.Rivlin M, Tsarfaty I, Navon G. Functional molecular imaging of tumors by chemical exchange saturation transfer MRI of 3-O-Methyl-d-glucose. Magn Reson Med. 2014;72(5):1375–1380. doi: 10.1002/mrm.25467. [DOI] [PubMed] [Google Scholar]
- 12.Rivlin M, Horev J, Tsarfaty I, Navon G. Molecular imaging of tumors and metastases using chemical exchange saturation transfer (CEST) MRI. Sci Rep. 2013;3:3045. doi: 10.1038/srep03045. [DOI] [PMC free article] [PubMed] [Google Scholar]
- 13.Rivlin M, Navon G. Glucosamine and N-acetyl glucosamine as new CEST MRI agents for molecular imaging of tumors. Sci Rep. 2016;6:32648. doi: 10.1038/srep32648. [DOI] [PMC free article] [PubMed] [Google Scholar]
- 14.Longo DL, Moustaghfir FZ, Zerbo A, Consolino L, Anemone A, Bracesco M, Aime S. EXCI-CEST: Exploiting pharmaceutical excipients as MRI-CEST contrast agents for tumor imaging. Int J Pharm. 2017;525(1):275–281. doi: 10.1016/j.ijpharm.2017.04.040. [DOI] [PubMed] [Google Scholar]
- 15.Rivlin M, Navon G (2021) Molecular imaging of cancer by glucosamine chemical exchange saturation transfer MRI: A preclinical study. NMR Biomed 34 (2):e4431. [DOI] [PubMed]
- 16.Xu X, Chan KW, Knutsson L, Artemov D, Xu J, Liu G, Kato Y, Lal B, Laterra J, McMahon MT, van Zijl PC. Dynamic glucose enhanced (DGE) MRI for combined imaging of blood-brain barrier break down and increased blood volume in brain cancer. Magn Reson Med. 2015;74(6):1556–1563. doi: 10.1002/mrm.25995. [DOI] [PMC free article] [PubMed] [Google Scholar]
- 17.Xu X, Yadav NN, Knutsson L, Hua J, Kalyani R, Hall E, Laterra J, Blakeley J, Strowd R, Pomper M, Barker P, Chan K, Liu G, McMahon MT, Stevens RD, van Zijl PC. Dynamic glucose-enhanced (DGE) MRI: translation to human scanning and first results in glioma patients. Tomography. 2015;1(2):105–114. doi: 10.18383/j.tom.2015.00175. [DOI] [PMC free article] [PubMed] [Google Scholar]
- 18.Knutsson L, Seidemo A, Rydhog Scherman A, Markenroth Bloch K, Kalyani RR, Andersen M, Sundgren PC, Wirestam R, Helms G, van Zijl PCM, Xu X. Arterial input functions and tissue response curves in dynamic glucose-enhanced (DGE) imaging: comparison between glucoCEST and blood glucose sampling in humans. Tomography. 2018;4(4):164–171. doi: 10.18383/j.tom.2018.00025. [DOI] [PMC free article] [PubMed] [Google Scholar]
- 19.Schuenke P, Paech D, Koehler C, Windschuh J, Bachert P, Ladd ME, Schlemmer HP, Radbruch A, Zaiss M. Fast and Quantitative T1rho-weighted Dynamic Glucose Enhanced MRI. Sci Rep. 2017;7:42093. doi: 10.1038/srep42093. [DOI] [PMC free article] [PubMed] [Google Scholar]
- 20.Paech D, Schuenke P, Koehler C, Windschuh J, Mundiyanapurath S, Bickelhaupt S, Bonekamp D, Baumer P, Bachert P, Ladd ME, Bendszus M, Wick W, Unterberg A, Schlemmer HP, Zaiss M, Radbruch A. T1rho-weighted dynamic glucose-enhanced MR imaging in the human brain. Radiology. 2017;285(3):914–922. doi: 10.1148/radiol.2017162351. [DOI] [PubMed] [Google Scholar]
- 21.Schuenke P, Windschuh J, Roeloffs V, Ladd ME, Bachert P, Zaiss M. Simultaneous mapping of water shift and B1 (WASABI)-Application to field-Inhomogeneity correction of CEST MRI data. Magn Reson Med. 2017;77(2):571–580. doi: 10.1002/mrm.26133. [DOI] [PubMed] [Google Scholar]
- 22.Herz K, Lindig T, Deshmane A, Schittenhelm J, Skardelly M, Bender B, Ernemann U, Scheffler K, Zaiss M. T1rho-based dynamic glucose-enhanced (DGErho) MRI at 3 T: method development and early clinical experience in the human brain. Magn Reson Med. 2019;82(5):1832–1847. doi: 10.1002/mrm.27857. [DOI] [PubMed] [Google Scholar]
- 23.Xu X, Sehgal AA, Yadav NN, Laterra J, Blair L, Blakeley J, Seidemo A, Coughlin JM, Pomper MG, Knutsson L, van Zijl PCM. d-glucose weighted chemical exchange saturation transfer (glucoCEST)-based dynamic glucose enhanced (DGE) MRI at 3T: early experience in healthy volunteers and brain tumor patients. Magn Reson Med. 2020;84(1):247–262. doi: 10.1002/mrm.28124. [DOI] [PMC free article] [PubMed] [Google Scholar]
- 24.Wang J, Weygand J, Hwang KP, Mohamed AS, Ding Y, Fuller CD, Lai SY, Frank SJ, Zhou J. Magnetic resonance imaging of glucose uptake and metabolism in patients with head and neck cancer. Sci Rep. 2016;6:30618. doi: 10.1038/srep30618. [DOI] [PMC free article] [PubMed] [Google Scholar]
- 25.Kim M, Torrealdea F, Adeleke S, Rega M, Evans V, Beeston T, Soteriou K, Thust S, Kujawa A, Okuchi S, Isaac E, Piga W, Lambert JR, Afaq A, Demetriou E, Choudhary P, Cheung KK, Naik S, Atkinson D, Punwani S, Golay X. Challenges in glucoCEST MR body imaging at 3 Tesla. Quant Imaging Med Surg. 2019;9(10):1628–1640. doi: 10.21037/qims.2019.10.05. [DOI] [PMC free article] [PubMed] [Google Scholar]
- 26.Luo J, Abaci Turk E, Gagoski B, Copeland N, Zhou IY, Young V, Bibbo C, Robinson JN, Zera C, Barth WH, Jr, Roberts DJ, Sun PZ, Grant PE. Preliminary evaluation of dynamic glucose enhanced MRI of the human placenta during glucose tolerance test. Quant Imaging Med Surg. 2019;9(10):1619–1627. doi: 10.21037/qims.2019.09.16. [DOI] [PMC free article] [PubMed] [Google Scholar]
- 27.Choi W, Chung J, Tao J, Kim SG (2017) Effect of Osmolality on Dynamic Glucose Enhanced(DGE) MRI. In: Proceedings of the International Society for Magnetic Resonance in Medicine, 25th Annual Meeting & Exhibition, Honolulu, Hawai’i, USA, 22 - 27 April. p 0194.
- 28.Nasrallah FA, Pages G, Kuchel PW, Golay X, Chuang KH. Imaging brain deoxyglucose uptake and metabolism by glucoCEST MRI. J Cereb Blood Flow Metab. 2013;33(8):1270–1278. doi: 10.1038/jcbfm.2013.79. [DOI] [PMC free article] [PubMed] [Google Scholar]
- 29.Zhou J, Lal B, Wilson DA, Laterra J, van Zijl PCM. Amide proton transfer (APT) contrast for imaging of brain tumors. Magn Reson Med. 2003;50(6):1120–1126. doi: 10.1002/mrm.10651. [DOI] [PubMed] [Google Scholar]
- 30.Eleftheriou A, Ravotto L, Wyss M, Warnock G, Siebert A, B. W Simultaneous glucoCEST and fiber photometryof glucose in the healthy mouse brain. In, ESMRMB, 36th Annual Scientific Meeting, Rotterdam, NL, October 3 - October 5: Abstracts, Friday. Magn Reson Mater Phy. 2019;32:107–233. [Google Scholar]
- 31.Takanaga H, Chaudhuri B, Frommer WB. GLUT1 and GLUT9 as major contributors to glucose influx in HepG2 cells identified by a high sensitivity intramolecular FRET glucose sensor. Biochim Biophys Acta. 2008;1778(4):1091–1099. doi: 10.1016/j.bbamem.2007.11.015. [DOI] [PMC free article] [PubMed] [Google Scholar]
- 32.Komatsubara AT, Matsuda M, Aoki K. Quantitative analysis of recombination between YFP and CFP genes of FRET biosensors introduced by lentiviral or retroviral gene transfer. Sci Rep. 2015;5:13283. doi: 10.1038/srep13283. [DOI] [PMC free article] [PubMed] [Google Scholar]
- 33.Jin T, Mehrens H, Wang P, Kim SG. Chemical exchange-sensitive spin-lock MRI of glucose analog 3-O-methyl-d-glucose in normal and ischemic brain. J Cereb Blood Flow Metab. 2018;38(5):869–880. doi: 10.1177/0271678X17707419. [DOI] [PMC free article] [PubMed] [Google Scholar]
- 34.Huang J, van Zijl PCM, Han X, Dong CM, Cheng GWY, Tse KH, Knutsson L, Chen L, Lai JHC, Wu EX, Xu J, Chan KWY (2020) Altered d-glucose in brain parenchyma and cerebrospinal fluid of early Alzheimer's disease detected by dynamic glucose-enhanced MRI. Sci Adv 6 (20):eaba3884. [DOI] [PMC free article] [PubMed]
- 35.Silver IA, Erecinska M. Extracellular glucose concentration in mammalian brain: continuous monitoring of changes during increased neuronal activity and upon limitation in oxygen supply in normo-, hypo-, and hyperglycemic animals. J Neurosci. 1994;14(8):5068–5076. doi: 10.1523/JNEUROSCI.14-08-05068.1994. [DOI] [PMC free article] [PubMed] [Google Scholar]
- 36.Zhou J, Payen JF, Wilson DA, Traystman RJ, van Zijl PC. Using the amide proton signals of intracellular proteins and peptides to detect pH effects in MRI. Nat Med. 2003;9(8):1085–1090. doi: 10.1038/nm907. [DOI] [PubMed] [Google Scholar]
- 37.Longo DL, Sun PZ, Consolino L, Michelotti FC, Uggeri F, Aime S. A general MRI-CEST ratiometric approach for pH imaging: demonstration of in vivo pH mapping with iobitridol. J Am Chem Soc. 2014;136(41):14333–14336. doi: 10.1021/ja5059313. [DOI] [PMC free article] [PubMed] [Google Scholar]
- 38.Arena F, Irrera P, Consolino L, Colombo Serra S, Zaiss M, Longo DL. Flip-angle based ratiometric approach for pulsed CEST-MRI pH imaging. J Magn Reson. 2018;287:1–9. doi: 10.1016/j.jmr.2017.12.007. [DOI] [PubMed] [Google Scholar]
- 39.Anemone A, Consolino L, Arena F, Capozza M, Longo DL. Imaging tumor acidosis: a survey of the available techniques for mapping in vivo tumor pH. Cancer Metastasis Rev. 2019;38(1–2):25–49. doi: 10.1007/s10555-019-09782-9. [DOI] [PMC free article] [PubMed] [Google Scholar]
- 40.Consolino L, Anemone A, Capozza M, Carella A, Irrera P, Corrado A, Dhakan C, Bracesco M, Longo DL. Non-invasive investigation of tumor metabolism and acidosis by MRI-CEST imaging. Front Oncol. 2020;10:161. doi: 10.3389/fonc.2020.00161. [DOI] [PMC free article] [PubMed] [Google Scholar]
- 41.Longo DL, Bartoli A, Consolino L, Bardini P, Arena F, Schwaiger M, Aime S. In Vivo imaging of tumor metabolism and acidosis by combining PET and MRI-CEST pH imaging. Cancer Res. 2016;76(22):6463–6470. doi: 10.1158/0008-5472.CAN-16-0825. [DOI] [PubMed] [Google Scholar]
- 42.Villano D, Romdhane F, Irrera P, Consolino L, Anemone A, Zaiss M, Dastru W, Longo DL. A fast multislice sequence for 3D MRI-CEST pH imaging. Magn Reson Med. 2021;85(3):1335–1349. doi: 10.1002/mrm.28516. [DOI] [PMC free article] [PubMed] [Google Scholar]
- 43.Anemone A, Capozza M, Dhakan C, Rani B, Zullino S, Arena A, Terreno E, Longo D (2019) Aime S MRI-CEST imaging of tumor metabolism and acidosis for characterizing murine tumor aggressiveness. In: ESMRMB 2019, 36th annual scientific meeting, magnetic resonance materials in pysics, Biology and Medicine, Rotterdam, NL, pp 107–233
- 44.Rivlin M, Navon G. Molecular imaging of tumors by chemical exchange saturation transfer MRI of glucose analogs. Quant Imaging Med Surg. 2019;9(10):1731–1746. doi: 10.21037/qims.2019.09.12. [DOI] [PMC free article] [PubMed] [Google Scholar]
- 45.Sehgal AA, Li Y, Lal B, Yadav NN, Xu X, Xu J, Laterra J, van Zijl PCM. CEST MRI of 3-O-methyl-d-glucose uptake and accumulation in brain tumors. Magn Reson Med. 2019;81(3):1993–2000. doi: 10.1002/mrm.27489. [DOI] [PMC free article] [PubMed] [Google Scholar]
- 46.Rivlin M, Navon G. CEST MRI of 3-O-methyl-d-glucose on different breast cancer models. Magn Reson Med. 2018;79(2):1061–1069. doi: 10.1002/mrm.26752. [DOI] [PubMed] [Google Scholar]
- 47.Anemone A, Capozza M, Arena F, Zullino S, Bardini P, Terreno E, Longo DL, Aime S (2021) In vitro and in vivo comparison of MRI chemical exchange saturation transfer (CEST) properties between native glucose and 3-O-Methyl-D-glucose in a murine tumor model. NMR Biomed 34 (12):e4602. [DOI] [PMC free article] [PubMed]
- 48.Zaiss M, Anemone A, Goerke S, Longo DL, Herz K, Pohmann R, Aime S, Rivlin M, Navon G, Golay X, Scheffler K (2019) Quantification of hydroxyl exchange of D-Glucose at physiological conditions for optimization of glucoCEST MRI at 3, 7 and 9.4 Tesla. NMR Biomed 32 (9):e4113. [DOI] [PMC free article] [PubMed]
- 49.Avril S, Muzic RF, Plecha D, Traughber BJ, Vinayak S, Avril N. 18F-FDG PET/CT for monitoring of treatment response in breast cancer. J Nucl Med. 2016;57(Suppl 1):34S–39S. doi: 10.2967/jnumed.115.157875. [DOI] [PMC free article] [PubMed] [Google Scholar]
- 50.Ito K, Teng R, Schöder H, Humm JL, Ni A, Michaud L, Nakajima R, Yamashita R, Wolchok JD, Weber WA. 18 F-FDG PET/CT for Monitoring of Ipilimumab Therapy in Patients with Metastatic Melanoma. J Nucl Med. 2019;60(3):335–341. doi: 10.2967/jnumed.118.213652. [DOI] [PMC free article] [PubMed] [Google Scholar]
- 51.Xu X, Xu J, Knutsson L, Liu J, Liu H, Li Y, Lal B, Laterra J, Artemov D, Liu G, van Zijl PCM, Chan KWY. The effect of the mTOR inhibitor rapamycin on glucoCEST signal in a preclinical model of glioblastoma. Magn Reson Med. 2019;81(6):3798–3807. doi: 10.1002/mrm.27683. [DOI] [PMC free article] [PubMed] [Google Scholar]
- 52.Capozza M, Anemone A, Dhakan C, Della Peruta M, Bracesco M, Zullino S, Villano D, Terreno E, Longo DL, Aime S. GlucoCEST MRI for the evaluation response to chemotherapeutic and metabolic treatments in a murine triple-negative breast cancer: a comparison with[(18)F]F-FDG-PET. Mol Imaging Biol. 2021 doi: 10.1007/s11307-021-01637-6. [DOI] [PubMed] [Google Scholar]
- 53.Anemone A, Consolino L, Conti L, Reineri F, Cavallo F, Aime S, Longo DL. In vivo evaluation of tumour acidosis for assessing the early metabolic response and onset of resistance to dichloroacetate by using magnetic resonance pH imaging. Int J Oncol. 2017;51(2):498–506. doi: 10.3892/ijo.2017.4029. [DOI] [PubMed] [Google Scholar]
- 54.Wright EM, Loo DD, Hirayama BA. Biology of human sodium glucose transporters. Physiol Rev. 2011;91(2):733–794. doi: 10.1152/physrev.00055.2009. [DOI] [PubMed] [Google Scholar]
- 55.Bessell EM, Courtenay VD, Foster AB, Jones M, Westwood JH. Some in vivo and in vitro antitumour effects of the deoxyfluoro-d-glucopyranoses. Eur J Cancer. 1973;9(7):463–470. doi: 10.1016/0014-2964(73)90128-x. [DOI] [PubMed] [Google Scholar]
- 56.Dwarakanath BS, Singh D, Banerji AK, Sarin R, Venkataramana NK, Jalali R, Vishwanath PN, Mohanti BK, Tripathi RP, Kalia VK, Jain V. Clinical studies for improving radiotherapy with 2-deoxy-d-glucose: present status and future prospects. J Cancer Res Ther. 2009;5(Suppl 1):S21–26. doi: 10.4103/0973-1482.55136. [DOI] [PubMed] [Google Scholar]
- 57.Demetriou E, Story HE, Bofinger R, Hailes HC, Tabor AB, Golay X. Effect of liposomal encapsulation on the chemical exchange properties of diamagnetic CEST agents. J Phys Chem B. 2019;123(35):7545–7557. doi: 10.1021/acs.jpcb.9b02280. [DOI] [PMC free article] [PubMed] [Google Scholar]
- 58.Consolino L, Irrera P, Romdhane F, Anemone A, Longo DL. Investigating plasma volume expanders as novel macromolecular MRI-CEST contrast agents for tumor contrast-enhanced imaging. Magn Reson Med. 2021;86(2):995–1007. doi: 10.1002/mrm.28778. [DOI] [PubMed] [Google Scholar]
- 59.Chen H, Liu D, Li Y, Xu X, Xu J, Yadav NN, Zhou S, van Zijl PCM, Liu G. CEST MRI monitoring of tumor response to vascular disrupting therapy using high molecular weight dextrans. Magn Reson Med. 2019;82(4):1471–1479. doi: 10.1002/mrm.27818. [DOI] [PMC free article] [PubMed] [Google Scholar]
- 60.Li Y, Qiao Y, Chen H, Bai R, Staedtke V, Han Z, Xu J, Chan KWY, Yadav N, Bulte JWM, Zhou S, van Zijl PCM, Liu G. Characterization of tumor vascular permeability using natural dextrans and CEST MRI. Magn Reson Med. 2018;79(2):1001–1009. doi: 10.1002/mrm.27014. [DOI] [PMC free article] [PubMed] [Google Scholar]
- 61.Deshmane A, Zaiss M, Lindig T, Herz K, Schuppert M, Gandhi C, Bender B, Ernemann U, Scheffler K. 3D gradient echo snapshot CEST MRI with low power saturation for human studies at 3T. Magn Reson Med. 2019;81(4):2412–2423. doi: 10.1002/mrm.27569. [DOI] [PMC free article] [PubMed] [Google Scholar]
- 62.Zaiss M, Ehses P, Scheffler K (2018) Snapshot-CEST: Optimizing spiral-centric-reordered gradient echo acquisition for fast and robust 3D CEST MRI at 9.4 T. NMR Biomed 31 (4):e3879. [DOI] [PubMed]
- 63.Jin T, Autio J, Obata T, Kim SG. Spin-locking versus chemical exchange saturation transfer MRI for investigating chemical exchange process between water and labile metabolite protons. Magn Reson Med. 2011;65(5):1448–1460. doi: 10.1002/mrm.22721. [DOI] [PMC free article] [PubMed] [Google Scholar]
- 64.Zaiss M, Angelovski G, Demetriou E, McMahon MT, Golay X, Scheffler K. QUESP and QUEST revisited—fast and accurate quantitative CEST experiments. Magn Reson Med. 2018;79(3):1708–1721. doi: 10.1002/mrm.26813. [DOI] [PubMed] [Google Scholar]
- 65.Jin T, Wang P, Zong X, Kim SG. Magnetic resonance imaging of the Amine-Proton EXchange (APEX) dependent contrast. Neuroimage. 2012;59(2):1218–1227. doi: 10.1016/j.neuroimage.2011.08.014. [DOI] [PMC free article] [PubMed] [Google Scholar]
- 66.Herz K, Gandhi C, Schuppert M, Deshmane A, Scheffler K, Zaiss M (2019) CEST imaging at 9.4 T using adjusted adiabatic spin-lock pulses for on- and off-resonant T1-dominated Z-spectrum acquisition. Magn Reson Med 81 (1):275–290. [DOI] [PubMed]
- 67.Zaiss M, Herz K, Deshmane A, Kim M, Golay X, Lindig T, Bender B, Ernemann U, Scheffler K. Possible artifacts in dynamic CEST MRI due to motion and field alterations. J Magn Reson. 2019;298:16–22. doi: 10.1016/j.jmr.2018.11.002. [DOI] [PubMed] [Google Scholar]
- 68.Windschuh J, Zaiss M, Ehses P, Lee JS, Jerschow A, Regatte RR. Assessment of frequency drift on CEST MRI and dynamic correction: application to gagCEST at 7 T. Magn Reson Med. 2019;81(1):573–582. doi: 10.1002/mrm.27367. [DOI] [PMC free article] [PubMed] [Google Scholar]
- 69.Jin T, Iordanova B, Hitchens TK, Modo M, Wang P, Mehrens H, Kim SG. Chemical exchange-sensitive spin-lock (CESL) MRI of glucose and analogs in brain tumors. Magn Reson Med. 2018;80(2):488–495. doi: 10.1002/mrm.27183. [DOI] [PMC free article] [PubMed] [Google Scholar]
- 70.Bender B, Herz K, Deshmane A, Richter V, Tabatabai G, Schittenhelm J, Skardelly M, Scheffler K, Ernemann U, Kim M, Golay X, Zaiss M, Lindig T. GLINT: GlucoCEST in neoplastic tumors at 3T—clinical results of GlucoCEST in gliomas. MAGMA. 2021 doi: 10.1007/s10334-021-00982-5. [DOI] [PMC free article] [PubMed] [Google Scholar]
- 71.Xu X, Xu J, Chan KWY, Liu J, Liu H, Li Y, Chen L, Liu G, van Zijl PCM. GlucoCEST imaging with on-resonance variable delay multiple pulse (onVDMP) MRI. Magn Reson Med. 2019;81(1):47–56. doi: 10.1002/mrm.27364. [DOI] [PMC free article] [PubMed] [Google Scholar]
- 72.Tagalakis V, Kahn SR, Libman M, Blostein M. The epidemiology of peripheral vein infusion thrombophlebitis: a critical review. Am J Med. 2002;113(2):146–151. doi: 10.1016/s0002-9343(02)01163-4. [DOI] [PubMed] [Google Scholar]


