

Abstract
Background:
Adolescent exposure to alcohol-related social networking site (SNS) content is associated with their own alcohol use. However, there is a need to better understand the relationship between varying levels of adolescent SNS use and alcohol-related risks. In this study, we sought to identify distinct patterns of SNS use across multiple platforms (Facebook, Instagram, and Snapchat) and to assess associations between those patterns and alcohol use outcomes.
Methods:
Data were collected as part of a baseline assessment for a larger longitudinal experimental study. Participants (N = 306, age 15–20) completed measures of demographics, SNS use, and alcohol use.
Results:
Using latent profile analysis (LPA), three SNS use profiles were empirically derived: low SNS users (27.5%), high frequency, low duration users (47.4%), and high frequency, high duration users (25.2%). Significant differences in daily drinking (F [2, 301] = 3.39, p = 0.035) and AUDIT scores (F [2, 289] = 6.15, p = 0.002) were observed for the three profiles, with members of the high frequency, high duration profile reporting significantly more weekly drinks and higher AUDIT scores when compared to the other two profiles.
Conclusion:
These findings imply that a combination of high frequency and high duration SNS use may place individuals at risk for potentially problematic drinking. Given many clinicians have limited opportunities to delve into their patients’ SNS use patterns, results suggest that a simple understanding of frequency and duration of use may provide enough information to indicate who may be at risk.
Keywords: alcohol, drinking, social media, adolescents, latent profile analysis
1. INTRODUCTION
Adolescent alcohol use represents an ongoing public health issue in the United States. In 2019, almost one in five (18.5%) Americans aged 12–20 were past month alcohol users and over one in ten (11.1%) were past month heavy episodic drinkers (i.e., drinking five or more drinks in one occasion for males and four or more drinks in one occasion for females; Substance Abuse and Mental Health Services Administration [SAMSHA], 2020). While alcohol initiation typically occurs in adolescence, the escalation of alcohol use behaviors eventually culminating in heavy drinking is often observed in the transition to young adulthood, a developmental stage characterized by a number of developmental transitions (e.g., biological and cognitive changes, identity transitions, achievement transitions related to school and work, changing relationships with family and peers; Jackson et al., 2021; Schulenberg & Maggs, 2002). Adolescent and young adult alcohol use is associated with a number of deleterious consequences, including disruption of normal growth and development and an increased likelihood for alcohol-related problems later in life (SAMHSA, 2016).
In line with social contagion theory (i.e., the spread of behaviors through social networks; Christakis and Fowler, 2013; Rosenquist et al., 2010), one well-established risk factor associated with adolescent and young adult alcohol use is social networking site (SNS) use (Curtis et al., 2018; Moreno & Whitehill, 2014). Notably, the last decade has witnessed a rapid increase in SNS use among young audiences, as more than nine in ten American teenagers report using at least one SNS platform (Pew Research Center, 2018). Instagram (72%), Snapchat (69%), and Facebook (51%) represent three of the top four SNS platforms used by teenagers (Pew Research Center, 2018). This is concerning given that research indicates greater adolescent and young adult alcohol-related SNS engagement (posting, liking, commenting, and viewing) is associated with increased drinking and alcohol-related problems (Curtis et al., 2018; Litt et al., 2018). This finding is in line with observational studies characterizing alcohol-related SNS content; the vast majority of alcohol-related posts on SNSs are pro-drinking and rarely depict negative alcohol-related consequences (Cavazos-Rehg et al., 2015; Russell et al., 2021). Moreover, alcohol marketers are utilizing SNSs to directly target young audiences (Barry et al., 2016) and exposure to such content is linked to higher levels of alcohol consumption and alcohol-related problems (Jernigan et al., 2017; Lobstein et al., 2017).
Given the rise in SNS use among adolescents and young adults (Pew Research Center, 2018), overwhelmingly positive portrayals of drinking present on SNS (Cavazos-Rehg et al., 2015; Russell et al., 2021), and associations between exposure to alcohol-related SNS content and alcohol use outcomes among this population (Curtis et al., 2018; Moreno & Whitehill, 2014), there is a need to better distinguish between healthy and unhealthy levels of adolescent SNS use with regard to alcohol-related risks. While a number of studies have provided evidence for a link between SNS use and increased alcohol use behaviors (Boyle et al., 2016; Curtis et al., 2018; Fat et al., 2021; Litt et al., 2018), these studies have relied on variable-based approaches and typically focused on one SNS platform at a time. However, SNS platforms differ widely in terms of the features each platform offers, the extent and nature through which individuals use and engage with these platforms, as well as the types, frequency, and duration of alcohol-related exposures encountered on these differing platforms (Boyle et al., 2017). Thus, adolescents may use SNS platforms in varying manners that may have differential associations with alcohol-related outcomes. A person-centered approach (i.e., organizing participants into subgroups of individuals characterized by similar patterns of SNS use) – rather than a variable-based approach – coupled with the examination of adolescent SNS use across multiple platforms may lend to a more useful characterization of risky levels of SNS use among this population. In this exploratory study, we sought to identify distinct patterns of SNS use across multiple platforms (Facebook, Instagram, and Snapchat) and to assess associations between those patterns and alcohol use outcomes.
2. METHODS
2.1. Sample and procedures
Data were collected from March 2017 to April 2018 in the Seattle-metro area as part of a larger study examining relationships between alcohol displays on SNS and alcohol cognitions, use, and negative consequences among a sample of 15–20-year-olds. Participants were provided a direct link to an online screening survey where they were first asked to provide informed consent (parents were asked to provide consent for those 15–17). Eligibility screening criteria included the following: 1) aged 15 to 20 years old; 2) live in the Seattle-metro area; 3) drank at least once within the past 6 months (for those age 18–20); 4) have an active Facebook, Snapchat, or Instagram account (the top three SNS platforms at the time of data collection among this age group); and 5) willingness to attend two in person sessions at the research offices. The age range of 15–20 year olds was criteria for the larger parent study in order to capture underage drinking (i.e., under the legal age of 21 in the United States) among adolescents and young adults. In addition, because the overall goal of the parent study was to obtain a representative sample of adolescents and young adults, drinking criteria was only included for 18–20 year old participants, but not for 15–17 year olds, as recruiting a drinking sample in this younger age range would have likely resulted in a riskier sample for this younger age group. Participants deemed eligible for the study and who passed a phone verification call attended the first in-person session where they completed a baseline assessment from which the current secondary data analysis was conducted. Participants who completed the baseline survey were compensated $30 for their time. All study procedures were vetted and approved by the local IRB prior to data collection.
2.2. Measures
2.2.1. Social media use (clustering indicators).
Two items for each SNS platform (Facebook, Instagram, Snapchat) were used to assess frequency and duration of platform-specific use. The first item asked participants to indicate how many times per day they checked each SNS platform in the previous week. Response options were as follows: (0) 0 times, (1) 1 time, (2) 2 times, (3) 3 times, (4) 4 times, (5) 5 times, (6) 6 times, and (7) 7 or more times. The second item requested participants to report how much time they spent on each SNS platform per occasion in which they checked the platform over the previous week. Response options were: (1) less than 10 minutes, (2) 10–30 minutes, (3) 30–60 minutes, and (4) more than one hour.
2.2.2. Alcohol use (dependent variables).
Typical number of drinks per week was assessed using the Daily Drinking Questionnaire (DDQ; Collins et al., 1985). Participants were presented with a definition of a standard drink (i.e., 5 oz. of wine, 12 oz. of beer, 10 oz. of wine cooler, or 1 oz. of 100 proof liquor) and asked to report on the number of drinks they had each day of a typical week in the past month. Typical weekly drinking was calculated by summing up the number of drinks for each day of the week. Hazardous drinking was assessed using the Alcohol Use Disorders Identification Test (AUDIT; Saunders et al., 1993), a ten-item assessment covering the domains of alcohol consumption, drinking behavior, and alcohol-related problems. Responses to each item on the AUDIT are scored from 0 to 4 (maximum score of 40), with scores of 8 or more being indicative of hazardous drinking. Results from reliability measures within this sample indicated the AUDIT exceeded recommended criteria (α = 0.75; > .70).
2.2.3. Socio-demographic characteristics (covariates).
We planned a priori to control for baseline age, racial background, and birth sex due to their association with alcohol use (World Health Organization, 2018).
2.3. Analysis
Demographics were computed using SPSS ver. 26 (IBM, 2019). Our primary outcome was a latent profile analysis (LPA) of adolescents and young adults based on their levels of frequency and duration of engagement with Facebook, Instagram, and Snapchat (see Figure 1). The LPA was calculated using MPlus ver. 8.4 (Muthén & Muthén, 2018).
Figure 1.
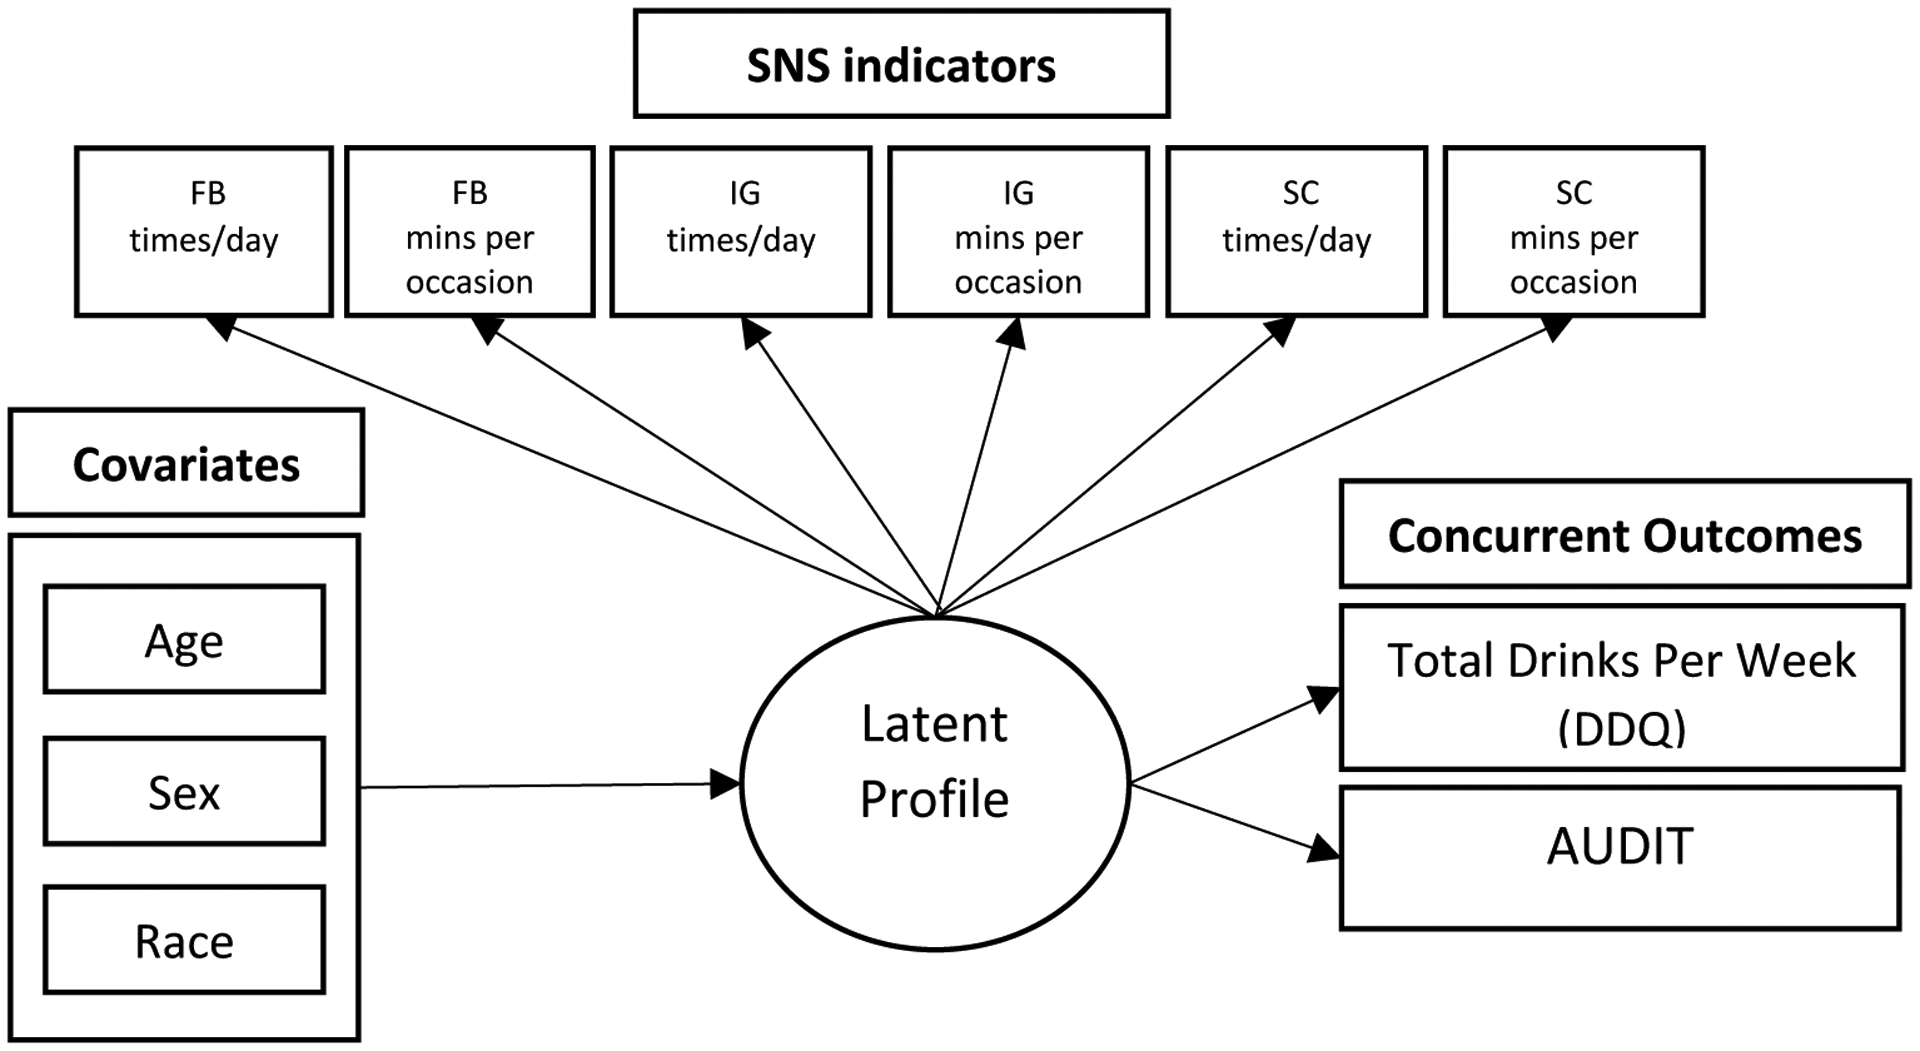
Statistical diagram of the full latent profile model with included covariates and concurrent outcomes.
We ran 2–6 latent profile solutions to determine the best fitting model. To determine the most parsimonious model we relied on several model fit indices including the Akaike information criterion (AIC), Bayesian information criterion (BIC), sample size adjusted Bayesian information criterion (SABIC), the Lo-Mendell-Rubin adjusted likelihood ratio test (LRT), bootstrap likelihood ratio test (BLRT), profile membership size, and entropy (L. Collins & Lanza, 2009; Lanza et al., 2013; Lo et al., 2001). The information statistics AIC and BIC are goodness of fit measures used to compare competing models with lower scores indicating better fit. Entropy levels range from zero to one and are generally considered acceptable at values above .80. Though there is no gold-standard in terms of ideal profile size, profiles smaller than 5% may be call into question due to limited representation in the sample. The LRT statistic compares the current model with a model with one fewer profile and a non-significant value (p > .05) suggests that the model with one fewer profile (previous model) should be accepted. More importantly, we selected the optimal number of profiles based upon theoretical expectations and interpretability of each profile solution. Missing data were handled with a maximum likelihood estimator, robust to non-normality in the data.
Secondary outcomes included profile membership as a predictor of harmful alcohol use while controlling for common covariates (age, birth sex, race). This was completed using the 2-step approach (posterior probability) after the profiles were assigned to most likely profile membership. The concurrent alcohol outcomes were estimated using analysis of variance (ANOVA) in SPSS. When the ANOVA indicated a significant difference, a Tukey HSD post-hoc difference test was computed to identify which profiles differed from each other. The ANOVA method (2-step) was preferred to the BCH approach (3-step) due to the need for inclusion of multiple covariates of alcohol use in the differences testing.
3. RESULTS
3.1. Participants
A total of 1,017 individuals completed screening, 543 (53.4%) were eligible for the larger study, and 344 passed a phone verification call to confirm identity. Of those eligible participants who passed phone verification, 306 (89.9%) completed the in-person baseline assessment. At baseline, participants were on average 18.4 years old (SD = 1.3) and 47.1% were male (Table 1). Over half (55.9%) reported being Caucasian/White, 27.5% Asian, 10.1% more than one race, 3.3% Black, and 2.3% other; 9.2% identified as Hispanic/Latino. Approximately 98.4% of the sample were students with 77.1% being current college students. Participants consumed an average of 6.96 (SD = 8.60) standard drinks per week and scored an average of 6.25 (SD = 4.43) on the AUDIT, with 102 individuals (32.2%) meeting hazardous drinking criteria (AUDIT > 8). In terms of SNS use frequency, the majority of participants checked Facebook (67.2%), Instagram (80.6%), and Snapchat (92.2%) multiple times per day over the previous week. Across participants, 59.4% checked Snapchat seven or more times per day and more than one in ten participants (13.0%) spent more than an hour on Snapchat per occasion in which they checked the platform.
Table 1.
Descriptive Characteristics of the Study Sample
| Variable | N | % | M | SD |
|---|---|---|---|---|
| Age | 18.39 | 1.32 | ||
| Sex | ||||
| Female | 162 | 52.9 | ||
| Male | 144 | 47.1 | ||
| Race | ||||
| Asian/Asian American | 84 | 27.5 | ||
| Black/African American | 10 | 3.3 | ||
| Caucasian/White | 171 | 55.9 | ||
| American Indian/Alaskan Native | 2 | 0.7 | ||
| Native Hawaiian/Pacific Islander | 1 | 0.3 | ||
| Biracial/Multiracial | 31 | 10.1 | ||
| Other | 7 | 2.3 | ||
| Total Drinks per Week (DDQ) | 6.96 | 8.60 | ||
| AUDIT Total | 6.25 | 4.43 | ||
| AUDIT ≥ 8 | 102 | 32.2 | ||
| AUDIT ≥ 15 | 20 | 6.9 | ||
| Frequency (times/day) of checking FB/IG/SC | ||||
| 0 times | 26/18/6 | 9.5/6.5/2.0 | ||
| 1 time | 64/36/17 | 23.3/12.9/5.8 | ||
| 2 times | 59/54/23 | 21.5/19.4/7.8 | ||
| 3 times | 34/40/16 | 12.4/14.4/5.5 | ||
| 4 times | 24/37/26 | 8.7/13.3/8.9 | ||
| 5 times | 13/22/21 | 4.7/7.9/7.2 | ||
| 6 times | 5/6/10 | 1.8/2.2/3.4 | ||
| 7 or more times | 50/65/174 | 18.2/23.4/59.4 | ||
| Time spent (mins) per occasion on FB/IG/SC | ||||
| Less than 10 mins | 162/125/164 | 59.8/45.3/56.2 | ||
| 10–30 mins | 75/90/52 | 27.7/32.6/17.8 | ||
| 30–60 mins | 16/37/38 | 5.9/13.4/13.0 | ||
| More than one hour | 18/24/38 | 6.6/8.7/13.0 |
Note: FB: Facebook; IG: Instagram; SC: Snapchat
3.2. Selection of ideal number of profiles
The 2–6 profile models were tested to determine the most parsimonious model (see Table 2). We identified the 3-profile solution as the most parsimonious fit to the data (AIC = 5636.35, BIC = 5733.16, entropy = 0.91, LMR < 0.01, BLRT < 0.01). We relied primarily on the LMR p-value changing from significant to non-significant from the 3 to 4-profile model, as well as the small profile size (under 10% of sample) in the 4-profile solution. Given this result, we further examined the 3-profile model and the models above and below (2 & 4 profile models) for pragmatic evaluation. The 3-profile solution was preferred to the 2-profile solution because the 3-profile solution identified a low SNS use group (a potentially important subgroup) with 84 subjects not observed in the 2-profile solution (where groups differed mainly on duration). The 4-profile solution needlessly split the high frequency, high duration subgroup (see description in next section) into 2 subgroups, a high and low Snapchat group. Because our primary aim focused on SNS use generally, and not platform-specific SNS use, we felt this differentiation was unnecessary. Hence, the 3-profile model was chosen and satisfied parsimony, efficiency, interpretability, and its ability to identify 3 discrete SNS use profiles.
Table 2.
Fit indices for the latent profile analysis.
| Model | |||||
|---|---|---|---|---|---|
| 2 profiles | 3 profiles | 4 profiles | 5 profiles | 6 profiles | |
| AIC | 5797.39 | 5636.35 | 5538.55 | 5412.23 | 5347.42 |
| BIC | 5868.14 | 5733.16 | 5661.43 | 5561.17 | 5522.43 |
| SABIC | 5807.88 | 5650.70 | 5556.76 | 5434.31 | 5373.37 |
| BLRT p value | <0.01 | <0.01 | <0.01 | <0.01 | <0.01 |
| Class size % | 75, 25 | 47, 28, 25 | 47, 28, 16, 9 | 40, 22, 15, 13, 10 | 42, 19,15, 11, 10, 3 |
| LRT p value | <0.01 | <0.01 | 0.16 | 0.08 | 0.45 |
| Entropy | 0.96 | 0.91 | 0.90 | 0.92 | 0.93 |
Note: AIC: Akaike information criteria; BIC: Bayesian information criteria; SABIC: Sample size adjusted Bayesian information criteria; LRT: Lo-Mendell-Rubin adjusted likelihood ratio test. Bolded values denote that the model was selected as the most parsimonious.
3.3. Description of profiles
Profile one (“low SNS use” − 27.5%) was characterized by checking SNSs less frequently and spending less time per occasion when checking SNSs (Figure 2). Profile two (“high frequency, low duration” − 47.4%) was characterized by highly frequent checking of SNSs, especially Snapchat, yet spending less time on SNSs when checking them. Finally, profile three (“high frequency, high duration” − 25.2%) was characterized by highly frequent checking of SNS platforms and spending large amounts of time per occasion in which these platforms were checked. For example, members of profile three reported checking Snapchat an average of over six times per day in the previous week and spent 30–60+ minutes per occasion on the platform.
Figure 2.
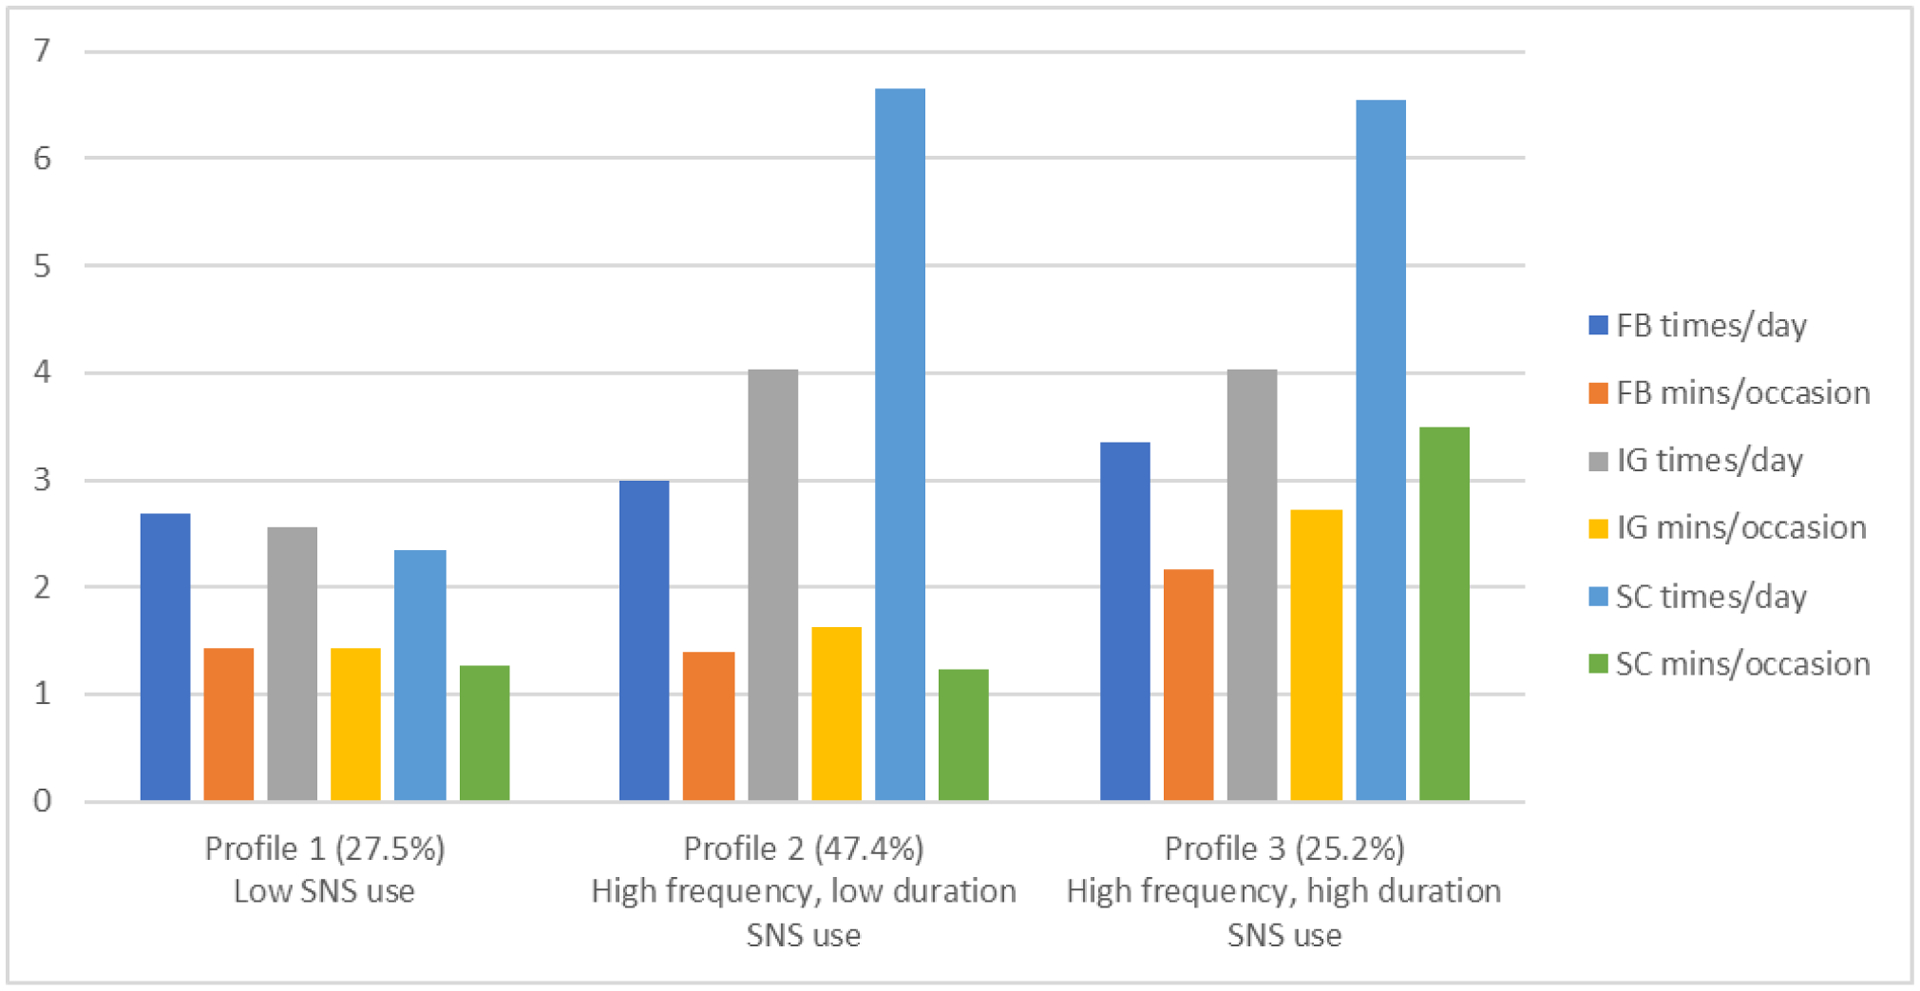
Mean values for Facebook (FB), Instagram (IG), and Snapchat (SC) use for latent profiles 1–3.
Note: SNS: social networking sites; Responses for frequency of checking SNS are scored on an 8-point scale ranging from 0 times per day (0) to 7 or more times per day (7). Responses for time spent per occasion on SNS are as follows: (1) Less than ten mins., (2) 10–30 mins, (3) 30–60 mins, (4) more than one hour.
3.4. Bivariable and multivariable associations of profile membership with alcohol use
There was a statistically significant difference in daily drinking for the three profiles (F [2, 301] = 3.39, p = 0.035; Table 3). Post-hoc comparisons using the Tukey HSD test indicated that the mean number of weekly drinks for the low SNS use profile (M = 5.64, SD = 7.68) and the high frequency, low duration SNS use profile (M = 6.63, SD = 7.59) was significantly less than the high frequency, high duration SNS use profile (M = 9.05, SD = 10.82). Similarly, there was a statistically significant difference in AUDIT scores for the three profiles (F [2, 289] = 6.15, p = 0.002). The low SNS use profile (M = 5.27, SD = 4.14) and the high frequency, low duration SNS use profile (M = 6.08, SD = 4.40) demonstrated significantly lower AUDIT scores in comparison to the high frequency, high duration SNS use profile (M = 7.69, SD = 4.50). Notably, 24.1% of members in the low SNS use profile met criteria for hazardous drinking compared to 32.1% of members in the high frequency, low duration profile and 44.4% in the high frequency, high duration SNS use profile.
Table 3.
Number of drinks per week and AUDIT scores by latent profile membership
| Profile One: Low SNS use 27.5% | Profile Two: High frequency, low duration SNS use 47.4% | Profile Three: High frequency, high duration SNS use 25.2% | |
|---|---|---|---|
| Total drinks per week (DDQ) | 5.64a | 6.63a | 9.05b |
| AUDIT Total Score | 5.27a | 6.08a | 7.69b |
| AUDIT ≥ 8 | 24.1% | 32.1% | 44.4% |
| AUDIT ≥ 15 | 4.8% | 5.8% | 11.1% |
Note: SNS: Social networking site; Post-hoc tests with the same superscript letters indicate no significant difference between profiles; different letters indicate significant differences (p < .05). Controlling for age, biological sex, and racial background.
4. DISCUSSION
Results of the present study indicated significant differences between SNS use profiles and alcohol consumption and alcohol-related problems. Notably, we identified three SNS use profiles based on frequency and duration of Facebook, Instagram, and Snapchat usage; membership in the high frequency, high duration profile was associated with greater drinks per week and higher scores on the AUDIT. These findings imply that a combination of high frequency and high duration SNS use may place individuals at risk for potentially problematic drinking or may indicate a general susceptibility for the subgrouping of substance and behavioral addictions among addiction-prone individuals (Deleuze et al., 2015). Of interest, the high frequency, low duration profile was significantly different than the high frequency, high duration profile indicating that simply checking SNS platforms multiple times a day may not be particularly risky; however, coupling frequent SNS checking with spending longer periods of time (duration) each time an individual checks SNS may be what leads to increased risk. One possible explanation for this finding is that when adolescents and young adults spend more time per occasion on SNSs they are interacting more deeply with content they view (i.e., more active engagement, such as liking, sharing, or commenting on posts) whereas individuals who check frequently but spend less time per occurrence may be viewing content at a more surface level (i.e., more passive engagement) and thus it is less likely to be associated with their own behaviors. While a majority of existing research has focused on singular variable-specific patterns of use on single SNS platforms, the present study is the first to our knowledge to center the level of analysis around the person and their unique patterns of use across multiple popular SNS platforms.
Our findings are in line with recent research (Fat et al., 2021) that indicate greater duration of use (hours per day) was associated with drinking, but suggests that it is both the duration and frequency of use that is associated certain profiles of use that may be more or less associated with alcohol use outcomes. Further, the present study elicited responses pertaining to duration and frequency of specific SNS platforms instead of asking for overall time on SNS, which may have yielded more accurate recall of platform specific use. However, it is important to note that the profiles of SNS users in the present study were not differentiated by use of specific platforms over others, thus indicating that the specific platforms used may not matter as much as the overall duration and frequency of use across all SNS platforms used. Nevertheless, those in the high frequency, high duration SNS use profile checked Snapchat much more frequently than Instagram and Facebook and spent more time on the platform per each occasion in which they checked Snapchat. Consistent with this finding, LaBrie et al., 2021 found that greater time on SNSs, particularly on Snapchat, was associated with greater alcohol consumption among male college students.
The present study contributes additional evidence regarding whether certain patterns of SNS use may be associated with risky drinking and considers the overall profile of SNS use instead of focusing on a singular predictor of use. This classification system may be useful for researchers, clinicians, and parents in considering whether a given adolescent or young adult may be engaged in SNS use – irrespective of type of content viewed/shared – that may present risk for hazardous drinking. Given that many clinicians have limited opportunities to delve into their patients’ SNS use patterns, results of the present study indicate that a simple understanding of frequency and duration of use may provide enough preliminary information to indicate who may be at risk and who may be in need of additional information, counseling, or intervention. However, it should be noted the profiles of users in the present study should not be used as clinical decision-making points, but rather as a starting point to determine which individuals may warrant further discussion about their SNS use and drinking. Nevertheless, such a classification system may prove a useful tool for identifying risky patterns of SNS most associated with problematic drinking, and thus, individuals who may benefit from preventive interventions.
4.1. Limitations
Although the present study provides important information about particularly risky profiles of SNS use among adolescents and young adults, it is not without limitations. First, the data collected were self-reported. Participants may under or over-report both their SNS use duration and frequency as well as their alcohol consumption. However, self-report for alcohol consumption has been found to be reliable and valid (Simons et al., 2015), whereas research related to validity of self-report measures for SNS use has yielded mixed findings (Junco, 2013). As such, future research should aim to determine the validity of the SNS-specific measures used. Second, this study focused on the use of three of the most popular SNS platforms among adolescents (Facebook, Instagram, and Snapchat) at the time of data collection; however, results may not necessarily be generalizable to other emerging and popular SNS platforms (e.g., TikTok, Twitter). In addition, future research should examine potentially important differences based on intensity and duration of SNS usage (i.e., how much time spent on SNS per day, how actively or passively participants use SNS when they are online) as well as other potentially important variables such as whether the type of posts (i.e., video, text, photos), content of posts (e.g., positive portrayals of alcohol), or source of posts (i.e., close friends, celebrities) impact risk profiles. Third, given the cross-sectional nature of the present study, temporal conclusions cannot be reached. As such, additional research designs, including longitudinal and event-level studies could provide more nuanced understanding of typologies of SNS use and alcohol use. Finally, the sample in the present study did not contain any participants of legal drinking age, thus we cannot determine whether the results generalize to legal young adult drinkers who may use SNS differently and have greater access to alcohol. It is also worth noting that only those 18–20 needed to drink alcohol to be eligible for the present study, so drinking behavior, especially among the 15–17 year old participants may not be representative of higher-risk adolescent drinkers.
4.2. Conclusions
Overall, the results of the present study provide a simple classification system that can be used as a basis for potentially identifying adolescents and young adults who use SNS platforms in ways that may predispose them to engaging in heavier drinking. Results indicate that using two SNS variables (duration and frequency) across different SNS platforms may provide initial insight into which individuals may be at particular risk, and therefore, may be in need of preventive interventions related to their own SNS use and drinking behaviors.
Highlights.
We identified three adolescent social networking site (SNS) use profiles
High frequency, high duration profile held higher drinking levels and AUDIT scores
Coupling of high frequency, high duration SNS use may conduce drinking risk
Understanding frequency and duration of SNS use may inform risk assessment
This classification system may be useful for researchers, clinicians, and parents
Role of funding source
Data collection and manuscript preparation were supported by grants from the National Institute on Alcohol Abuse and Alcoholism (R21AA024163, R34AA026332) awarded to Dr. Dana M. Litt. Dr. Vest was supported by the National Institute on Drug Abuse of the National Institutes of Health under award number T32DA035165. The content of this manuscript is solely the responsibility of the authors and does not necessarily represent the official views of the National Institute on Alcohol Abuse and Alcoholism or the National Institutes of Health.
Footnotes
Publisher's Disclaimer: This is a PDF file of an unedited manuscript that has been accepted for publication. As a service to our customers we are providing this early version of the manuscript. The manuscript will undergo copyediting, typesetting, and review of the resulting proof before it is published in its final form. Please note that during the production process errors may be discovered which could affect the content, and all legal disclaimers that apply to the journal pertain.
Conflict of Interest
No conflict declared
Author CRediT Statement
| Author Name | Conceptualization | Data Curation | Formal Analysis | Funding Acquisition | Investigation | Methodology | Project Administration | Resources | Software | Supervision | Validation | Visualization | Writing – Original Draft | Writing – Review & Editing |
|---|---|---|---|---|---|---|---|---|---|---|---|---|---|---|
| Alex M Russell | X | X | X | X | X | X | X | X | X | |||||
| Noel A Vest | X | X | X | X | X | X | X | X | X | X | ||||
| Dana M Litt | X | X | X | X | X | X | X | X | X |
REFERENCES
- Barry AE, Bates AM, Olusanya O, Vinal CE, Martin E, Peoples JE, Jackson ZA, Billinger SA, Yusuf A, Cauley DA, & Montano JR (2016). Alcohol marketing on Twitter and Instagram: Evidence of directly advertising to youth/adolescents. Alcohol and Alcoholism, 51(4), 487–492. 10.1093/alcalc/agv128 [DOI] [PMC free article] [PubMed] [Google Scholar]
- Boyle SC, Earle AM, LaBrie JW, & Ballou K (2017). Facebook dethroned: Revealing the more likely social media destinations for college students’ depictions of underage drinking. Addictive Behaviors, 65, 63–67. 10.1016/j.addbeh.2016.10.004 [DOI] [PMC free article] [PubMed] [Google Scholar]
- Boyle SC, LaBrie JW, Froidevaux NM, & Witkovic YD (2016). Different digital paths to the keg? How exposure to peers’ alcohol-related social media content influences drinking among male and female first-year college students. Addictive Behaviors, 57, 21–29. 10.1016/j.addbeh.2016.01.011 [DOI] [PMC free article] [PubMed] [Google Scholar]
- Cavazos-Rehg PA, Krauss MJ, Sowles SJ, & Bierut LJ (2015). “Hey everyone, I’m drunk.” An evaluation of drinking-related Twitter chatter. Journal of Studies on Alcohol and Drugs, 76(4), 635–643. 10.15288/jsad.2015.76.635 [DOI] [PMC free article] [PubMed] [Google Scholar]
- Christakis NA, & Fowler JH (2013). Social contagion theory: Examining dynamic social networks and humanbehavior. Statistics in Medicine, 32(4), 556–577. 10.1002/sim.5408 [DOI] [PMC free article] [PubMed] [Google Scholar]
- Collins L, & Lanza S (2009). Latent class and latent transition analysis: With applications in the social, behavioral, and health sciences. John Wiley & Sons. [Google Scholar]
- Collins RL, Parks GA, & Marlatt GA (1985). Social determinants of alcohol consumption: the effects of social interaction and model status on the self-administration of alcohol. Journal of Consulting and Clinical Psychology, 53(2), 189–200. 10.1037/0022-006X.53.2.189 [DOI] [PubMed] [Google Scholar]
- Curtis BL, Lookatch SJ, Ramo DE, McKay JR, Feinn RS, & Kranzler HR (2018). Meta-analysis of the association of alcohol-related social media use with alcohol consumption and alcohol-related problems in adolescents and young adults. Alcoholism: Clinical and Experimental Research, 42(6), 978–986. 10.1111/acer.13642 [DOI] [PMC free article] [PubMed] [Google Scholar]
- Deleuze J, Rochat L, Romo L, Van der Linden M, Achab S, Thorens G, Khazaal Y, Zullino D, Maurage P, Rothen S, & Billieux J (2015). Prevalence and characteristics of addictive behaviors in a community sample: A latent class analysis. Addictive Behaviors Reports, 1, 49–56. 10.1016/j.abrep.2015.04.001 [DOI] [PMC free article] [PubMed] [Google Scholar]
- Fat LN, Cable N, & Kelly Y (2021). Associations between social media usage and alcohol use among youths and young adults: Findings from Understanding Society. Addiction. 10.1111/add.15482 [DOI] [PubMed] [Google Scholar]
- IBM. (2019). SPSS Statistics for Windows, Version 26.0.
- Jackson KM, Marceau K, Colby SM, Barnett NP, Rogers ML, & Hayes KL (2021). Trajectories of early alcohol use milestones: Interrelations among initiation and progression. Alcoholism: Clinical and Experimental Research, 45(11), 2294–2308. 10.1111/acer.14723 [DOI] [PMC free article] [PubMed] [Google Scholar]
- Jernigan D, Noel J, Landon J, Thornton N, & Lobstein T (2017). Alcohol marketing and youth alcohol consumption: a systematic review of longitudinal studies published since 2008. Addiction, 112, 7–20. 10.1111/add.13591 [DOI] [PubMed] [Google Scholar]
- Junco R (2013). Comparing actual and self-reported measures of Facebook use. Computers in Human Behavior, 29(3), 626–631. 10.1016/j.chb.2012.11.007 [DOI] [Google Scholar]
- LaBrie JWL, Boyle SC, Young SH, & Tan CN (2021). Prospective relationships between objectively assessed social media use,drinking norms, and alcohol consumption among first-year students. Journal of Studies on Alcohol and Drugs, 82, 339–350. [DOI] [PMC free article] [PubMed] [Google Scholar]
- Lanza ST, Bray BC, & Collins LM (2013). An introduction to Latent Class and Latent Transition Analysis. In Handbook of Psychology (Vol. 2, Issue 2 (194)). [Google Scholar]
- Litt DM, Lewis MA, Spiro ES, Aulck L, Waldron KA, Head-Corliss MK, & Swanson A (2018). #drunktwitter: Examining the relations between alcohol-related Twitter content and alcohol willingness and use among underage young adults. Drug and Alcohol Dependence, 193(October), 75–82. 10.1016/j.drugalcdep.2018.08.021 [DOI] [PMC free article] [PubMed] [Google Scholar]
- Lo Y, Mendell N, & Rubin D (2001). Testing the number of components in a normal mixture. Biometrika, 88(3), 768–778. 10.1093/biomet/90.4.991 [DOI] [Google Scholar]
- Lobstein T, Landon J, Thornton N, & Jernigan D (2017). The commercial use of digital media to market alcohol products: a narrative review. Addiction, 112, 21–27. 10.1111/add.13493 [DOI] [PubMed] [Google Scholar]
- Moreno MA, & Whitehill JM (2014). Influence of social media on alcohol use in adolescents and young adults. Alcohol Research: Current Reviews, 36(1), 91–100. [DOI] [PMC free article] [PubMed] [Google Scholar]
- Moreno M, & Whitehill J (2014). Influence of social media on alcohol use in adolescents and young adults. Alcohol Research : Current Reviews, 36(1), 91–100. [DOI] [PMC free article] [PubMed] [Google Scholar]
- Muthén L, & Muthén B (2018). Mplus. Statistical analysis with latent variables Version 8.4.
- Pew Research Center. (2018). Teens, Social Media & Technology 2018. https://www.pewresearch.org/internet/2018/05/31/teens-social-media-technology-2018/
- Rosenquist JN, Murabito J, Fowler JH, & Christakis NA (2010). The spread of alcohol consumption behavior in a large social network. Annals of Internal Medicine, 152(7), 426–433. 10.7326/0003-4819-152-7-201004060-00007 [DOI] [PMC free article] [PubMed] [Google Scholar]
- Russell AM, Davis RE, Ortega JM, Colditz JB, Primack B, & Barry AE (2021). #Alcohol: Portrayals of alcohol in top videos on TikTok. Journal of Studies on Alcohol and Drugs, 82(5), 615–622. [DOI] [PMC free article] [PubMed] [Google Scholar]
- SAMHSA. (2020). Key substance use and mental health indicators in the United States: Results from the 2019 National Survey on Drug Use and Health. HHS Publication No. PEP19–5068, NSDUH Series H-54, 170, 51–58. https://www.samhsa.gov/data/ [Google Scholar]
- Saunders JB, Aasland OG, Babor TF, De La Fuente JR, & Grant M (1993). Development of the Alcohol Use Disorders Identification Test (AUDIT): WHO Collaborative Project on Early Detection of Persons with Harmful Alcohol Consumption-II. Addiction, 88(6), 791–804. 10.1111/j.1360-0443.1993.tb02093.x [DOI] [PubMed] [Google Scholar]
- Schulenberg JE, & Maggs JL (2002). A developmental perspective on alcohol use and heavy drinking during adolescence and the transition to young adulthood. Journal of Studies on Alcohol, Supplement, 14, 54–70. [DOI] [PubMed] [Google Scholar]
- Simons JS, Wills TA, Emery NN, & Marks RM (2015). Quantifying alcohol consumption: Self-report, transdermal assessment, and prediction of dependence symptoms. Addictive Behaviors, 50, 205–212. 10.1016/j.addbeh.2015.06.042 [DOI] [PMC free article] [PubMed] [Google Scholar]
- Substance Abuse and Mental Health Services Administration (US); Office of the Surgeon General (US). (2016). Highlights of the Surgeon General’s report on alcohol, drugs, and health: At-a-glance key messages of the Surgeon General’s report. https://www.ncbi.nlm.nih.gov/books/NBK424857/pdf/Bookshelf_NBK424857.pdf
- World Health Organization. (2018). Global status report on alcohol and health 2018. http://www.who.int/substance_abuse/publications/global_alcohol_report/msbgsruprofiles.pdf%0Ahttp://www.ncbi.nlm.nih.gov/pubmed/29355346