

ABSTRACT
Aims/Introduction
The aim of the present study was to evaluate the placental expression of glucose transporters GLUT‐1, GLUT‐3, GLUT‐8 and GLUT‐12 in term pregnancies complicated by well‐controlled gestational (GDM) and type 1 pregestational diabetes mellitus (PGDM).
Materials and Methods
A total of 103 placental samples were obtained from patients diagnosed with GDM (n = 60), PGDM (n = 20) and a non‐diabetic control group (n = 23). Computer‐assisted quantitative morphometry of stained placental sections was performed to determine the expression of selected GLUT proteins.
Results
Immunohistochemical techniques used for the identification of GLUT‐1, GLUT‐3, GLUT‐8 and GLUT‐12 revealed the presence of all glucose transporters in the placental tissue. Morphometric evaluation performed for the vascular density‐matched placental samples demonstrated a significant increase in the expression of GLUT‐1 protein in patients with PGDM as compared to GDM and control groups (P < 0.05). With regard to the expression of the other GLUT isoforms, no statistically significant differences were observed between patients from the diabetic and control populations. Positive correlations between fetal birthweight and the expression of GLUT‐1 protein in the PGDM group (rho = 0.463, P < 0.05) and GLUT‐12 in the control group (rho = 0.481, P < 0.05) were noted.
Conclusions
In term pregnancies complicated by well‐controlled GDM/PGDM, expression of transporters GLUT‐3, GLUT‐8 and GLUT‐12 in the placenta remains unaffected. Increased expression of GLUT‐1 among women with type 1 PGDM might contribute to a higher rate of macrosomic fetuses in this population.
Keywords: Diabetes mellitus, Glucose transporter, Placenta
In pregnancies complicated by gestational/pregestational diabetes mellitus, alterations in the placental GLUT expression might lead to an increased glucose flux into the fetal circulation, and thus fetal macrosomia. Study results demonstrated significantly increased GLUT‐1 expression in patients with pregestational diabetes mellitus as compared to women affected by GDM and healthy controls. In addition, in the former group of patients, GLUT‐1 expression was positively correlated with the fetal birthweight. With regard to GLUT‐3, 8 and 12 proteins, no significant differences were observed between diabetic and normoglycemic pregnancies. Increased expression of GLUT‐1 among women with type 1 pregestational diabetes mellitus might contribute to a higher rate of macrosomic fetuses in this population.

INTRODUCTION
Depending on the region of the world, race and ethnic origin, the estimated prevalence of gestational diabetes mellitus (GDM) and type 1 pregestational diabetes mellitus (PGDM) among pregnant women is 5.8–12.9% and 0.16–0.24%, respectively 1 , 2 , 3 . Furthermore, studies performed over the past few decades consistently demonstrate an upward trend in the prevalence of both disease entities worldwide 2 , 4 . One of the main complications of diabetes in pregnancy is fetal macrosomia, occurring in 15–20% and 40–45% of women with GDM and PGDM, respectively, and is associated with an increased risk of birth trauma, asphyxia and emergency cesarean section 3 , 5 . Available data suggest that one of the factors responsible for the occurrence of diabetic fetal overgrowth might be the alterations in the placental transfer of nutrients including glucose, amino acids and lipids 6 .
In the course of gestation, glucose constitutes the basic energy substrate for the developing fetus, and the lack of enzymes necessary for the fetal hepatic gluconeogenesis implicates that its supply is strictly dependent on the transplacental flux from the maternal circulation 7 . Among major determinants of the placental glucose transfer, such as maternal–fetal glucose concentration gradient, uteroplacental blood flow and placental metabolism, the expression and activity of transporting proteins represents one of the most extensively studied factors. To date six proteins comprising the GLUT family of facilitative glucose transporters (GLUT‐1, GLUT‐3, GLUT‐4, GLUT‐8, GLUT‐9, GLUT‐12) have been discovered in the human placenta 8 . Each of the above‐mentioned GLUT isoforms is responsible for sodium‐independent and gradient‐compliant hexose transfer (except for GLUT‐9 and possibly GLUT‐12, which both demonstrate electrogenic properties), and differ with respect to substrate specificity, localization and tissue expression 9 , 10 . In relation to the placenta, emerging evidence emphasizes the importance of alterations in the expression and activity of GLUT transporters in the pathogenesis of various pregnancy complications, in particular those associated with disorders of the intrauterine fetal growth 8 .
According to the Pedersen hypothesis, diabetes in the mother and the associated hyperglycemia in pregnancy leads to the increased flow of glucose to the fetus, triggering a cascade of metabolic changes that lead to fetal hyperinsulinemia and, as a result, excessive fetal growth 11 . Apart from hyperglycemia and hyperinsulinemia, the results of metabolic derangement in diabetic pregnancy include quantitative changes in the concentration of certain hormones (insulin), growth factors (insulin‐like growth factor [IGF] 1 and 2) and cytokines (resistin) involved in the processes of cell growth regulation 12 , 13 , 14 . The results of the recent in vitro studies indicate that one of the mechanisms of action of the above‐mentioned factors might be the stimulating effect on GLUT protein expression in different placental compartments 15 , 16 , 17 , 18 .
In our previous studies, we confirmed increased placental expression of GLUT‐1, GLUT‐4 and GLUT‐9 transporters in pregnancies affected by GDM/PGDM 19 , 20 . In addition, the expression of some GLUT isoforms was positively correlated with the fetal birthweight (FBW), as well as ultrasound markers of the fetal adiposity 20 . With regard to other GLUT proteins found in the placenta, only two studies evaluated the expression of GLUT‐3 in pregnancies with concomitant GDM/PGDM 21 , 22 . However, the studied populations were scarce, and the obtained results did not take into account the potential effect of insulin therapy in patients with GDM. The expression of both GLUT‐8 and GLUT‐12 transporters has not yet been analyzed in the diabetic placenta. The quantitative analysis of expression of the above‐mentioned isoforms in GDM/PGDM population seems to be justified, considering the results of the recent studies demonstrating alterations in the placental expression of GLUT‐3 and GLUT‐8 in pregnancies complicated by fetal growth restriction 23 , 24 . Moreover, as regards GLUT‐12, a stimulating effect of hyperglycemia and insulin on the translocation of the transporter to the cell surface in renal tubules and skeletal muscles was noted, respectively, which might indicate a potential effect of maternal diabetes on the isoform expression in the placenta 25 , 26 .
Regarding all of the aforementioned, the aim of the present study was to evaluate the placental expression of glucose transporters GLUT‐1, GLUT‐3, GLUT‐8 and GLUT‐12 in pregnancies complicated by gestational and type 1 diabetes mellitus.
MATERIALS AND METHODS
Patients
In the period from October 2019 to December 2020, 103 patients who delivered at the 1st Department of Obstetrics and Gynecology, Medical University of Warsaw, Warsaw, Poland, were enrolled in the study. All participants provided written informed consent under protocol approved by the Local Ethics Committee at the Medical University of Warsaw (reference no. KB/150/2013). Only patients aged ≥18 years, in singleton pregnancy >37 weeks without major obstetric complications, such as chronic or pregnancy‐induced hypertension, pre‐eclampsia, chronic renal, cardiac or hepatic disease, fetal malformations or intrauterine fetal growth restriction, were included in the study. In vitro fertilization and smoking constituted additional exclusion criteria.
GDM was diagnosed based on the 75‐g oral glucose tolerance test (OGTT) performed between 24 and 28 gestational weeks in accordance with the criteria defined by the World Health Organization 27 . GDM patients received dietary advice at the initial stage and insulin therapy was introduced only in case of inadequate glycemic control (fasting blood glucose level >90 mg/dL and/or 1‐h postprandial blood glucose level >140 mg/dL). PGDM patients received insulin over the entire course of the pregnancy.
To ensure uniform treatment course, all study participants were recruited from the hospital ambulatory and followed up until the delivery by members of the research team (PJS, AM, DBO). To assess glycemic control in the third trimester of pregnancy in each patient from the GDM/PGDM group, concentration of glycated hemoglobin (HbA1c) was analyzed in blood before delivery by means of immunoturbidimetric assay (VITROS 5600; Ortho Clinical Diagnostics, Raritan, NJ, USA, coefficient of variation <2%, normal range: ≤6%).
Reagents
Rabbit monoclonal recombinant antibody to GLUT‐1 (ab115730), rabbit polyclonal antibody to GLUT‐3 (ab15311) and horse radish peroxidase (HRP) conjugated secondary goat anti‐rabbit IgG (H + L) (ab205718) were purchased from Abcam, Waltham, MA, USA. Rabbit polyclonal antibodies to GLUT‐8 (BS‐4241R) and to GLUT‐12 (BS‐2540R) were obtained from Bioss Antibodies, Woburn, MA, USA. IHC Select® HRP/DAB kit was purchased from Merck Millipore, Darmstadt, Germany.
Immunohistochemistry
A detailed description of the immunohistochemical staining procedure with subsequent morphometric analysis of placental GLUT expression was already published elsewhere 19 . Briefly, immediately after the vaginal delivery or cesarean section, two separate cross‐section specimens from the central and the peripheral region of the placenta were collected from each participant. To minimize the influence of abnormal placental morphology on the comparability of the collected samples, only placentas with central umbilical cord insertion were qualified for this study 28 , 29 . A total of 12 formalin‐fixed paraffin‐embedded 5‐μm sections (three for each GLUT isoform) were prepared from each of the placental specimens. Immunohistochemical staining was performed using an IHC Select® HRP/DAB kit from Merck Millipore and according to the protocol recommended by the manufacturer. The sections were deparaffinized with xylene and rehydrated with graded series of ethanol washes. Antigen unmasking was achieved by heat‐induced epitope retrieval with 10 mM citrate buffer (pH 6.0) for 10 min, and endogenous peroxidase activity was blocked by incubation with 3% H2O2 for 20 min. The sections were subsequently incubated with blocking buffer (10% normal goat serum with 1% bovine serum albumin in Tris‐buffered saline) for 2 h, followed by overnight incubation with primary antibodies at 4°C (GLUT‐1, dilution 1:500; GLUT‐3, dilution 1:500; GLUT‐8, dilution 1:500; GLUT‐12, dilution 1:500). Incubation with secondary goat anti‐rabbit IgG (0.5% v/v) was performed for 1 h at room temperature. To visualize the specifically bound anti‐GLUT primary antibodies, 3,3′‐diaminobenzidine served as the chromogen for HRP, which generates a pink‐brown/reddish‐browntoblack colored polymeric oxidation product. In the final stage, the sections were counterstained with hematoxylin, dehydrated and mounted. Negative control consisted of normal rabbit pre‐immune IgG and absent primary antibody. A Leica DMLB light microscope (Leica Microsystems Cambridge, Cambridge, UK) was used for capturing digital images of the immunostained placental sections.
Density of placental microvessels
Given that endothelial cells do express GLUT proteins, to minimize discrepancy in the results caused by local differences in the density of placental microvessels, identification of the vascular elements in the placental sections was carried out using endothelial cell marker – rabbit polyclonal antibody against CD31 (ab28364; Abcam; dilution 1:50), as described previously 19 . Briefly, using light microscopy with computed morphometry for quantitative analysis (Quantimet 500C+ Image Processing and Analysis System; Leica Microsystems Cambridge, Cambridge, UK), the vascular/extravascular tissular index (V/EVTI) was estimated in the calibrated areas of the placental sections. Each paraffin section underwent three area analyses repeated by two independent observers and the single area measured with the picture analyzer amounted to 714,085 μm2. Table 1 provides the total number of placental specimens, sections and visual fields analyzed in the respective groups.
Table 1.
Summary of the material collected in the study
| Group | Placental specimens | |||||
|---|---|---|---|---|---|---|
| n | Central (A) Peripheral (B) | GLUT‐1 (sections × visual fields) | GLUT‐3 (sections × visual fields) | GLUT‐8 (sections × visual fields) | GLUT‐12 (sections × visual fields) | |
| GDMG1 | 30 | A: 30 | 90 × 3 | 90 × 3 | 90 × 3 | 90 × 3 |
| B: 30 | 90 × 3 | 90 × 3 | 90 × 3 | 90 × 3 | ||
| GDMG2 | 30 | A: 30 | 90 × 3 | 90 × 3 | 90 × 3 | 90 × 3 |
| B: 30 | 90 × 3 | 90 × 3 | 90 × 3 | 90 × 3 | ||
| PGDM | 20 | A: 20 | 60 × 3 | 60 × 3 | 60 × 3 | 60 × 3 |
| B: 20 | 60 × 3 | 60 × 3 | 60 × 3 | 60 × 3 | ||
| Control | 23 | A: 23 | 69 × 3 | 69 × 3 | 69 × 3 | 69 × 3 |
| B: 23 | 69 × 3 | 69 × 3 | 69 × 3 | 69 × 3 | ||
| Total: | 103 | A: 103 | 309 × 3 | 309 × 3 | 309 × 3 | 309 × 3 |
| B: 103 | 309 × 3 | 309 × 3 | 309 × 3 | 309 × 3 | ||
| A + B = 206 | A + B = 2472 × 3 = 7,416 images | |||||
Specimens obtained from central (A) and peripheral (B) regions of the placenta in the respective groups of diabetic patients (GDMG1, diet‐controlled gestational diabetes mellitus; GDMG2, insulin‐controlled gestational diabetes mellitus; PGDM, pregestational diabetes mellitus) and non‐diabetic controls. Three sections have been prepared from each placental specimen for each of the analyzed glucose transporters: GLUT‐1, GLUT‐3, GLUT‐8 and GLUT‐12. Next, from each section a digital camera captured the images of three visual fields in the optical system.
Morphometric analysis of glucose transporters expression
A quantitative immunohistochemistry based on the morphometric software was applied for GLUTs identification in placental sections under light microscopy. All morphometric procedures were carried out twice by two independent researchers. A single analyzed image area amounted to 138,797 μm2 (magnification: ×200). During comparative measurements of GLUT expression in placental tissue samples, the vascular density‐matched samples were analyzed. In each case, the difference between median V/EVTI values did not exceed ±5%.
Statistical analysis
All statistical tests were performed using the R package v.3.6.0 (The R Foundation for Statistical Computing, Vienna, Austria). Continuous variables were compared using the Kruskal–Wallis rank sum test with the post‐hoc Dunn's test, and for categorical variables the χ2‐test with the Bonferroni correction was applied. Data are expressed as the median and interquartile range, or as frequency (%).
The association between GLUTs expression and selected parameters was assessed with the use of Spearman's rank correlation coefficient (rho). The following maternal–fetal parameters were included in the analysis: maternal and gestational age, maternal pre‐pregnancy weight and body mass index (BMI), gestational weight gain, maternal height, glucose concentrations during OGTT, third trimester HbA1c concentration, placental weight and FBW.
To assess observer agreement in immunohistochemical image interpretation, the kappa statistic (ĸ) was applied. The observer agreement was considered almost perfect when the ĸ value was >0.80, and a ĸ value of 0.61–0.80 indicated substantial agreement.
Results were considered statistically significant if the P‐value was <0.05.
RESULTS
Following data collection, 60 women with GDM diagnosis and 20 affected by type 1 PGDM comprised the study group. Among the patients with GDM, 30 were treated solely with diet (GDMG1) and 30 required insulin therapy for the optimal glycemia management (GDMG2). Control group consisted of 23 women in an uncomplicated pregnancy. Demographic and clinical data of the patients were presented in Table 2. Analysis revealed that gestational age was significantly lower in patients with PGDM‐complicated pregnancy as compared to GDM and control groups (P < 0.001). Both pre‐pregnancy weight and BMI were significantly higher among women with GDM treated with insulin (GDMG2) as compared to non‐diabetic patients (P < 0.05). In addition, women with pre‐existing diabetes gained significantly more weight during pregnancy than those diagnosed with GDM (P < 0.05). In relation to OGTT results, a significantly higher fasting glucose (P < 0.01), as well as 1‐h and 2‐h plasma glucose concentrations (P < 0.001) were found in patients with GDM‐complicated pregnancy, as compared to healthy controls. Fasting glucose concentration proved to be an additional, statistically significant differentiation factor between GDM patients treated solely with diet and those requiring therapy with insulin (P < 0.01). In the PGDM group, the median third trimester HbA1c concentration amounted to 5.9%, and was significantly higher than observed in both GDMG1 and GDMG2 groups, (P < 0.001). Furthermore, FBW and placental weight among patients with pre‐existing diabetes were significantly increased as compared with GDMG2/control and GDMG1 groups, respectively (P < 0.05).
Table 2.
Characteristics of study participants in diabetic and control populations
| GDMG1 (n = 30) | GDMG2 (n = 30) | PGDM (n = 20) | Control (n = 23) | P‐value | |
|---|---|---|---|---|---|
| Age (years) | 32 [26.2–35] | 33.5 [28.5–36] | 31.5 [28.7–35.2] | 31 [28–34.5] | 0.60 |
| Gestational age (weeks) | 39 [38.2–39] | 39 [38.2–39] | 38 [37–38] | 39 [38–39] | <0.001* |
| Gravidity | 2 [1–3] | 2 [2–2] | 1.5 [1–3] | 2 [1–2] | 0.67 |
| Parity | 2 [1–2] | 2 [1.2–2] | 1 [1–2.2] | 2 [1–2] | 0.64 |
| Pre‐pregnancy weight (kg) | 65 [58.2–74] | 71 [64–80] | 69.5 [60.5–75.7] | 62 [55–66] | <0.05 † |
| Gestational weight gain (kg) | 9.5 [5.5–13] | 10 [8–12] | 15.5 [9.75–19.25] | 13 [11–15] | <0.05 ‡ |
| Height (m) | 1.64 [1.61–1.68] | 1.65 [1.61–1.68] | 1.65 [1.64–1.68] | 1.65 [1.6–1.72] | 0.89 |
| Pre‐pregnancy BMI (kg/m2) | 23.9 [21.7–26.4] | 25.9 [23.9–29.6] | 25.7 [22.9–26.5] | 21.6 [20.6–24.9] | <0.01 † |
| Fasting plasma glucose (mg/dl) a | 92.5 [88.3–95] | 98.3 [94–104.7] | – | 78 [75–84] | <0.01 § , ¶ |
| 1‐h plasma glucose (mg/dl) a | 171 [144–184] | 188 [138–213.7] | – | 120 [92–138] | <0.001 § |
| 2‐h plasma glucose (mg/dl) a | 150 [114.5–159.5] | 136 [102.2–175.7] | – | 97 [81–113] | <0.001 § |
| Third trimester HbA1c (%) | 5.1 [5.1–5.4] | 5.3 [5.1–5.5] | 5.9 [5.7–6.3] | – | <0.001 ‡ |
| Fetal sex | |||||
| Male | 15 (50%) | 15 (50%) | 12 (60%) | 9 (39.1%) | 0.60 |
| Female | 15 (50%) | 15 (50%) | 8 (40%) | 14 (60.9%) | |
| Fetal birthweight (g) | 3557.5 [3307.5–3810] | 3357.5 [3152.5–3808.7] | 3732.5 [3,430–4152.5] | 3,410 [3,085–3,610] | <0.05 ¥ , ǂ |
| Placental weight (g) | 523 [467–679] | 576.5 [505.7–673.2] | 705 [618.5–719] | 612.5 [499.5–650] | <0.05 # |
| Fetal macrosomia b | 6 (20%) | 3 (10%) | 8 (40%) | 3 (13%) | 0.05 |
Data are expressed as median [interquartile range], or as n (%).
BMI, body mass index; HbA1c, glycated hemoglobin concentration.
Results of the 75‐g oral glucose tolerance test performed between 24 and 28 gestational weeks.
Fetal macrosomia defined as birth‐weight over 4,000 g irrespective of gestational age.
Diet‐controlled gestational diabetes mellitus (GDMG1), insulin‐controlled gestational diabetes mellitus (GDMG2), control versus pregestational diabetes mellitus (PGDM).
GDMG2 versus control.
GDMG1, GDMG2 versus PGDM.
GDMG1, GDMG2 versus control.
GDMG1 versus GDMG2.
GDMG2 versus PGDM.
PGDM versus control.
GDMG1 versus PGDM.
Immunohistochemical techniques used for the identification of GLUT‐1, GLUT‐3, GLUT‐8 and GLUT‐12 revealed the presence of all glucose transporters in the placental tissue (Figure 1a–d). None of the immunoreactions were observed when normal rabbit pre‐immune IgG were used (Figure 1a'–d'). GLUT‐1 represented predominant isoform found in the human term placenta and was primarily localized in the syncytiotrophoblast (ST) and cytotrophoblast (CT) membranes, as well as vascular endothelium (VE; Figure 2a). With regard to GLUT‐3, the transporter expression was found in VE, membranes and cytosol of the ST/CT, and minimally in the villous stroma (VS) (Figure 2b). Immunohistochemical staining using GLUT‐8 antibodies revealed positive reaction in the cytoplasmic compartment of the placental ST and VE (Figure 2c). Similarly, expression of GLUT‐12 isoform was predominantly cytoplasmic and limited to VE and sparsely to VS (Figure 2d).
Figure 1.

Immunohistochemical localization of glucose transporters (GLUTs) in human term placenta: (a) GLUT‐1; (b) GLUT‐3; (c) GLUT‐8; and (d) GLUT‐12. The respective negative controls (a'), (b'), (c') and (d') are also presented. Scale bar = 50 μm.
Figure 2.

Immunolocalization of glucose transporter (a) GLUT‐1, (b) GLUT‐3, (c) GLUT‐8 and (d) GLUT‐12 proteins in the placental tissue at high magnification (×400). CT, cytotrophoblast; ST, syncytiotrophoblast; VE, vascular endothelium; VS, villous stroma.
The conducted analysis of microvessel density did not demonstrate statistically significant differences in the median V/EVTI values between the central and peripheral placental specimens in diabetic and control populations (Figure 3). As a result, further analysis of GLUTs expression was performed altogether for both placental specimens. Median V/EVTI values in the placentas from PGDM‐complicated pregnancies proved to be significantly increased as compared to other groups (P < 0.05; Figure 3).
Figure 3.

A comparative examination of microvessel density in the placental sections ([A] central part, [B] peripheral part of the placenta) using the vascular/extravascular tissular index (V/EVTI); the median values (abstract numbers) and interquartile range. GDMG1, diet‐controlled gestational diabetes mellitus; GDMG2, insulin‐controlled gestational diabetes mellitus; PGDM, type 1 pregestational diabetes mellitus.
The analysis of the kappa statistic revealed substantial inter‐ and intra‐observer agreement in the immunohistochemical image interpretation with the ĸ value exceeding 0.61 for the majority of observations (Figure 4). Quantitative evaluation of glucose transporter expression performed for the vascular density‐matched placental samples demonstrated a significant increase in the expression of GLUT‐1 protein in patients with PGDM as compared with GDM and control groups (P < 0.05; Figure 5). With regard to the expression of the other GLUT isoforms, no statistically significant differences were observed between patients from the diabetic and control populations.
Figure 4.
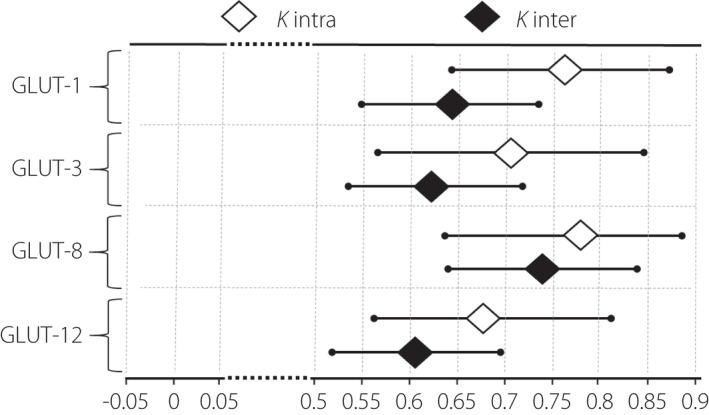
Intra‐ and interobserver agreement calculated for each studied GLUT isoform, measured with 95% confidence interval. The observer agreement was considered good (substantial to almost perfect) when the ĸ value was >0.60.
Figure 5.

Expression of the respective glucose transporters (GLUT‐1, GLUT‐3, GLUT‐8, GLUT‐12) in placental sections: diabetes‐complicated pregnancy (GDMG1, diet‐controlled gestational diabetes mellitus; GDMG2, insulin‐controlled gestational diabetes mellitus; PGDM, type 1 pregestational diabetes mellitus) versus vascular density‐matched non‐diabetic controls. Median of the percent values and interquartile range. The median value in the respective controls was taken as 100%.
The performed analysis demonstrated presence of moderate and positive correlation between the expression of GLUT‐1 protein and FBW in the PGDM group (rho = 0.463, P < 0.05). Maternal pre‐pregnancy weight was positively correlated with GLUT‐8 expression in the GDMG1 group (rho = 0.37, P < 0.05) and negatively among controls (rho = −0.472, P < 0.05). Additionally, the presence of moderate correlations between the expression of GLUT‐3 and GLUT‐8 transporters and maternal pre‐pregnancy BMI was found among patients with GDMG1. In the case of GLUT‐3, the correlation was negative (rho = −0.409, P < 0.05), whereas the latter isoform demonstrated a positive relationship with the maternal BMI (rho = 0.364, P < 0.05). In the same group of patients, the expression of GLUT‐8 transporter remained in moderate, negative correlation with fasting glucose concentration during OGTT (rho = −0.441, P < 0.05). As regards GLUT‐12, the presence of moderate, positive correlation was found between the placental expression of the transporter and FBW (rho = 0.481, P < 0.05) in the group of non‐diabetic pregnancies.
DISCUSSION
In the present study, we performed the quantitative evaluation of the expression of glucose transporters GLUT‐1, GLUT‐3, GLUT‐8 and GLUT‐12 in the human term placenta in pregnancies complicated by gestational and type 1 diabetes mellitus. To our best knowledge, this is the first study evaluating the placental expression of the latter two isoforms in a diabetic population. In accordance with our previously published data, the obtained results demonstrated significantly increased GLUT‐1 expression in patients with PGDM compared with women affected by GDM and healthy controls 19 . In addition, in the same group of patients, GLUT‐1 expression was positively correlated with the FBW. With regard to other GLUT proteins, no significant differences were found between diabetic and normoglycemic pregnancies.
Available evidence suggests that GLUT‐1 constitutes the basic glucose transporter in the human placenta, the positive expression of which was confirmed in ST, CT and VE 8 . It has been generally accepted, that in PGDM‐complicated pregnancies, the expression of GLUT‐1 protein is increased, whereas in the GDM population, the study results are ambiguous, with the majority indicating an increase in the transporter density only in patients requiring insulin therapy 8 . The observed discrepancies in the latter group of patients can possibly be explained by the heterogeneity of study populations, various tissue fractions and methods used for quantitative analyses, as well as differences in GDM diagnostic criteria and thresholds of glycemic control 17 , 19 , 22 , 30 , 31 , 32 . The current results confirm the previously published observations regarding the location of GLUT‐1 in the placenta, increased expression of the transporter in patients with PGDM and the lack of significant differences in the group with GDM 19 , 31 , 33 . Abundance of GLUT‐1 in the trophoblast, combined with the postulated limiting role of the placental syncytium in the transplacental glucose transfer, indicate that the increased expression of the transporter might constitute one of the mechanisms responsible for the excessive maternal–fetal glucose flux and fetal overgrowth in PGDM‐complicated pregnancies 33 . The relative confirmation of this assumption is the positive correlation between the expression of GLUT‐1 and FBW observed exclusively among women with pre‐existing diabetes. Contrary to this observation, in the two recent studies, the authors did not observe any significant correlations between the two parameters among insulin treated GDM, as well as type 1 and 2 PGDM patients 17 , 34 . Instead, in the latter subpopulation of patients, the presence of positive correlations between FBW and neonatal adiposity and the expression of placental proteins responsible for the transport of amino acids and lipids, such as LAT‐1 or FATP6, was demonstrated 34 . The above observations provide evidence that glucose constitutes only one of the possible modulators of intrauterine fetal growth and fat accretion, with lipids being proposed as an even stronger contributor 35 . Nevertheless, an explanation of the observed discrepancies in the correlation analysis might be the fact that, in the two cited studies, the mean pre‐pregnancy BMI was 29–35 kg/m2, thus, the majority of the study population was defined as overweight/obese, whereas in our patients, obesity constituted a rather uncommon finding. One important observation from the present results is the lack of differences found in GLUT‐1 expression in the group of patients with GDM diagnosed at the end of the second and the beginning of the third trimester of pregnancy. It is therefore reasonable to speculate that early pregnancy is the period when the fetoplacental unit and GLUT‐1 expression are characterized by the highest susceptibility to metabolic stimuli associated with maternal diabetes. It is also worth noting that our morphometric analyses revealed higher V/EVTI values in the placentas from PGDM‐complicated pregnancies as compared to the other groups. According to the literature data, high V/EVTI in the placental tissue corresponds with the increased density of the microvessels and represents a manifestation of diabetic microvasculopathy 28 , 36 , 37 .
In our study population, despite optimal glycemic control, the concentration of HbA1c in the third trimester, FBW and rate of macrosomia were the highest in women with PGDM. A probable explanation for this phenomenon is the fact that, in contrast to GDM, PGDM pregnancies are characterized by more severe impairment of glucose homeostasis associated with frequent glucose fluctuations and excursions despite intensive insulin therapy. Despite the fact that, in the available in vitro studies, GLUT‐1 expression in trophoblast remained refractory to intermediate glucose concentrations (1‐12 mmol/L), it is plausible that among PGDM patients, transient hyperglycemic episodes constitute a triggering factor for the metabolic derangement in the fetus, which reciprocally increase transporter expression in the placenta 17 , 38 . For example, the studies performed in well‐controlled PGDM patients demonstrated elevated levels of key growth regulators (e.g., IGF‐1, IGF‐2) in cord blood serum, which were positively correlated with maternal HbA1c, placental weight and FBW 39 . It is notable in this regard that IGF‐1 markedly upregulates GLUT‐1 expression in the basal membrane of the syncytium and stimulates transepithelial glucose transport 15 . Moreover, in relation to PGDM mothers, increased resistin levels present at the beginning of pregnancy constitute a factor with the documented stimulating effect on GLUT‐1 expression in the placenta, being also positively correlated with HbA1c concentration and FBW 14 , 18 .
In the course of further studies, the expression of GLUT‐3 was successively confirmed in VE, VS, ST and CT of the human term placenta 8 . According to the proposed hypotheses, GLUT‐3, being a transporter with a high affinity to glucose, whose highest expression in the trophoblast is found in the first trimester of pregnancy, might ensure energy supply to the fetus in conditions of insufficiently developed uteroplacental circulation during the early weeks of gestation 40 . As regards diabetic pregnancies, in two studies by Kainulainen et al. 21 and Zhang et al. 22 , the authors observed no changes or a decrease in GLUT‐3 expression in the placenta obtained from PGDM or GDMG1‐complicated pregnancies, respectively. The present study including larger populations of meticulously selected patients confirmed the location of GLUT‐3 in the placenta, as well as observations of the former group of researchers. The decreasing expression of GLUT‐3 in the trophoblast in the course of pregnancy, combined with the increasing density of GLUT‐1, indicate that it is the latter of the isoforms that plays a more important role in the transfer of glucose to the fetus in the second half of gestation 40 , 41 . Nevertheless, in certain conditions; for example, reduced uteroplacental blood flow being associated with fetal growth restriction, high affinity to glucose might favor GLUT‐3 and lead to the increase in protein expression in the trophoblast 23 , 42 . In pregnancies with concomitant diabetes, in the case of optimal glycemic control and the lack of vascular complications, the risk of severe placental hypoperfusion is reduced, hence probably in our population of patients the expression of GLUT‐3 remained unaltered 43 .
Despite the fact that studies performed so far indicate GLUT‐8 to be a transporter primarily, if not exclusively, associated with the transfer of hexoses between intracellular organelles, evidence exists that under insulin stimulation, transporter translocates toward plasma membrane in mouse blastocyst and myocardium 44 , 45 , 46 . Furthermore, in BeWo choriocarcinoma cells, commonly used as a trophoblast model, IGF‐1 upregulates GLUT‐8 expression 47 . In the human placenta, the expression of the transporter was demonstrated in the third trimester ST/CT and VE, and an increase of the transporter density was observed in the maternal compartment in pregnancies complicated by fetal growth restriction 24 , 47 . In the current study, regardless of the similarities in placental localization, no significant differences in GLUT‐8 expression were observed between diabetic and control populations. Predominant cytoplasmic staining combined with the observed lack of differences in the density of GLUT‐8 between GDM/PGDM and normoglycemic patients indicate a limited role of the transporter in the trans‐syncytial glucose flux and pathogenesis of diabetic macrosomia.
In the only study published so far regarding the expression of GLUT‐12 in the placenta, Gude et al. confirmed the presence of a transporter in the cytosol of ST and CT in the first trimester of pregnancy, and in VS and vascular smooth muscle cells at term 48 . Similar results in relation to term gestation were obtained in the present study, at the same time indicating VE as a new site of GLUT‐12 expression. As the reported spatio‐temporal change in transporter localization reflects alterations in the placental expression of insulin receptor throughout the pregnancy, it has been postulated that GLUT‐12 might play a role in hormone‐dependent glucose transfer across the placenta 48 , 49 . For example, in the human skeletal muscle, insulin stimulates the translocation of GLUT‐12 to plasma membrane 26 . In trophoblast, a similar phenomenon might occur during the early weeks of pregnancy under the influence of maternal insulin. At term, however, when the fetal growth is most intensified, the expression of GLUT‐12 in the syncytium is minimal, if not absent, and the impact of the fetal insulin on the transporter expression in VE remains to be elucidated. Based on the obtained results; that is, the lack of the presence of GLUT‐12 in trophoblast, as well as the lack of differences in protein density between GDM/PGDM and normoglycemic patients, it seems that the role of the transporter in the pathogenesis of diabetic fetal overgrowth is negligible. In consequence, GLUT‐4 remains a key isoform responsible for the insulin‐dependent transplacental glucose transfer, in particular in the latter half of pregnancy 16 , 19 . Interestingly, GLUT‐12 expression remained in positive correlation with the FBW among non‐diabetic women; however, the explanation for this observation is currently unknown and warrants further investigation.
In conclusion, the results of the present study performed on a relatively large population of patients affected by GDM and type 1 PGDM confirmed the presence of glucose transporters GLUT‐1, GLUT‐3, GLUT‐8 and GLUT‐12 in the human term placenta. In a maternal diabetic environment, GLUT‐1 is the only isoform, the expression of which undergoes quantitative changes and remains positively correlated with the fetal birthweight. Obtained evidence once again emphasizes the importance of GLUT‐1 as one of the key glucose transporters operating in the human placenta, as well as indicates on varied functions of individual GLUT isoforms in the pathogenesis of fetal growth abnormalities.
DISCLOSURE
The authors declare no conflict of interest.
Approval of the research protocol: The study was performed in accordance with the Declaration of Helsinki Ethical Principles and Good Clinical Practices. The Local Ethics Committee of the Medical University of Warsaw approved the study.
Informed consent: All participants signed their written informed consent.
Approval date of registry and the registration no. of the study: ref no. KB/150/2013 obtained on 14 May 2013.
Animal studies: N/A.
ACKNOWLEDGMENTS
The study was supported by the Medical University of Warsaw (grant no. 1W51/M/MB1/N/20).
J Diabetes Investig 2022. ; 13: 560–570
REFERENCES
- 1. Zhu Y, Zhang C. Prevalence of gestational diabetes and risk of progression to type 2 diabetes: a global perspective. Curr Diab Rep 2016; 16: 7. [DOI] [PMC free article] [PubMed] [Google Scholar]
- 2. Peng TY, Ehrlich SF, Crites Y, et al. Trends and racial and ethnic disparities in the prevalence of pregestational type 1 and type 2 diabetes in Northern California: 1996–2014. Am J Obstet Gynecol 2017; 216: 177.e1–177.e8. [DOI] [PMC free article] [PubMed] [Google Scholar]
- 3. Billionnet C, Mitanchez D, Weill A, et al. Gestational diabetes and adverse perinatal outcomes from 716,152 births in France in 2012. Diabetologia 2017; 60(4): 636–644. [DOI] [PMC free article] [PubMed] [Google Scholar]
- 4. Ferrara A. Increasing prevalence of gestational diabetes mellitus. Diabetes Care 2007; 30: S141–S146. [DOI] [PubMed] [Google Scholar]
- 5. Jolly MC, Sebire NJ, Harris JP, et al. Risk factors for macrosomia and its clinical consequences: a study of 350,311 pregnancies. Eur J Obstet Gynecol Reprod Biol 2003; 111: 9–14. [DOI] [PubMed] [Google Scholar]
- 6. Castillo‐Castrejon M, Powell TL. Placental nutrient transport in gestational diabetic pregnancies. Front Endocrinol. 2017; 8: 306. [DOI] [PMC free article] [PubMed] [Google Scholar]
- 7. Kalhan S, Parimi P. Gluconeogenesis in the fetus and neonate. Semin Perinatol 2000; 24: 94–106. [DOI] [PubMed] [Google Scholar]
- 8. Stanirowski PJ, Lipa M, Bomba‐Opoń D, et al. Expression of placental glucose transporter proteins in pregnancies complicated by fetal growth disorders. Adv Protein Chem Struct Biol 2021; 123: 95–131. [DOI] [PubMed] [Google Scholar]
- 9. Mueckler M, Thorens B. The SLC2 (GLUT) family of membrane transporters. Mol Aspects Med 2013; 34: 121–138. [DOI] [PMC free article] [PubMed] [Google Scholar]
- 10. Pujol‐Giménez J, Barrenetxe J, González‐Muniesa P, et al. The facilitative glucose transporter GLUT12: what do we know and what would we like to know? J Physiol Biochem 2013; 69(2): 325–333. [DOI] [PubMed] [Google Scholar]
- 11. Pedersen J. The Pregnant Diabetic and Her Newborn: Problems and Management. Baltimore, MD: William & Wilkins, 1967; 128–137. [Google Scholar]
- 12. Hiden U, Glitzner E, Hartmann M, et al. Insulin and the IGF system in the human placenta of normal and diabetic pregnancies. J Anat 2009; 215: 60–68. [DOI] [PMC free article] [PubMed] [Google Scholar]
- 13. Luo ZC, Nuyt AM, Delvin E, et al. Maternal and fetal IGF‐I and IGF‐II levels, fetal growth, and gestational diabetes. J Clin Endocrinol Metab 2012; 97: 1720–1728. [DOI] [PubMed] [Google Scholar]
- 14. Kapustin RV, Chepanov SV, Babakov VN, et al. Maternal serum leptin, adiponectin, resistin and monocyte chemoattractant protein‐1 levels in different types of diabetes mellitus. Eur J Obstet Gynecol Reprod Biol 2020; 254: 284–291. [DOI] [PubMed] [Google Scholar]
- 15. Baumann MU, Schneider H, Malek A, et al. Regulation of human trophoblast GLUT1 glucose transporter by insulin‐like growth factor I (IGF‐I). PLoS One 2014; 9: e106037. [DOI] [PMC free article] [PubMed] [Google Scholar]
- 16. James‐Allan LB, Arbet J, Teal SB, et al. Insulin stimulates GLUT4 trafficking to the syncytiotrophoblast basal plasma membrane in the human placenta. J Clin Endocrinol Metab 2019; 104: 4225–4238. [DOI] [PMC free article] [PubMed] [Google Scholar]
- 17. Borges MH, Pullockaran J, Catalano PM, et al. Human placental GLUT1 glucose transporter expression and the fetal insulin‐like growth factor axis in pregnancies complicated by diabetes. Biochim Biophys Acta Mol Basis Dis 2019; 1865: 2411–2419. [DOI] [PMC free article] [PubMed] [Google Scholar]
- 18. Di Simone N, Di Nicuolo F, Marzioni D, et al. Resistin modulates glucose uptake and glucose transporter‐1 (GLUT‐1) expression in trophoblast cells. J Cell Mol Med 2009; 13: 388–397. [DOI] [PMC free article] [PubMed] [Google Scholar]
- 19. Stanirowski PJ, Szukiewicz D, Pyzlak M, et al. Impact of pre‐gestational and gestational diabetes mellitus on the expression of glucose transporters GLUT‐1, GLUT‐4 and GLUT‐9 in human term placenta. Endocrine 2017; 55: 799–808. [DOI] [PMC free article] [PubMed] [Google Scholar]
- 20. Stanirowski PJ, Szukiewicz D, Pyzlak M, et al. Analysis of correlations between the placental expression of glucose transporters GLUT‐1, GLUT‐4 and GLUT‐9 and selected maternal and fetal parameters in pregnancies complicated by diabetes mellitus. J Matern Fetal Neonatal Med 2019; 32: 650–659. [DOI] [PubMed] [Google Scholar]
- 21. Kainulainen H, Jarvinen T, Heinonen PK. Placental glucose transporters in fetal intrauterine growth retardation and macrosomia. Gynecol Obstet Investig 1997; 44: 89–92. [DOI] [PubMed] [Google Scholar]
- 22. Zhang B, Jin Z, Sun L, et al. Expression and correlation of sex hormone‐binding globulin and insulin signal transduction and glucose transporter proteins in gestational diabetes mellitus placental tissue. Diabetes Res Clin Pract 2016; 119: 106–117. [DOI] [PubMed] [Google Scholar]
- 23. Janzen C, Lei MY, Cho J, et al. Placental glucose transporter 3 (GLUT3) is up‐regulated in human pregnancies complicated by late‐onset intrauterine growth restriction. Placenta 2013; 34: 1072–1078. [DOI] [PMC free article] [PubMed] [Google Scholar]
- 24. Janzen C, Lei MYY, Jeong ISD, et al. Humanin (HN) and glucose transporter 8 (GLUT8) in pregnancies complicated by intrauterine growth restriction. PLoS One 2018; 13: e0193583. [DOI] [PMC free article] [PubMed] [Google Scholar]
- 25. Wilson‐O'Brien AL, Dehaan CL, Rogers S. Mitogen‐stimulated and rapamycin‐sensitive glucose transporter 12 targeting and functional glucose transport in renal epithelial cells. Endocrinology 2008; 149: 917–924. [DOI] [PubMed] [Google Scholar]
- 26. Stuart CA, Howell ME, Zhang Y, et al. Insulin‐stimulated translocation of glucose transporter (GLUT) 12 parallels that of GLUT4 in normal muscle. J Clin Endocrinol Metab 2009; 94: 3535–3542. [DOI] [PMC free article] [PubMed] [Google Scholar]
- 27. Diagnostic criteria and classification of hyperglycaemia first detected in pregnancy: a World Health Organization Guideline. Diabetes Res Clin Pract 2014; 103: 341–363. [DOI] [PubMed] [Google Scholar]
- 28. Huynh J, Dawson D, Roberts D, et al. A systematic review of placental pathology in maternal diabetes mellitus. Placenta 2015; 36: 101–114. [DOI] [PMC free article] [PubMed] [Google Scholar]
- 29. Zhang P. Comparison of Decidual Vasculopathy in central and peripheral regions of placenta with implication of lateral growth and spiral artery remodeling. Reprod Med 2020; 1: 158–168. [Google Scholar]
- 30. Gaither K, Quraishi AN, Illsley NP. Diabetes alters the expression and activity of the human placental GLUT 1 glucose transporter. J Clin Endocrinol Metab 1999; 84: 695–701. [DOI] [PubMed] [Google Scholar]
- 31. Jansson T, Ekstrand Y, Wennergren M, et al. Placental glucose transport in gestational diabetes mellitus. AJOG 2001; 184: 111–116. [DOI] [PubMed] [Google Scholar]
- 32. Colomiere M, Permezel M, Riley C, et al. Defective insulin signaling in placenta from pregnancies complicated by gestational diabetes mellitus. Eur J Endocrinol 2009; 160: 567–578. [DOI] [PubMed] [Google Scholar]
- 33. Jansson T, Wennergren M, Powell TL. Placental glucose transport and GLUT 1 expression in insulin dependent diabetes. AJOG 1999; 180: 163–168. [DOI] [PubMed] [Google Scholar]
- 34. Castillo‐Castrejon M, Yamaguchi K, Rodel RL, et al. Effect of type 2 diabetes mellitus on placental expression and activity of nutrient transporters and their association with birth weight and neonatal adiposity. Mol Cell Endocrinol 2021; 532: 111319. [DOI] [PMC free article] [PubMed] [Google Scholar]
- 35. Barbour LA, Hernandez TL. Maternal non‐glycemic contributors to fetal growth in obesity and gestational diabetes: spotlight on lipids. Curr Diab Rep 2018; 18: 37. [DOI] [PubMed] [Google Scholar]
- 36. Szukiewicz D, Kochanowski J, Pyzlak M, et al. Fractalkine (CX3CL1) and its receptor CX3CR1 may contribute to increased angiogenesis in diabetic placenta. Mediators Inflamm 2013; 2013: 437576. [DOI] [PMC free article] [PubMed] [Google Scholar]
- 37. Leach L, Gray C, Staton S, et al. Vascular endothelial cadherin and beta‐catenin in human fetoplacental vessels of pregnancies complicated by Type 1 diabetes: associations with angiogenesis and perturbed barrier function. Diabetologia 2004; 47: 695–709. [DOI] [PubMed] [Google Scholar]
- 38. Illsley NP, Sellers MC, Wright RL. Glycemic regulation of glucose transporter expression and activity in the human placenta. Placenta 1998; 19: 517–524. [DOI] [PubMed] [Google Scholar]
- 39. Yan‐Jun L, Tsushima T, Minei S, et al. Insulin‐like growth factors (IGFs) and IGF‐binding proteins (IGFBP‐1, ‐2 and ‐3) in diabetic pregnancy: relationship to macrosomia. Endocr J 1996; 43: 221–231. [DOI] [PubMed] [Google Scholar]
- 40. Brown K, Ds H, Zamudio S, et al. Glucose transporter 3 (GLUT3) protein expression in human placenta across gestation. Placenta 2011; 32: 1041–1049. [DOI] [PMC free article] [PubMed] [Google Scholar]
- 41. Sakata M, Kurachi H, Imai T, et al. Increase in human placental glucose transporter‐1 during pregnancy. Eur J Endocrinol 1995; 132: 206–212. [DOI] [PubMed] [Google Scholar]
- 42. Chang YL, Chao AS, Chang SD, et al. Placental glucose transporter 1 and 3 gene expression in Monochorionic twin pregnancies with selective fetal growth restriction. BMC Pregnancy Childbirth 2021; 21: 260. [DOI] [PMC free article] [PubMed] [Google Scholar]
- 43. Calderon IM, Damasceno DC, Amorin RL, et al. Morphometric study of placental villi and vessels in women with mild hyperglycemia or gestational or overt diabetes. Diabetes Res Clin Pract 2007; 78: 65–71. [DOI] [PubMed] [Google Scholar]
- 44. Schmidt S, Joost HG, Schürmann A. GLUT8, the enigmatic intracellular hexose transporter. Am J Physiol Endocrinol Metab 2009; 296: E614–E618. [DOI] [PubMed] [Google Scholar]
- 45. Carayannopoulos MO, Chi MM, Cui Y, et al. GLUT8 is a glucose transporter responsible for insulin‐stimulated glucose uptake in the blastocyst. Proc Natl Acad Sci USA 2000; 97: 7313–7318. [DOI] [PMC free article] [PubMed] [Google Scholar]
- 46. Maria Z, Campolo AR, Lacombe VA. Diabetes alters the expression and translocation of the insulin‐sensitive glucose transporters 4 and 8 in the atria. PLoS One 2015; 10: e0146033. [DOI] [PMC free article] [PubMed] [Google Scholar]
- 47. Jones HN, Crombleholme T, Habli M. Adenoviral‐mediated placental gene transfer of IGF‐1 corrects placental insufficiency via enhanced placental glucose transport mechanisms. PLoS One 2013; 8: e74632. [DOI] [PMC free article] [PubMed] [Google Scholar]
- 48. Gude NM, Stevenson JL, Rogers S, et al. GLUT12 expression in human placenta in first trimester and term. Placenta 2003; 24: 566–570. [DOI] [PubMed] [Google Scholar]
- 49. Desoye G, Hartmann M, Jones CJP, et al. Location of insulin receptors in the placenta and its progenitor tissues. Microsc Res Tech 1997; 38: 63–75. [DOI] [PubMed] [Google Scholar]