

Graphical abstract

Abbreviations: PTMs, Post-translation modifications; IDRs, Intrinsically disordered regions; SRR, Serine-rich region; IM, Inhibitory module; PT-WTE, Parallel tempering Well-Tempered Ensemble; BE, Biased-exchange; EMSA, Electrophoretic mobility shift assay; RMSE, Root-mean-square error; CS, Chemical shift; FEL, Free energy landscape; DCC, Dynamic correlation coefficient; HRC, Hydrophobic residue clusters; CD, Circular dichroism
Abstract
As the most abundant post-translation modifications (PTMs), the phosphorylation usually occurred on the intrinsically disordered regions (IDRs). The regulation on the structures and interactions of IDRs induced by phosphorylation is critical to the function performing. The eukaryotic transcription factor 1 (Ets-1) is a member of transcription factor family, which participates in many important biological processes. The DNA-binding ability of Ets-1 is auto-inhibited by a disordered serine-rich region (SRR) on the Ets-1. The inhibition ability of SRR is greatly enhanced by the phosphorylation of the serine on the SRR. Nevertheless, the molecular mechanisms of the phosphorylation regulation on the structure and activity of Ets-1 are still unclear and under debates. By using both of the molecular simulations and biochemical experiments, we studied the molecule mechanism of phosphorylation regulation on the auto-inhibition of the Ets-1. The reasons of stabilization of Ets-1 core by phosphorylation on SRR region were elucidated. More important, the free energy landscapes (FEL) show that both of the steric hindrance and allosteric regulation are responsible for the DNA-binding inhibitory induced by phosphorylation, but the steric effects contribute greater than the allosteric regulation. The phosphorylation not only enhances the electrostatic interactions to facilitate the steric impedance, but also promotes the formation of hydrophobic residue clusters, which provide major driven force for the allosteric regulation. The structural basis of auto-inhibition of Ets-1 induced by the phosphorylation revealed in this study would great help the developing of inhibitor for the cancer therapy.
1. Introduction
Post-translational modifications (PTMs) always regulate the protein function [1], [2]. PTMs remarkably alter the conformations and dynamics of proteins, and play critical roles in most biological processes and many fatal diseases [3], [4]. Up to date, more than 400 different types of eukaryotic post-translational modifications (PTMs) are identified [5]. As the most abundant PTM in the physiological conditions, protein phosphorylation attaches a phosphate (PO4) group to the oxhydryl oxygen of the residue serine, threonine or tyrosine, which plays critical roles in protein synthesis, cell cycle and signal transduction [6], [7]. The experimental and bioinformatic evidences show that the phosphorylation sites are enriched in the intrinsically disordered proteins (IDPs) and regions (IDRs) [8], [9], [10]. The highly dynamic structures of these proteins are able to facilitate the accessing of kinases to the targeting sites, which also raise great challenges for the understanding of the regulation mechanism [11].
Many models have been proposed to describe the structural translation and function performing processes of IDPs. In the “coupled folding and binding” model, the IDPs would fold to ordered structures in the progress of binding [12], [13], [14]. The widely-known example of this model is the phosphorylated kinase induced domain (pKID), which folds into the two well-defined α-helical structure while binding with the KIX domain [15], [16]. On the other side, many evidences show that some IDPs would interact with their binding partners by a fuzzy manner while no induced, persistent structures formed after binding [17], [18]. It is still hard to know why without changing the structure orderliness of the protein, the binding affinity and functions of IDPs would change greatly by the regulate factors such as phosphorylation.
The eukaryotic transcription factor 1 (Ets-1) is a model system to study the regulations on IDP structures and function by phosphorylation [19], [20], [21], [22], [23]. Ets-1 controls many important biological processes, and aggressively expressed in tumor cells [24], [25]. The inhibition of Ets-1 activity is an efficient way to combat related diseases. Ets-1 performs the transcription activity by binding with double-strand DNA (dsDNA) via the C-terminal Ets-1 core domain (Fig. 1) [19], [26]. A disordered serine-rich region (SRR) is connected to the N-terminus of the Ets-1 core domain, after the phosphorylation of the serine residues (especially S282 and S285) on the SRR, the peptide would act as the auto-inhibitor which dramatically depress the binding of Ets-1 and dsDNA (Fig. S1) [20].
Fig. 1.

The structure domains of Ets-1. (A) The domain composition of Ets-1. The DNA binding domain (Ets-1 core domain) is located in the C-terminal, which is conjunctly follow a disordered serine-rich region (SRR). Two phosphorylation sites (Ser282 and Ser285) are labeled by two blue points. (B) The bound structure of Ets-1 and double-strand DNA. The structure of Ets-1 protein is composed of a mainly helical DNA-binding domain (Ets-1 core domain), and the binding is achieved by the insertion of helix 3 (H3) on Ets-1 domain to the DNA groove. The structure models were built based on the structure in PDB (PDB ID: 1MDM). (For interpretation of the references to color in this figure legend, the reader is referred to the web version of this article.)
One plausible explanation for the SRR inducing inhibition is called steric mechanism [20]. The “steric mechanism” is corresponding to the direct interactions between the SRR region and the helix 3 (H3) of the Ets-1 core domain. The H3 region would insert into the groove of dsDNA, and the positive residues on H3 form stable electrostatic interactions with the negative charged bases of DNA. The extra negative charges on SRR induced by phosphorylation enhance the interactions between the SRR and H3, and impede the insertion of H3 to the dsDNA groove and inhibit the activity of transcription. The steric mechanism is supported by NMR experiments and computational simulations [27]. However, Desjardins et al. found that the DNA and the Ets-1 protein still have high binding affinity even the electrostatic interactions are shield by the high concentration ions added into the solution [23], which indicate the steric mechanism attributed to the electrostatic interactions is not enough to fully depict the phosphorylation regulation of auto-inhibition ability of Ets-1.
Alternatively, the aromatic residues and hydrophobic residues are found important to the interaction and regulation of IDPs [23], [27], [28]. The post-translation modifications on the IDPs would change the charge distribution and solvent environment around the PTM sites and further regulate the local and global structures of IDPs. For the Ets-1, the aromatic residues and phosphoserines in its inhibitory element SRR were found synergistically contributes to inhibit the DNA-binding affinity [23]. Desjardins et al. found that the mutations of the aromatic residues to alanine by the mutagenesis experiments, especially the Y283A or F286A greatly suppress the inhibitory ability of the pSRR [23]. Besides, based on the relaxation dispersion and chemical shift perturbation experiments, Lee et al. found that the phosphorylation on SRR is able to decrease the conformational flexibility of the Ets-1 domain, and they hypothesized that the global flexibility of Ets-1is corresponding to its binding affinity to the dsDNA [19]. Therefore, the phosphorylated SRR is proposed to allosterically modulate the structure of DNA-binding interface by the hydrophobic interacting with the inhibitor module interface. Nevertheless, the detailed mechanism of allosteric regulation of pSRR to the ETS-1/DNA binding is still unclear.
In this work, we aimed to elucidate the atomistic details of the regulation mechanism of the pSRR on the Ets-1 core domain by combining the theoretical simulation and experimental methods. We first performed the PT-WTE metadynamics simulations on the structure ensembles of free SRR and pSRR. The biased-exchange metadynamics (BE-MetaD) simulations were further employed to study the interactions and regulations between SRRs and Ets-1 core domain. Both of the steric hindrance and allosteric regulation are observed. The electrophoretic mobility shift assay (EMSA) experiments were employed to demonstrate the crucial roles of hydrophobic interactions revealed by the simulations. Our work revealed the regulation mechanism of phosphorylation on the structures and function of IDR, which also would great help the developing of inhibitor drugs for the cancer therapy.
2. Results
2.1. The effects of phosphorylation on free SRR.
The structure ensembles of free state phosphorylated and unphosphorylated SRR peptides were characterized by the parallel tempering metadynamcis combined with well-tempered ensemble (PTMetaD-WTE) simulations. Both of the SRR and phosphorylated SRR (pSRR) stay to be disordered structures in the simulations. The residual secondary chemical shifts (ΔδCS) of the simulated structural ensembles are compared with the experimental measurements (Fig. S2) [23]. The ΔδCS obtained by the computational simulations are consistent with the experiment measurements, with the root-mean-square error (RMSE) of N-atom ΔδCS is 0.67 ppm for pSRR and 0.73 ppm for SRR, and RMSE of HN ΔδCS is 0.12 ppm for pSRR and 0.11 ppm for SRR, respectively. The RMSE values are close to the system errors of the chemical shift calculating tool [29]. The results indicate that the structure ensembles obtained in our work could accurately describe the conformational space of the free SRR and pSRR.
The HN-atom secondary chemical shifts of all residues are approximated to 0, which means no stable α-helices or β-strands form on the free pSRR and SRR. The populations of helicity and β-sheet elements are lower than 3% in both of free pSRR and SRR, but the β-turn forms extensively on the free SRR and pSRR with occupancies of many residues are over 50% (Fig. 2A). The phosphorylation on residues S282 and S285 of SRR would increase the β-turn formation around the residue S285 (labeled by the dashed box in Fig. 2A), which is mainly induced by the interactions between negative charged group on phosphorylated S285 and the positive charged residues such as Arg278. The phosphorylation can also shift the conformational space toward the compact structure. More conformations with small radius gyration (less than 7Å) are observed in pSRR (Fig. S3). The results are consistent with the experiment observations that the phosphorylation partially dampens the flexibility of the unstructured SRR [20]. Most of the long-range interactions induced by the phosphorylation are composed by the hydrophobic residues (Fig. 2B), such as the interactions between residues Val288 and Tyr 292, Tyr291 and Leu295, Tyr291 and Ala296, etc. The enhancement of the hydrophobic interactions induced by phosphorylation was also found in the kinase-induced domain (KID) [30], which indicates the common feature of phosphorylation regulation on IDPs.
Fig. 2.

The structure differences between the free state of wild-type SRR and phosphorylated SRR (pSRR). (A) The β-turn structure occupancy on the free pSRR and SRR; (B) The pair-wise contact probabilities of residues in the SRR and pSRR. The hydrophobic and aromatic residues on SRR/pSRR are labeled by the asterisks.
2.2. The regulation on Ets-1 core domain by the pSRR binding
To obtain the regulation mechanism of the Ets-1 activity inhibited by the phosphorylation on the SRR region, the free-energy landscapes of pSRR and Ets-1 core domain binding (ΔN2792P, residues 279 to 440) were characterized by the BE-MetaD simulations. Based on the chemical shift perturbations, Pufall et al. found that the pSRR mainly interacts with two regions of Ets-1 core domain: one is so-called the inhibitory module (IM) which consists of the helices HI-1, HI-2, H1 and H4; the other region is the DNA binding interface, which corresponding to the helix 3 (H3) [19]. The large CS perturbation regions in our simulations are mainly located on the IM interface and DNA binding interface, which are consistent with the experimental observations [23].
The overall structure changes of the Ets-1 induced by the pSRR are analyzed based on the free energy landscapes (Fig. 3A). The x-axis describes the interactions between pSRR and IM interface of Ets-1. The contact numbers of hydrophobic residues within the Ets-1 core domain (y-axis value) are corresponding to the structural dynamics and fluctuation of the domain. Two major minima (state a and b) could be characterized on the free energy landscapes, and their representative structures with respect to the minima are given in Fig. 3B. The lowest free energy minimum (state a) is located in the region with the fraction of native contact close to 200, and the structures in this state are similar to the experimental native structure of Ets-1. The contact number between the IM interface and pSRR in state a is close to 0, indicates that the pSRR does not contact with the IM interface in most of the structures (the population of structures in state a is about 82%). On the other hand, pSRR interacts with the IM interface in the second lowest free energy minimum (state b), the number of contacts between residues on pSRR and IM interface are larger than 5. The contact number between the inner hydrophobic residues in the state b is about 3/4 of that in the experiment structure, which indicates many of the core contacts within the hydrophobic residues of the Ets-1 are disrupted by the pSRR in the state b.
Fig. 3.
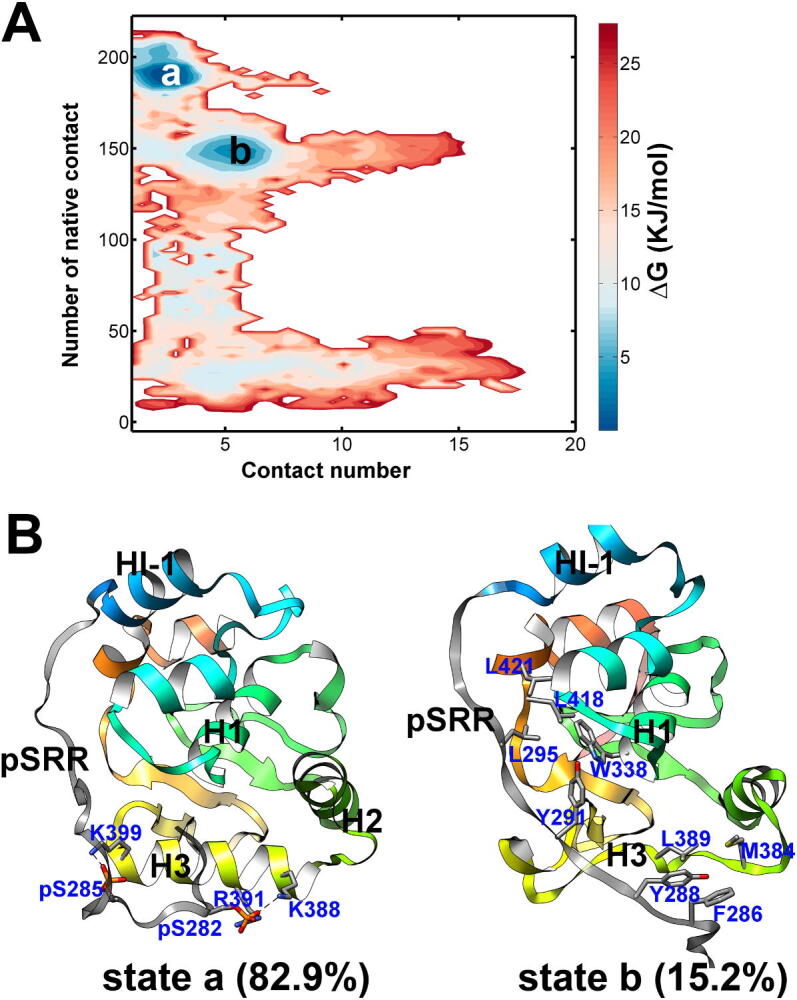
The regulation of Ets-1 domain structure by the pSRR binding. (A) The free energy landscapes to describe the regulations on Ets-1 by pSRR binding. The x-axis describes the interactions between pSRR and IM interface of Ets-1. The y-axis values are the number of contact atoms which are contact in the native experimental structure of the Ets-1 core domain. (B) The representative structures of free energy state a and b are given.
The interactions between the residues on pSRR and Ets-1 core domain in state a and b are given in Fig. 4A and Fig. 4B, respectively. In state a, the pSRR mainly interacts with H3 through the electrostatic interactions between the phosphorylated serine on the pSRR and positive charged residues on the H3 (blue circles in Fig. 4A). Alternatively, the hydrophobic contacts between residues on pSRR and the IM interface regions (including H1and HI-2) are most populated in the state b (Fig. 4B). The contacts with high probability in the two states are given in Fig. 4C. In state a, the negatived phosphorylated serine residues interact with the positive charged residues with high probability, the hydrogen bond occupancy is 86% for pSer282 and K388, 76% for pSer282 and R391, and 91% for pSer285 and K399. The above interactions drive the pSRR contact with H3 of Ets-1, which prevents the Ets-1 binding with DNA via the so-called steric mechanism. The aromatic residues also play important roles in the pSRR-H3 interaction, including the caution-π interactions between Arg279 and the aromatic residue Tyr395, and the hydrophobic interactions between Tyr291 and Ile401. Meanwhile, pSRR mainly interact with the inhibitor module (IM) by the aromatic interactions, including residue Tyr288 on pSRR and W338 on H1, and the Phe286 with Trp375 on H2. The aromatic residues on pSRR (Phe286, Tyr288 and Tyr291) also have high probability to contact with the hydrophobic residues Met384, Leu389, Ile401 on Ets-1 in the state b.
Fig. 4.

The residue contacts between pSRR and Ets-1 domain. (A) The contact map of pSRR and Ets-1 in state a; (B) The contact map of pSRR and Ets-1 in state b. (C) The residue pairs with large contact probabilities in the two states.
2.3. The allosteric regulation on Ets-1 by pSRR.
As shown in the free energy landscape of pSRR and Ets-1 binding (Fig. 3A), the interactions between pSRR and IM would greatly reduce the inner contacts of Ets-1. The average segment helicities are calculated to evaluate the structure stability of the helical regions (Fig. 5A). The results show that all the helices are very stable in the state a, the helicities of all helical segments are larger than 80%. However, the H3 in the state b is basically unstructured (the helicity is about 20%). Unlike only the interactions between the pSRR and H3 were observed in the state a, there are many interactions between pSRR and the inhibitor module region of the Ets-1 (Fig. 4C), which might contribute to the unfolding of H3.
Fig. 5.

Structures and residue interactions of the Ets-1 core domain. (A) the helicity of helical segments in state a and b. (B) the occupancy of contacts formed in state a and b, the hydrophobic residue pairs are colored in black and charged residues are colored in blue, the residues pair labeled by asterisks are not contact to each other in the experimental structure; (C) the overlapped Ets-1 core regions of the experimental structure (colored by semitransparent green) and representative structure of state a of ΔN2792P, the α-helices are colored in blue, the β-strands are colored in orange and the coils are colored in gray, the hydrophobic and aromatic residues are shown in stick; (D) the overlapped Ets-1 core regions of the experimental structure (colored by semitransparent green) and representative structure of state b of ΔN2792P,The color scheme of the structures is the same as state a. (For interpretation of the references to color in this figure legend, the reader is referred to the web version of this article.)
To investigate the possible connections between the binding of IM interface and the structure of H3, we analyzed the contact differences in the state a and b. The residue pairs with large contact differences are given in Fig. 5B. The hydrophobic interactions are colored in grey and the electrostatic interactions in blue. The contact pairs which are not present in the native experiment structure of Ets-1 are labeled by asterisks. Compared with the state a (Fig. 5C), the core domain contacts are lost in the structures of state b (Fig. 5D). For example, the aromatic residues Trp338 on H1 and Tyr396 on H3, and the hydrophobic residues L393 on H3 and I402 or Y412 on H4 (Fig. 5C). The loss of interactions between H1 and H4 with H3 would reduce the structure stability of H3. As shown in Fig. 5A, all the helical structures stay stable except the H3, which further result in the destruction of the protein-DNA binding interface and inhibit the DNA binding activity.
2.4. The interaction of unphosphorylated SRR and Ets-1 core domain.
The interactions between unphosphorylated SRR and Ets-1 domain were also characterized by the enhanced sampling simulations. The free energy landscapes and effects of the binding are given in Fig. 6A. Unlike only two free energy minima present on the FEL of ΔN2792P system, multiple states (the states a-e are labeled) are observed in the of FEL of ΔN279 system (unphosphorylated SRR and Ets-1 core domain). In the state a, the SRR region is away from the Ets-1 domain (Fig. 6B), therefore, almost no residue contacts between SRR and Ets-1 domain are observed in this state (Fig. S4A). In state a, the overall structures of Ets-1 domain are stable, but the helicity of HI-1 is ∼ 70% and H4 is 75%, which means these two helices are partially unfolded (Fig. S5). The SRR interact with Ets-1 via a fuzzy manner in state b by forming transient interactions between SRR and Ets-1 core domain, including HI-1, HI-2, H3-H4 loop and H4 (Fig. S4B). The interactions between SRR increase the stability of HI-1 and H4, the helicity of them in state b are 80% and 85%, respectively. The contact propensity between residues L295 on SRR and residue L421 on H4 is as high as 90% in state c (Fig. S4C). The helix 3 (H3) are basically unfolded in the state d and state e, in which the N-terminus of H3 is unfolded in the structure of state d but the C-terminus of H3 is unfolded in state e. The structures of H3 are perturbed by the direct interactions between residue Y283/E290 on SRR and Y396/D399 on Ets-1 H3 in the state d (Fig. S4D). However, similar to the state b of ΔN2792P, there is no straightforward interaction between SRR and Ets-1 H3 in state e (Fig. S4E), the allosteric effects might contribute to the unfolding of H3 in this state, i.e., the aromatic interaction between residues Y283 on SRR and residues on the HI-1 and HI-2.
Fig. 6.

The regulation of contacts by SRR binding. (A) The free energy landscapes to describe the regulations on Ets-1 by SRR binding. The meaning of x-axis and y-axis are the same as Fig. 3A. (B) The representative structures of free energy minima. The population of the states are given.
The reweighted populations of structure in different states are estimated. The largest state (state a) contains about 45% structures, and the populations in state b and state c are about 25% and 12%, respectively. The native hydrophobic interactions and the helicity of DNA-binding region (H3) are mostly preserved in these three states. There are no strong interactions between SRR and H3 in these states, which means the steric hindrances are absent in ΔN279 system. The H3 of the structures in state d and e are basically unfolded, however, less than 10% conformations adopt these kinds of structures (about 3% and 5% conformations in state b and e, respectively).
The phosphorylation on SRR not only increase the interactions between SRR and Ets-1, but also stabilize the overall structure of Ets-1, as well as the helix HI-1 and H4. The helicity of HI1 in the ΔN2792P is about 95% but decrease to 75% in the unphosphorylated ΔN279 (Fig. 7A). Our simulation results are consistent with the relaxation dispersion experiments, Pufall et al. found that the ΔN301 without the N-terminal IDR region is much more dynamic and motion quickly, as the phosphorylation and activity inhibition would reduce dynamic and correlations in the hydrophobic core within Ets-1 [19]. The dynamic correlation coefficient (DCC) matrix between the residues inner Ets-1 regulated by phosphorylation on SRR based our simulation results are consistent with the experiment observations (Fig. 7B, 7C and Fig. S6). In the DCC of ΔN279 system, the dynamic correlation is much more than those in the DCC of ΔN2792P system, especially the DCC related to the region HI-1, H1, H3 and H4 regions.
Fig. 7.
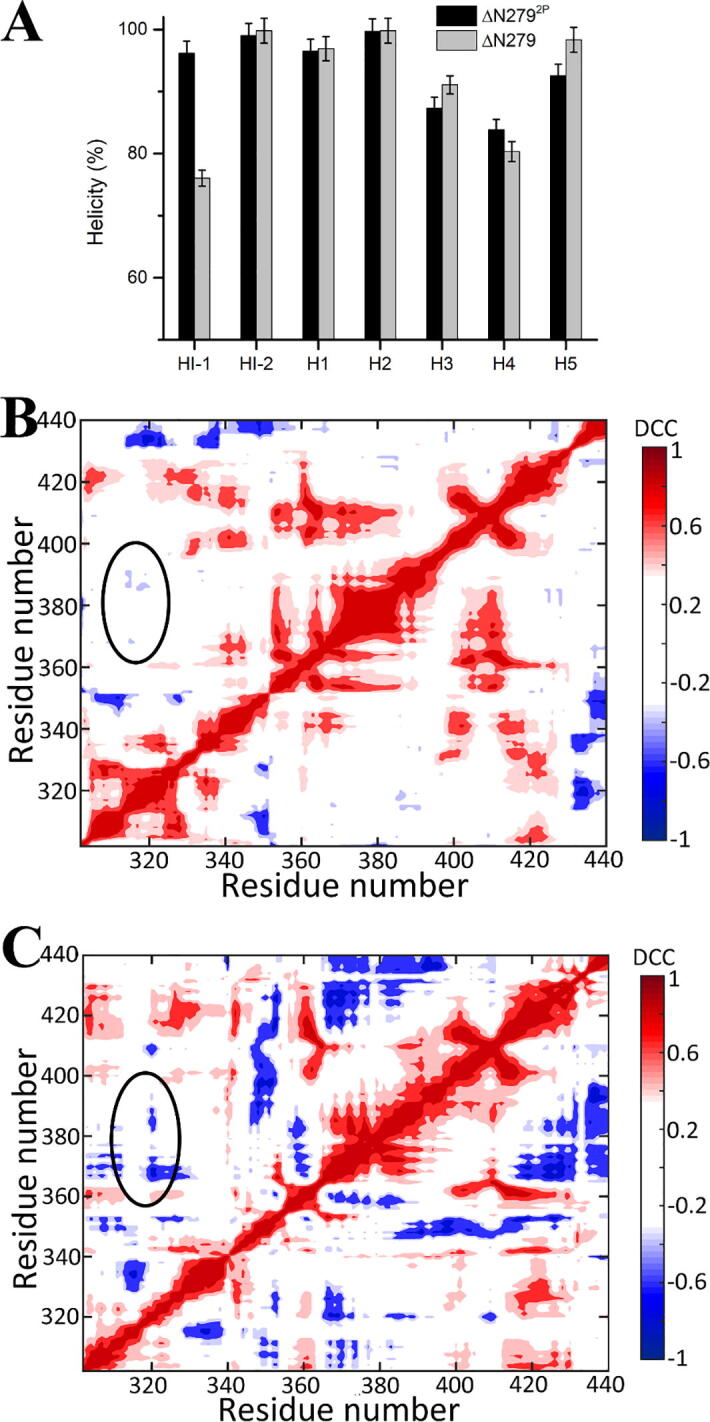
The structure difference of ETS-1 domains binding with pSRR or SRR. (A) The dynamic correlation coefficient (DCC) of the residues inner ETS-1 binding with pSRR; (B) The dynamic correlation coefficient (DCC) of the residues inner ETS-1 binding with SRR. (C) Helicity of different fragments on Ets-1 core domain.
2.5. EMSA experiments on Ets-1 and dsDNA binding.
The important roles of the inner hydrophobic interactions of the Ets-1 domain in the inhibitor module and DNA-binding interface communication are found in our simulations. To further demonstrate the computational observations, four mutants of the Ets-1 core domain (ΔN301) were designed to investigate the effects of inner hydrophobic interactions to the DNA binding affinity, including MT1 with L337A/W338A, MT2 with L393A/Y396A, MT3 with L337A, MT4 with W338A. The binding ability of WT and MT ΔN301 with the double-strand DNA were estimated by electrophoretic mobility shift assay (EMSA) experiments. The EMSA results of the DNA migration rate in the presence of wild-type ΔN301 and mutant ΔN301 are given in Fig. 8. The fluorescence light of fully free DNA is in the position of 27 bp (Fig. 8), and the DNA migration rate are graduate decreased with the increasing of protein concentration (Fig. S7). For the wild-type ETS-1, the DNA migration is extremely slow when the protein:DNA ratio greater than 8:1, which means most of DNAs are bound with the WT Ets-1. On the other side, the migration of DNA is not affected by the Ets-1 mutants, all the mutants (MT1 to MT4) hardly bind with DNA even if the concentration of protein increase to 1.6 μM (Fig. S7).
Fig. 8.

Electrophoretic mobility shift assays of ETS-1 binding with DNA. MT1: L337A/W338A mutant; MT2: L393A/Y396A mutant; MT3: L337A mutant; MT4: W338A mutant.
The circular dichroism (CD) profiles on the wild-type ΔN301 and the L337A, W338A mutants are essentially superimposable, indicating the mutations do not alter the overall secondary structure (Fig. S8). The site-directed mutations of MT1, MT3 and MT4 are located on the helix H1, and MT2 are located on the helix H3. The DNA binding affinity differences revealed by the EMSA experiments demonstrated the importance of the inner hydrophobic network of the Ets-1 core domain. The loss of DNA-binding ability indicates the change of H3 structure and the damage of the DNA-binding interface on Δ301 mutants. The mutations of L337A or W338A in MT3 and MT4 are far away from the DNA-binding interface, which demonstrate the communications and allosteric effects between the IM interface to the DNA binding interface.
2.6. The effects of phosphomimic residues.
The serine substitution with glutamates or aspartates on the position 282 and 285 increased the inhibition to ∼70-fold, which is much lower than the ∼1700-fold inhibition ability of phosphorylation on these two sites [23]. To understand the differences of regulations on SRR structures and inhibition ability induced by the phosphomimic and phosphorylation, we compared the free energy landscapes of the S282D/S285D mutant SRR with wild-type SRR binding with Ets-1 domain. The free energy surface of MT-SRR binding with Ets-1 has similar properties with the FES of WT-SRR binding, which contains multiple states with comparable population and free energy values (Fig. S9). Like the unphosphorylated SRR, the allosteric regulation in the binding of mutant SRR and Ets-1 domain is very weak. Hardly no aromatic interactions were observed for the binding of mutant SRR and Ets-1 domain, neither in the DNA-binding interface nor in the inhibitory module. The most common interactions between the MT-SRR and the Ets-1 domain are between the mutate negative charged residue D285 with the positive charged residues K381 and K388, which on or around the DNA binding interface. The overall percentages of the contact formation are 55.6% and 36.8%, respectively. The instant interactions could not permanently impede the DNA-binding, but could partly compete with the DNA to bind with the H3 interface. The absent of allosteric regulation indicates the important role of phosphorylation to the hydrophobic interactions between SRR and IM.
3. Discussion
3.1. The structure dynamics of Ets-1 domain
Only two major states were observed on the free energy surface of Ets-1 binding with pSRR (ΔN2792P), and the free energy of the lowest minimum is much lower than the second lowest minimum (the free energy difference is larger than 1 KBT). The results indicate the system would stably stay in the lowest-energy state, it is low probability for the conformation exchanges happen. Nevertheless, there are multiple states on the free energy surface of Ets-1 binding with SRR (ΔN279). The free energy differences between these states are relatively small, it is easy for the system’s transitions between these states. Moreover, revealed by the NMR chemical shift and HX dispersion experiments [19], the phosphorylation mainly affects the flexibility of the HI-1 region, which is consistent with the helicity difference of HI-1 observed by our simulations (Fig. 7C). As the high propensity of the binding between pSRR and Ets-1 core domain, we infer that the position and structure of HI-1 are restrained by the pSRR connecting to this region.
3.2. Hydrophobic residue clusters promoted by phosphorylation
The phosphorylation would promote the formation of hydrophobic residue clusters. More hydrophobic interactions are observed in the free state of pSRR than in the free state of SRR (Fig. 2B), such as V280 and Y283/Y291, F286 and Y291, etc. The hydrophobic and aromatic residues hydrophobic/aromatic residue clusters are also observed in the ΔN2792P system (Fig. S10). There are many conformations have larger contact atom number between the side-chains of aromatic residues Y283, F286 and Y291 in the ΔN2792P than in the ΔN279. The formation of HRC would facilitate the interaction with hydrophobic residues on the DNA-binding interface and inhibitor module. Actually, the hydrophobic residue clusters also contribute to promote the binding of phosphorylated kinase inducible domain (KID), an intrinsically disordered protein, with its partner KIX domain [30]. The common features found in both of Ets-1 and pKID systems indicate the synergic effects of phosphorylation and hydrophobic residue interactions. The phosphorylation would change the local environment such as solubility of solutes, which help drive a hydrophobic clustering of the hydrophobic/aromatic residues on the IDPs and the receptor proteins. This would result in specific and efficient binding of the IDPs with their partners.
3.3. The autoinhibition mechanism of phosphorylation.
Our simulations demonstrated the phosphorylation on SRR regulate the DNA binding ability of Ets-1 domain by both of the steric and allosteric mechanisms. (1) The steric mechanism. The phosphorylated serine on pSRR peptide is attached to the positive charged residues on the DNA-binding interface of Ets-1, which would prevent the interactions between Ets-1 and DNA without damaging the structure of Ets-1 domain. The strong electrostatic interactions between the negative charged phosphorate group on pSRR with positive charged residues K383, R391 and K399 on the H3 would facilitate the binding between pSRR and Ets-1, and block the insertion of H3 to the DNA grooves (Fig. S11A). More than 80% structures obey the steric mechanism, which indicates that the steric effects are the major reason for the inhibition of DNA-binding ability. (2) The allosteric mechanism. For this mechanism, the phosphorylated SRR mainly contact with the residues on the inhibitor module by hydrophobic or aromatic interactions. Although the pSRR would not direct contact with H3, the helical structure of H3 is unstructured by the allosteric effects between pSRR/H1 and H1/H3. The inner hydrophobic network involving residues in H1 and H3 bridges the inhibitory module and the DNA-binding interface [20]. Once the helix is unstructured, H3 can’t insert to the DNA groove due to the flexibility of the peptide and therefore prevent the Ets-1 binding with DNA (Fig. S11B). The conformation population related to the allosteric mechanism is about 15%, and both the steric and allosteric mechanisms contribute to the auto-inhibition promoted by the phosphorylation on the SRR region.
On the other hand, the interactions between the unphosphorylated SRR and Ets-1 core domain are unstable and transient. There is no permanent existing contact between the SRR and the DNA-binding interface, which means the steric effects are inconsequential in the interactions between SRR and Ets-1 core domain. Nevertheless, the allosteric mechanism might contribute to the inhibition of DNA-binding activity of ΔN279. The interactions between SRR and inhibitory module interface would induce the partial unfolding of helix H3, though it is very infrequently happened (the ratio of such conformations is less than 5%). Therefore, the presence of unphosphorylated SRR has limit effects on the DNA-binding activity of Ets-1.
4. Conclusions
The intrinsically disordered proteins are indispensable in cellular signaling and regulation. The fully characterization of the structure ensembles and dynamics are important to their functions and related diseases. In this study, the phosphorylation regulation on the structure and binding mechanism of intrinsically disorder region SRR, which plays as the auto-inhibitor for transcription factor Ets-1. Based on the enhances sampling simulations, we found the phosphorylation does not change the unstructured nature of the SRR, but increase the compact conformation ratio and inner hydrophobic contacts.
The inhibition mechanism of phosphorylated serine on SRR to the Ets-1 transcript activity are further studied by the computation simulations and biochemistry experiments. The results show that both the steric and allosteric mechanisms contribute to the inhibition. The phosphorylation on Ser282 and Ser 285 enhance the electrostatic interactions between pSRR and H3 on Ets-1 core domain, which would drive the peptide contact with the DNA-binding interface and prevent the binding with the dsDNA. Furthermore, the phosphorylation would increase the hydrophobic residue clusters and amplify the hydrophobic interactions between residues in pSRR and IM interface, which would further destroy the hydrophobic network within the Ets-1 core domain, provide the major contributions to the allosteric regulation of phosphorylation. The electrophoretic mobility shift assay (EMSA) experimental results demonstrate the crucial roles of hydrophobic interactions in the binding affinity of Ets-1 mutants with dsDNA. Our work revealed the regulation mechanism of phosphorylation on the structures and function of IDR, which also would great help the developing of inhibitor peptides for the cancer therapy.
5. Materials and methods
5.1. Simulation protocols.
The structure of Ets-1 core domain (fragment 301–440, ΔN301) was obtained from the experimental structure (PDBID: 1R36) [31]. The initial structure of disordered serine-rich region (SRR)with the amino acid sequence of RVPSYDSFDYEDYPAALPNHKP was built by the tleap module of AMBER16 [32]. The N-terminus of proteins are capped by acetyl group (ACE) and C-terminus are patched by amines (–NH2). The ΔN279/ΔN2792P were built by connecting the equilibrated SRR/pSRR with the experimental structure of ΔN301. The previous experiments already demonstrated that the auto-inhibition exist on the N-terminal truncated Ets-1. The autoinhibition ability of the N-terminus truncated Ets-1 is similar to the full-length Ets-1 [23]. Sodium ions and chlorine ions were added to neutralize the charges of systems. The CHARMM36m force field and TIP3P water model were employed for the proteins and water molecules, respectively [33], [34]. The force field parameters of phosphoserine were taken from Steinbrecher et al.’s work [35]. The systems were firstly minimized by using the steepest descent method, The minimization stopped when the maximum force (1000.0 kJ/mol/nm) or the minimization step reached 50,000 steps. Then the systems were heated to 300 K over a period of 50 K in 100 ps in the NVT ensemble with the weak harmonic restraint of 1 kcal/(mol·Å2) on the protein backbone heavy atoms. The V-rescale thermostat method was utilized to the temperature coupling in this step [36]. Next another 100 ps MD equilibration in the NPT ensemble was performed at the pressure of 1 atm which was coupled by Parrinello–Rahman barostat [37]. The long-range electrostatic interactions were calculated using the Particle Mesh Ewald (PME) method with a van der Waals cut-off of 10 Å [38]. The SHAKE algorithm was used to constrain the covalent bonds involving hydrogen atoms [39]. The production MD simulations were performed by GPU-version GROMACS5 [40], [41].
5.2. The parallel tempering metadynamics combined with well-tempered ensemble (PTMetaD-WTE).
The PTMetaD-WTE method was employed to sample the structural ensemble of free SRR and pSRR [42], [43], [44]. The initial structures of SRR and pSRR in the PTMetaD-WTE were obtained from the last snapshots of 100-ns unbiased molecular dynamics simulations. Then 12 replicas biased on two collective variables (CVs) (the coordination number of hydrophobic amino acid in SRR and the radius of gyration of SRR) were simulated spanning the temperature range from 288 K to 478 K according to [44]:
| (1) |
where Ti and Ti-1 are the temperatures in the neighboring replicas, c is a constant related to the exchange probability, and is set to be 5.56 × 10⁻⁶. The simulations were carried out in two-step scheme, including the PT-WTE simulation and the PTMetaD-WTE simulation. In PT-WTE simulation, the well-tempered ensemble (PT-WTE) method was employed to sample the conformations by using the potential energy as the collective variable. The Gaussian potential height was set to 0.8 kJ/mol and width was set to 300 kJ/mol. The bias factor γ was set to be 16. The exchange between the neighbor replicas was attempted every 500 steps. In PTMetaD-WTE simulations, the Gaussian height was 1 kJ/mol and the width was 0.5, the exchange step is attempted every 500 steps. The value of two replicas and Gaussian potential were deposited every 5 ps. The PTMetaD-WTE simulation on each replica is 300 ns and the total simulation time is 3.6 μs for each system. All simulations were performed by using GROMACS5 with the PLUMED-2.3 plugin [45].
5.3. Bias-exchange metadynamics (BE-MetaD)
BE-MetaD combined the ideas of replica exchange and metadynamics, the simulations are exchanged in different replicas referred to collective variables (CVs) [46], [47]. In this work, four biased replicas run along with four CVs, including the number of residue contacts between SRR/pSRR and ETS domain (CV1), the number of residue contacts between SRR/pSRR and H3 (CV2), the number of native contacts between the hydrophobic residues inner the Ets-1 core domain (CV3) and the DRMSD of Ets-1 core domain (CV4). The height of the Gaussian bias for the CVs were 2 kJ/mol and the width were 1, 1.5, 5 and 0.1, respectively. The exchanges between replicas were exchanged were attempted every 2000 steps. 500 ns, 400 ns and 400 ns production simulation were performed for each replica of the ΔN2792P, ΔN279, ΔN279-MT, respectively. The convergency tests of the BE-MetaD were given in Fig. S12.
5.4. Analysis details
The software SHIFTX2 [29] was employed to calculated the chemical shifts and the secondary chemical shifts was calculated according to Wishart et al.’s experimental measurements [48]. The cluster analysis was carried out by the GROMACS-5.1.4 tools. The contact-map was analyzed by in-house C++ codes. Free energy landscapes as a function of CVs for ΔN279/ΔpN279 system were calculated by the METAGUI-3 program [49]. The reweighted value of the observable property O was calculated based on the estimated free energies as following [47]:
| (2) |
where α is the microstate on the free energy landscapes, kB is the Boltzmann constant, T is the temperature of system (here T = 300 K), Fα is the free energy of state α.
5.5. Protein expression and purification
The plasmids encoding residues 301–440 (ΔN301) of murine Ets-1 were constructed by ligating codon-optimized genes (GeneCreate) into pET-28a(+) vector via Nde I/Hind III restriction sites. The His6-ΔN301 proteins, including all mutants, were heterogeneously expressed in Escherichia coli BL21cells. Cultures of 200 mL recombinant were grown at 37 °C to OD600 = 0.6, then induced with 0.5 mM of isopropyl-β-D-thiogalactopyranoside (IPTG) at 28 °C for 16 h. Harvested cells were re-suspended in lysis buffer (50 mM Tris, pH 7.4, 300 mM NaCl) and lysed by sonication. The soluble supernatant containing His6-ΔN301 was filtered and purified by Ni Sepharose High Performance resin (GE Biosciences). His6-tag was cleaved from His6-ΔN301 with 1 U thrombin (Sangon) per milligram, and dialyzed overnight in cleavage buffer (25 mM Tris, 150 mM NaCl, 2.5 mM CaCl2, pH 8.4). The cleaved His6-tag was removed by Ni Sepharose High Performance resin and the ΔN301 was concentrated back to the starting volume using an Amicon 3 kDa Molecular Weight Cut Off (MWCO) centrifugal filter. Protein was monitored using SDS-PAGE and Coomassie blue staining.
5.6. Electrophoretic mobility shift assays (EMSAs)
Electrophoretic mobility shift assays (EMSAs) were performed as previously described with some minor modifications [50]. The 27-bp oligonucleotides containing a high affinity ETS binding site: 5′-TCGACGGCCAAGCCGGAAGTGAGTGCC-3′ (top strand) and 5′-TCGAGGCACTCACTTCCGGCTTGGCCG-3′ (bottom strand) [19] were synthesized by GeneCreate company. The final binding reactions were incubated in a buffer containing 25 mM Tris, pH 7.9, 0.1 mM EDTA, 60 mM KCl, 6 mM MgCl2, 200 μg/mL BSA. DNA fragments and different amounts of purified protein were used in each reaction, respectively. Then the sample and control were incubated for 45 min at room temperature and resolved on an 10% (wt/vol) native polyacrylamide gel. DNA-binding assays of Ets-1 proteins were performed using a SYBR Green I-labeled. Finally, the results were observed by the Gel imaging system (BIO-RAD).
5.7. Circular dichroism (CD)
CD spectra of 10 μM protein samples, dialyzed into 20 mM Tris-HCl, 150 mM KCl, pH 8.0, were recorded on a Chirascan™ CD spectrometer (Applied Photophysics). The measurements were performed using a 0.2 cm path-length quartz cells from 200 to 250 nm with a step size of 1 nm and a bandwidth of 1 nm at 298 K. All sample spectra were subtracted with the spectrum of the buffer solution that was recorded as the baseline.
CRediT authorship contribution statement
Shangbo Ning: Investigation, Formal analysis, Data curation, Writing – original draft. Hong-Jun Chao: Investigation, Validation. Shuangli Li: Investigation. Rui Zhou: Data curation, Writing – original draft. Lei Zou: Investigation. Xu Zhang: Writing – review & editing. Jun Liu: . Dazhong Yan: Supervision, Funding acquisition, Writing – review & editing. Mojie Duan: Conceptualization, Supervision, Funding acquisition, Project administration, Writing – review & editing.
Declaration of Competing Interest
The authors declare that they have no known competing financial interests or personal relationships that could have appeared to influence the work reported in this paper.
Acknowledgement
This work was financially supported by the National Natural Science Foundation of China (21773298, 32070098).
Footnotes
Supplementary data to this article can be found online at https://doi.org/10.1016/j.csbj.2022.02.025.
Contributor Information
Dazhong Yan, Email: dazhongyan@whpu.edu.cn.
Mojie Duan, Email: mjduan@wipm.ac.cn, mjduan@apm.ac.cn.
Appendix A. Supplementary data
The following are the Supplementary data to this article:
References
- 1.Sims R.J., Reinberg D. Is there a code embedded in proteins that is based on post-translational modifications? Nat Rev Mol Cell Biol. 2008;9(10):815. doi: 10.1038/nrm2502. [DOI] [PubMed] [Google Scholar]
- 2.Barber K.W., Rinehart J. The ABCs of PTMs. Nat Chem Biol. 2018;14(3):188–192. doi: 10.1038/nchembio.2572. [DOI] [PMC free article] [PubMed] [Google Scholar]
- 3.Deribe Y.L., Pawson T., Dikic I. Post-translational modifications in signal integration. Nat Struct Mol Biol. 2010;17(6):666–672. doi: 10.1038/nsmb.1842. [DOI] [PubMed] [Google Scholar]
- 4.Millar A.H., Heazlewood J.L., Giglione C., Holdsworth M.J., Bachmair A., Schulze W.X. The scope, functions, and dynamics of posttranslational protein modifications. Annu Rev Plant Biol. 2019;70:119–151. doi: 10.1146/annurev-arplant-050718-100211. [DOI] [PubMed] [Google Scholar]
- 5.Minguez P., Parca L., Diella F., Mende D.R., Kumar R., Helmer-Citterich M., et al. Deciphering a global network of functionally associated post-translational modifications. Mol Syst Biol. 2012;8:599. doi: 10.1038/msb.2012.31. [DOI] [PMC free article] [PubMed] [Google Scholar]
- 6.Johnson L.N., Lewis R.J. Structural basis for control by phosphorylation. Chem Rev. 2001;101(8):2209–2242. doi: 10.1021/cr000225s. [DOI] [PubMed] [Google Scholar]
- 7.Robles M., Humphrey S., Mann M. Phosphorylation is a central mechanism for circadian control of metabolism and physiology. Cell Metab. 2016;118 doi: 10.1016/j.cmet.2016.10.004. [DOI] [PubMed] [Google Scholar]
- 8.Dyson H.J., Wright P.E. Intrinsically unstructured proteins and their functions. Nat Rev Mol Cell Biol. 2005;6(3):197–208. doi: 10.1038/nrm1589. [DOI] [PubMed] [Google Scholar]
- 9.Bah A, Forman-Kay JD, Modulation of intrinsically disordered protein function by post-translational modifications. J Biol Chem 2016, jbc.R115.695056. [DOI] [PMC free article] [PubMed]
- 10.Wright P.E., Dyson H.J. Intrinsically disordered proteins in cellular signalling and regulation. Nat Rev Mol Cell Biol. 2015;16(1):18–29. doi: 10.1038/nrm3920. [DOI] [PMC free article] [PubMed] [Google Scholar]
- 11.Csizmok V., Formankay J.D. Complex regulatory mechanisms mediated by the interplay of multiple post-translational modifications. Curr Opin Struct Biol. 2018;48:58–67. doi: 10.1016/j.sbi.2017.10.013. [DOI] [PubMed] [Google Scholar]
- 12.Bah A., Vernon R.M., Siddiqui Z., Krzeminski M., Muhandiram R., Zhao C., et al. Folding of an intrinsically disordered protein by phosphorylation as a regulatory switch. Nature. 2015;519(7541):106–109. doi: 10.1038/nature13999. [DOI] [PubMed] [Google Scholar]
- 13.Nishi H., Fong J.H., Chang C., Teichmann S.A., Panchenko A.R. Regulation of protein–protein binding by coupling between phosphorylation and intrinsic disorder: analysis of human protein complexes. Mol BioSyst. 2013;9(7):1620–1626. doi: 10.1039/c3mb25514j. [DOI] [PMC free article] [PubMed] [Google Scholar]
- 14.Shammas S.L., Crabtree M., Dahal L., Wicky B., Clarke J. Insights into coupled folding and binding mechanisms from kinetic studies. J Biol Chem. 2016;291(13):6689–6695. doi: 10.1074/jbc.R115.692715. [DOI] [PMC free article] [PubMed] [Google Scholar]
- 15.Mayr B., Montminy M. Transcriptional regulation by the phosphorylation-dependent factor CREB. Nat Rev Mol Cell Biol. 2001;2(8):599–609. doi: 10.1038/35085068. [DOI] [PubMed] [Google Scholar]
- 16.Thakur J.K., Archana Y., Gitanjali Y. Molecular recognition by the KIX domain and its role in gene regulation. Nucl Acids Res. 2014;42(4):2112–2125. doi: 10.1093/nar/gkt1147. [DOI] [PMC free article] [PubMed] [Google Scholar]
- 17.Wu S., Wang D., Liu J., Feng Y., Weng J., Li Y., et al. The dynamic multisite interactions between two intrinsically disordered proteins. Angew Chem Int Ed Engl. 2017;56(26):7515–7519. doi: 10.1002/anie.201701883. [DOI] [PubMed] [Google Scholar]
- 18.Borgia A., Borgia M.B., Bugge K., Kissling V.M., Heidarsson P.O., Fernandes C.B., et al. Extreme disorder in an ultrahigh-affinity protein complex. Nature. 2018;555(7694):61–66. doi: 10.1038/nature25762. [DOI] [PMC free article] [PubMed] [Google Scholar]
- 19.Pufall M.A., Lee G.M., Nelson M.L., Kang H.S., Velyvis A., Kay L.E., et al. Variable control of Ets-1 DNA binding by multiple phosphates in an unstructured region. Science. 2005;309(5731):142–145. doi: 10.1126/science.1111915. [DOI] [PubMed] [Google Scholar]
- 20.Lee G.M., Pufall M.A., Meeker C.A., Kang H.S., Graves B.J., Mcintosh L.P. The affinity of Ets-1 for DNA is modulated by phosphorylation through transient interactions of an unstructured region. J Mol Biol. 2008;382(4):1014–1030. doi: 10.1016/j.jmb.2008.07.064. [DOI] [PMC free article] [PubMed] [Google Scholar]
- 21.Pap Z., Pavai Z., Denes L., Kovalszky I., Jung J. An immunohistochemical study of colon adenomas and carcinomas: E-cadherin, Syndecan-1, Ets-1. Pathol Oncol Res. 2009;15(4):579–587. doi: 10.1007/s12253-009-9157-x. [DOI] [PubMed] [Google Scholar]
- 22.Calli A.O., Sari A., Cakalagaoglu F., Altinboga A.A., Oncel S. ETS-1 proto-oncogene as a key newcomer molecule to predict invasiveness in laryngeal carcinoma. Pathol Res Pract. 2011;207(10):628–633. doi: 10.1016/j.prp.2011.07.010. [DOI] [PubMed] [Google Scholar]
- 23.Desjardins G., Meeker C., Bhachech N., Currie S.L., Okon M., Graves B.J., et al. Synergy of aromatic residues and phosphoserines within the intrinsically disordered DNA-binding inhibitory elements of the Ets-1 transcription factor. P Natl Acad Sci USA. 2015;111(30):11019–11024. doi: 10.1073/pnas.1401891111. [DOI] [PMC free article] [PubMed] [Google Scholar]
- 24.Russell L., Garrett-Sinha L.A. Transcription factor Ets-1 in cytokine and chemokine gene regulation. Cytokine. 2010;51(3):217–226. doi: 10.1016/j.cyto.2010.03.006. [DOI] [PubMed] [Google Scholar]
- 25.Slack C., Alic N., Foley A., Cabecinha M., Hoddinott M.P., Partridge L. The Ras-Erk-ETS-signaling pathway is a drug target for longevity. Cell. 2015;162(1):72–83. doi: 10.1016/j.cell.2015.06.023. [DOI] [PMC free article] [PubMed] [Google Scholar]
- 26.Garvie C.W. Structural analysis of the autoinhibition of Ets-1 and its role in protein partnerships. J Biol Chem. 2002;277(47):45529–45536. doi: 10.1074/jbc.M206327200. [DOI] [PubMed] [Google Scholar]
- 27.Kasahara K., Shiina M., Higo J., Ogata K., Nakamura H. Phosphorylation of an intrinsically disordered region of Ets1 shifts a multi-modal interaction ensemble to an auto-inhibitory state. Nucl Acids Res. 2018;46(5):2243–2251. doi: 10.1093/nar/gkx1297. [DOI] [PMC free article] [PubMed] [Google Scholar]
- 28.Perez-Borrajero C., Lin C.S., Okon M., Scheu K., Graves B.J., Murphy M.E.P., et al. The biophysical basis for phosphorylation-enhanced DNA-Binding autoinhibition of the ETS1 transcription factor. J Mol Biol. 2019;431(3):593–614. doi: 10.1016/j.jmb.2018.12.011. [DOI] [PubMed] [Google Scholar]
- 29.Han B., Liu Y., Ginzinger S.W., Wishart D.S. SHIFTX2: significantly improved protein chemical shift prediction. J Biomol NMR. 2011;50(1):43–57. doi: 10.1007/s10858-011-9478-4. [DOI] [PMC free article] [PubMed] [Google Scholar]
- 30.Liu N, Guo Y, Ning S, Duan M, Phosphorylation regulates the binding of intrinsically disordered proteins via a flexible conformation selection mechanism. Communications Chemistry. [DOI] [PMC free article] [PubMed]
- 31.Lee G.M., Donaldson L.W., Pufall M.A., Kang H.S., Pot I., Graves B.J., et al. The structural and dynamic basis of Ets-1 DNA binding autoinhibition. J Biol Chem. 2005;280(8):7088–7099. doi: 10.1074/jbc.M410722200. [DOI] [PubMed] [Google Scholar]
- 32.Case DA, Cheatham TE, 3rd, Darden, T, Gohlke H, Luo R, Merz KM, Jr, Onufriev A, Simmerling C, Wang B, Woods RJ, The Amber biomolecular simulation programs. J Comput Chem2005,26 (16), 1668-88. [DOI] [PMC free article] [PubMed]
- 33.Huang J., Rauscher S., Nawrocki G., Ran T., Feig M., de Groot B.L., et al. CHARMM36m: an improved force field for folded and intrinsically disordered proteins. Nat Methods. 2017;14(1):71–73. doi: 10.1038/nmeth.4067. [DOI] [PMC free article] [PubMed] [Google Scholar]
- 34.Jorgensen W, C. J., Madura J, Impey R, Klein M, Comparison of simple potential functions for simulating liquid water. J Chem Phys 1983, 79 (2), 926-935.
- 35.Steinbrecher T., Latzer J., Case D. Revised AMBER parameters for bioorganic phosphates. J Chem Theory Comput. 2012;8(11):4405–4412. doi: 10.1021/ct300613v. [DOI] [PMC free article] [PubMed] [Google Scholar]
- 36.Bussi G., Donadio D., Parrinello M. Canonical sampling through velocity rescaling. J Chem Phys. 2007;126(1) doi: 10.1063/1.2408420. [DOI] [PubMed] [Google Scholar]
- 37.Parrinello M., Rahman A. Polymorphic transitions in single crystals: a new molecular dynamics method. J Appl Phys. 1981;52:7182–7190. [Google Scholar]
- 38.Essmann U., Perera L., Berkowitz M.L., Darden T., Lee H., Pedersen L.G. A smooth particle mesh Ewald method. J Chem Phys. 1995;103(19):8577–8593. [Google Scholar]
- 39.Ryckaert J.P., Ciccotti G., Berendsen H. Numerical integration of the cartesian equations of motion of a system with constraints: molecular dynamics of n-alkanes. J Comput Phys. 1977;23(3):327–341. [Google Scholar]
- 40.Mja A., Tm D., Rsb C., Sp A., Jcsb C., Bh A., et al. GROMACS: high performance molecular simulations through multi-level parallelism from laptops to supercomputers. SoftwareX. 2015;1–2:19–25. [Google Scholar]
- 41.Szilárd P., Abraham M.J., Kutzner C., Hess B., Lindahl E. Springer; Cham: 2014. Tackling Exascale Software Challenges in Molecular Dynamics Simulations with GROMACS; pp. 3–27. [Google Scholar]
- 42.Deighan M., Bonomi M., Pfaendtner J. Efficient simulation of explicitly solvated proteins in the well-tempered ensemble. J Chem Theory Comput. 2012;8(7):2189–2192. doi: 10.1021/ct300297t. [DOI] [PubMed] [Google Scholar]
- 43.Parrinello M.B. Enhanced sampling in the well-tempered ensemble. Phys Rev Lett. 2010;104(19) doi: 10.1103/PhysRevLett.104.190601. [DOI] [PubMed] [Google Scholar]
- 44.Prakash M.K., Ba Rducci A., Parrinello M. Replica temperatures for uniform exchange and efficient roundtrip times in explicit solvent parallel tempering simulations. J Chem Theory Comput. 2011;7(7):2025–2027. doi: 10.1021/ct200208h. [DOI] [PubMed] [Google Scholar]
- 45.Tribello G.A., Bonomi M., Branduardi D., Camilloni C., Bussi G. PLUMED 2: new feathers for an old bird. Comput Phys Commun. 2014;185(2):604–613. [Google Scholar]
- 46.Laio A., Piana S. A bias-exchange approach to protein folding. J Phys Chem B. 2007;111(17):4553–4559. doi: 10.1021/jp067873l. [DOI] [PubMed] [Google Scholar]
- 47.Marinelli F., Pietrucci F., Laio A., Piana S., Pande V.S. A kinetic model of Trp-Cage folding from multiple biased molecular dynamics simulations. PLoS Comput Biol. 2009;5(8) doi: 10.1371/journal.pcbi.1000452. [DOI] [PMC free article] [PubMed] [Google Scholar]
- 48.Wishart DS, Case DA, Use of chemical shifts in macromolecular structure determination. 2001, 338 (10), 3-34. [DOI] [PubMed]
- 49.Giorgino T., Laio A., Rodriguez A. METAGUI 3: A graphical user interface for choosing the collective variables in molecular dynamics simulations. Comput Phys Commun. 2017;217:204–209. [Google Scholar]
- 50.Hellman L.M., Fried M.G. Electrophoretic mobility shift assay (EMSA) for detecting protein–nucleic acid interactions. Nat Protoc. 2007;2(8):1849–1861. doi: 10.1038/nprot.2007.249. [DOI] [PMC free article] [PubMed] [Google Scholar]
Associated Data
This section collects any data citations, data availability statements, or supplementary materials included in this article.