Recently, we rechecked our paper and realized that some data in Figures 3Bb, 3Eb and 6Ab3 were wrongly presented. The data presented came from the wrong folder. Therefore, we would like to make corrections. Changes in representative images do not affect the interpretation of the results, nor do they influence the conclusions of the work. The authors apologize to the readers of the Journal for any inconvenience.
Figure 3.

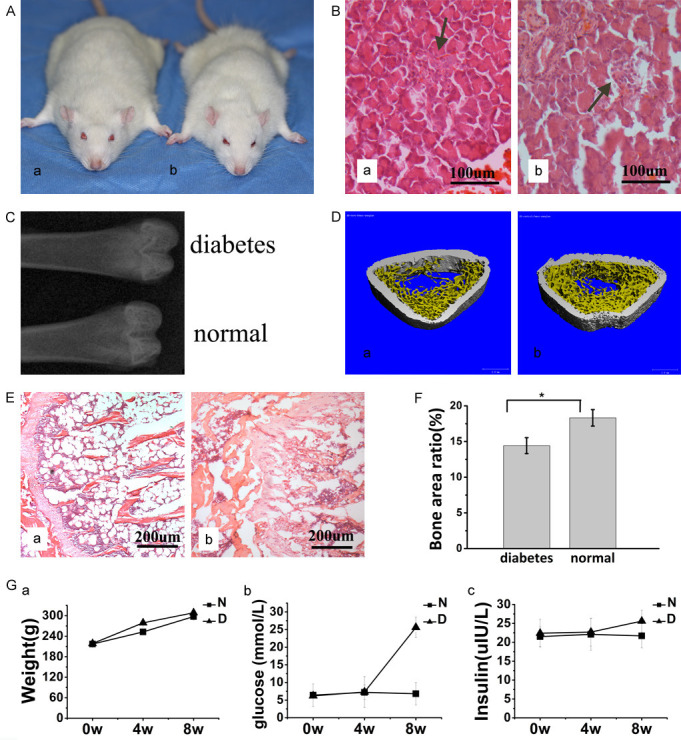
Establishment of type-2 diabetic rat model. A. a, Diabetic rat. b, Normal rat. General morphology of the rats. B. a, Diabetic rat. b, Normal rat. Histological staining of sections of the pancreas (HE staining, original magnification ×200). The area of pancreatic islets was markedly reduced, and β-cells appeared to exhibit marked injury in T2DM rats. Decreased bone mass and impaired trabecular microarchitectures were evaluated by X-ray, histological images and micro-CT in T2DM rats. C. X-ray of the proximal femora through the longitudinal plane. D. a, Diabetic rat. b, Normal rat. Micro-CT of the distal femora through the transversal plane. E. a, Diabetic rat. b, Normal rat. Histological sections of the distal femora through the transverse plane (HE staining, original magnification ×100). F. Statistical results of BA according to histomorphometry. Experiments were performed at least in triplicate. Data are expressed as the mean ± SD (n=2). *P<0.05 (by ANOVA). Experiments were performed at least in triplicate. G. The changes in body weight, glucose level, and insulin level between the two groups tended to reveal more remarkable changes in glucose levels in the DM group than in the N group. Among the rats after STZ injection, there were no significant differences in body weight or insulin levels between the DM and N groups. Experiments were performed at least in triplicate. The data are expressed as the mean ± SD (n=2). *P<0.05 (by ANOVA).
Figure 6.

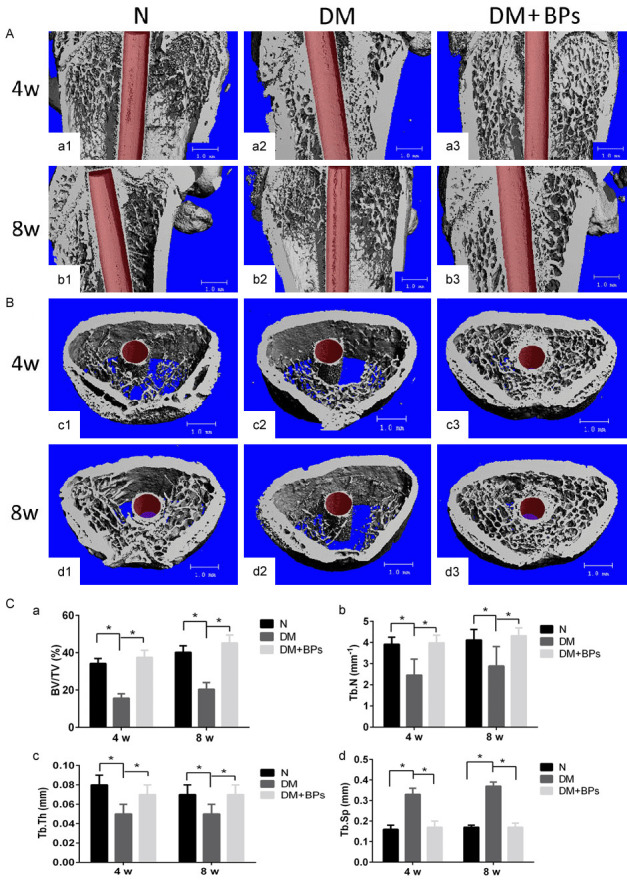
Micro-CT images of femora with implants. A, B. Micro-CT images of the ROI. The bone-implant interface and the trabecular microstructure of the peri-implant bone tissue among the three groups were analyzed by micro-CT. C. Statistical results of BV/TV, Tb.Th, Tb.N and Tb.Sp according to micro-CT at 4 weeks and 8 weeks after implant insertion in the N, DM and DM+BPs groups, respectively. Experiments were performed at least in triplicate. The data are expressed as the mean ± SD (n=3). *P<0.05 (by ANOVA).


