

Abstract
Introduction: Prognostic scores in Ewing sarcoma including baseline clinical and laboratory characteristics are necessary for pre-treatment risk stratification. In this study, we formulated and validated a prognostic model for baseline risk categorization in Ewing sarcoma. Materials and methods: A retrospective single-institutional study was conducted on Ewing sarcoma patients treated uniformly between January 2003 and December 2018. Baseline clinical/pathological characteristics and survival outcomes were noted from medical records. The cohort was randomised into a derivation and validation cohort. A prognostic score was formulated by including independent prognostic factors from the derivation cohort by multivariable analysis. The prognostic model was validated in the validation cohort along with estimation of its predictive ability. Results: A total of 860 patients were included with 40.3% having baseline metastases. Tumor diameter >5 cm (HR 2.04; P<0.001; score 2), baseline metastases (HR 2.33; P<0.001, score 2), and total leucocyte count >11000/mm3 (HR 1.44; P=0.015; score 1) were independent predictors of overall survival in derivation cohort and included for prognostic score calculation. Patients were categorized into low (score 0), intermediate (score 1-3) and high-risk (score 4-5) groups. Harrell’s c-indexes of the model were 0.625, 0.622 and 0.624 in the derivation, validation and whole cohort respectively. The timed AUC of ROC of the prognostic score-group for 5-year survival was 0.72, 0.71 and 0.73 in the derivation, validation and whole cohort respectively. Conclusions: We have formulated and validated a prognostic score for Ewing sarcoma incorporating baseline clinical and laboratory parameters, with fair predictive ability for risk stratification and facilitating risk-adapted personalized therapy.
Keywords: Ewing sarcoma, primitive neuroectodermal tumor, prognosis, outcome, score
Introduction
The survival outcomes in ESFT family of tumors (ESFT) have significantly improved over the last few decades with adoption of risk adapted and multi-modality intensive treatment approaches [1-3]. With improving survival, it is also increasingly important to identify subsets of patients who may benefit from less aggressive treatment so as to reduce treatment-related adverse effects including secondary leukaemia, long term complications of radiation and morbidity from amputation [4]. The key to risk adapted therapy is evaluating relevant predictive factors at baseline and identifying prognostic sub-groups for stratifying treatment decisions.
Multiple previous studies have evaluated prognostic factors for ESFT. The presence of metastases at diagnosis, tumor location, tumor diameter and volume are well established prognostic factors in ESFT and have been consistently included for risk stratification in prior models [5-10]. However, these models have been derived from population-based data models rather than a systematically collected institutional database. Most of these models have incorporated treatment related factors, which are individualized based on patient characteristics and are inherently biased. Furthermore, they have not assessed or incorporated systemic symptoms and basic blood laboratory biomarkers into their models. Previous studies have shown that the presence of constitutional symptoms, an elevated neutrophil-lymphocyte ratio and hypoalbuminemia may be indicative of a high tumor burden and a consequent poor prognosis [11-14]. In order to facilitate risk stratification, development of a more holistic prognostic tool that incorporates easy-to-obtain baseline clinical and/or laboratory parameters is warranted.
In this study, we aimed to identify the baseline predictive factors for survival at baseline in a retrospective derivation cohort of patients with ESFT availing treatment at our cancer centre. We further formulated a prognostic score incorporating the identified independent prognostic factors and validated the prognostic score in an independent validation cohort with estimation of predictive ability of the model.
Methods
Study design and data acquisition
A retrospective study was carried out where consecutive ESFT patients registered at the sarcoma clinic of our cancer center between January 2003 and December 2018 were included. All patients with confirmed diagnosis of ESFT who received primary treatment at our centre were eligible for inclusion. The following data were collected: date of registration, age, gender, presence of systemic symptoms at baseline, duration of symptoms prior to presentation, tumor diameter, basic lab investigations such as haemoglobin, total leucocyte count, platelet count, serum albumin, presence of metastatic disease, and treatment details including modalities/regimens used. Survival outcome and date of progression/relapse or death due to any cause were also noted. In our centre, it was observed that compliance to treatment was poor among patients with cancer [15]. Hence, a systemic database was created in 2008 containing demographic details, outpatient follow up details and survival outcomes of all registered patients at our centre till date. This database was used to identify patients for inclusion and their medical records were reviewed. Patient and/or caregivers were contacted telephonically for noting survival outcomes if these were not available in medical records. Patients who had been treated elsewhere or for whom clinical details were incomplete due to inadequate metastatic workup and/or primary site imaging were excluded. The study was ethically approved by the institutional ethics committee, and in view of the retrospective nature, the need for informed consent was waived.
Diagnostic workup
The diagnosis of ESFT was considered based on histopathologic features seen on biopsy of the tumor specimen and was established following a multidisciplinary discussion at the weekly inter-departmental onco-pathologic conference. All patients diagnosed to have ESFT were subjected to protocol based diagnostic workup. This included basic laboratory investigations including hemogram, liver and renal function tests and local site imaging with computed tomography (CT) or magnetic resonance imaging (MRI) as appropriate. Bone marrow aspiration and biopsy, CT scan of chest and either bone scan or positron emitted tomography-computed tomography (PET/CT) were done in all patients for baseline staging of the disease.
Treatment protocol
The standard first line treatment administered to patients with localized and metastatic disease consisted of neoadjuvant chemotherapy followed by local treatment and adjuvant chemotherapy with or without radiation therapy. Chemotherapy in both localized and metastatic disease was given in the form of 17 cycles of alternating VAC (vincristine/doxorubicin/cyclophosphamide) and IE (ifosfamide/etoposide) at intervals of three weeks; actinomycin-D was administered in place of doxorubicin from week 30 onwards after a cumulative doxorubicin dose of 375 mg/m2 was reached [16]. Chemotherapy protocol was uniform for both localized and metastatic group of patients. Local treatment was given after 10 to 12 weeks of neoadjuvant chemotherapy [17]. It was administered once the patient had complete or partial response or stable disease following neoadjuvant chemotherapy in localized disease. In patients with metastatic disease, local therapy was used in those with complete or partial response at the primary and metastatic sites after neoadjuvant chemotherapy. The local therapy modality used (surgery/radiotherapy) was decided by a multidisciplinary team based on the site of disease and resectability. For surgically operated cases, adjuvant radiotherapy was postoperatively administered at a dose of 45 to 50 Gy in conventional fractionation postoperatively to patients with positive resection margins and/or those with poor histological response to neoadjuvant chemotherapy as evidenced by tumor necrosis below 90% [18,19]. Radical radiotherapy was preferred over surgery at certain sites of difficult surgical access such as the pelvis, head and neck. A dose of 55 to 60 Gy in conventional fractionation was used for radical radiation treatment [20,21]. Response to therapy was assessed with the help of an appropriate imaging modality (CT/PET-CT/MRI) after completion of neoadjuvant therapy and adjuvant therapy as per Response Evaluation Criteria in Solid Tumors (RECIST) 1.0 criteria.
Study outcomes
The primary outcomes assessed in our study were event free survival (EFS) and overall survival (OS). For the purpose of our study, OS was defined as the time interval from the date of registration to the date of death from any cause. EFS was defined as the time interval from the date of registration to disease recurrence, progression or death from any cause. Data were censored on 30th June, 2021.
Statistical analysis
Development of derivation and validation cohort
Descriptive statistics with frequency estimates were used to summarize baseline demographics and clinical characteristics. Continuous variables were reported as median with range. For development of the prognostic model, the whole cohort was divided into a derivation cohort and a validation cohort in 2:1 ratio by blocked randomization technique. The categorical variables across the two cohorts were compared by chi-square test, while continuous variables were compared by Mann-Whitney test. Survival estimates were done using Kaplan Meier analyses and compared across the two cohorts by log rank test. The follow up of the cohort was estimated by reverse Kaplan Meier method [22]. Survival estimates were reported as median time along with its 95% confidence intervals (CI).
Identification of prognostic factors
A set of potential prognostic factors including age (categorized based on median value), gender, symptom duration (categorized based on median value), presence of fever at baseline, longest tumor diameter (categorized as ≤5 cm or >5 cm), primary site of the disease (categorized as head/neck, thorax, abdomen/spine/pelvis, and extremities), presence of metastases at baseline, haemoglobin (<10 g/dl considered as low), total leucocyte count (>11×103/µl considered as high), platelet count (<150×103/µl considered as low) and serum albumin (<3.5 g/dl considered as low) were evaluated for inclusion into the model. The impacts of these factors on OS in the derivation cohort were analyzed by univariable Cox regression analysis. Factors with P≤0.1 in univariable analyses were further included in the multivariable model in a forward stepwise manner based on log likelihood change. Factors with P<0.05 in multivariable model were only considered as significant and included in development of the prognostic model.
Development of the prognostic score
A prognostic score was developed by assigning a score to each independent prognostic factor in the final multivariable model. The scores were assigned by giving relative importance to each factor based on the cox regression coefficient (β) values of the final multivariable model. Based on the total score, the patients were classified into clinically discriminatory prognostic sub-groups.
Validation of the prognostic score
The predictive ability of the developed prognostic risk groups for OS was evaluated in the validation cohort as well as in the whole cohort. The Harrel’s concordance index (c-index) of the prognostic model and the timed area under the receiver operating characteristic curve (AUC of the ROC curve) considering 3-year and 5-year survival as outcome were estimated in the derivation, validation and the whole cohorts. The predictive ability of prognostic risk groups in predicting EFS in derivation cohort, validation cohort and the whole cohort were also estimated.
Results
Patient characteristics
During the period from 2003 to 2018, 1032 patients with ESFT were registered at our centre of which 860 patients were eligible for analysis in our study (Figure 1). The baseline demographic and clinical characteristics of the patients are depicted in Table 1. The median duration of symptoms of patients in our cohort was 4 months. The most common site for the primary was the extremities (39.7% of cases) followed by the thorax in 20% of cases. Metastatic disease was noted at presentation in 40.3% of patients in the entire cohort. Patients were treated as per the protocol described. A total of 450 (52.3%) patients received local therapy of which 253 patients (29.4%) received surgery alone, 135 patients (15.7%) underwent radiotherapy alone and 62 (7.2%) patients received surgery with adjuvant radiotherapy for local control. The patients in the total cohort were divided in a 2:1 ratio by randomization to yield 573 patients in the derivation cohort and 287 patients in the validation cohort. There were no significant differences in baseline characteristics between the derivation and validation cohorts (Table 1).
Figure 1.

Workflow of the study.
Table 1.
Baseline demographic and clinical characteristics of the derivation (n=573), validation (n=287) and the whole cohorts (n=860)
| Demographic/Clinical parameters | Total cohort (n=860) | Derivation cohort (n=573) | Validation cohort (n=287) | P value |
|---|---|---|---|---|
| Age (years) (n=859) | 15 (1-56) | 15 (0.1-56) | 16 (1-55) | 0.176 |
| Sex (n=860) | ||||
| Male | 598 (69.5) | 397 (69.3) | 201 (70.0) | 0.822 |
| Female | 262 (30.5) | 176 (30.7) | 86 (30.0) | |
| Symptom duration (n=856) (months) | 4 (0.5-96) | 4 (0.5-96) | 4 (0.5-48) | 0.834 |
| Fever at onset (n=859) | ||||
| Yes | 210 (24.4) | 151 (26.4) | 59 (20.6) | 0.066 |
| No | 649 (75.6) | 422 (26.4) | 227 (79.4) | |
| Tumor diameter (longest dimension) (cm)* (n=696) | 9 (0.1-30) | 9 (1-27) | 9 (0.1-30) | 0.254 |
| Site of primary disease (n=860) | ||||
| Head and neck | 95 (11.0) | 67 (11.7) | 28 (9.8) | 0.571 |
| Thorax | 172 (20.0) | 107 (18.7) | 65 (22.6) | |
| Abdomen | 44 (5.1) | 29 (5.1) | 15 (5.2) | |
| Pelvis | 146 (17.0) | 92 (16.1) | 54 (18.8) | |
| Spine | 62 (7.2) | 40 (7.0) | 22 (7.7) | |
| Upper extremity | 92 (10.7) | 63 (11.0) | 29 (10.1) | |
| Lower extremity | 249 (29.0) | 175 (30.5) | 74 (25.8) | |
| Primary site (n=860) | ||||
| Skeletal | 668 (77.7) | 450 (78.5) | 218 (76.0) | 0.392 |
| Extra-skeletal | 192 (22.3) | 123 (21.5) | 69 (24.0) | |
| Site of skeletal disease (n=668) | ||||
| Axial | 204 (30.6) | 141 (31.4) | 63 (28.9) | 0.510 |
| Appendicular | 464 (69.4) | 309 (68.6) | 155 (71.1) | |
| Metastases at baseline (n=860) | 0.637 | |||
| No | 513 (59.7) | 345 (60.2) | 168 (58.5) | |
| Yes | 347 (40.3) | 228 (39.8) | 119 (41.5) | |
| Hemoglobin (g/dl)* (n=817) | 11.2 (1.2-16.9) | 11.1 (1.2-16.9) | 11.3 (5.2-16.8) | 0.126 |
| Total Leucocyte count (n=817) (×103/µl)* | 8.80 (1.50-38.6) | 8.90 (1.50-33.2) | 8.70 (2.20-38.6) | 0.503 |
| Platelet count (×103/µl) (n=459)* | 252 (58-778) | 253 (60-778) | 249 (58-654) | 0.688 |
| Serum Albumin (g/dl) (n=757)* | 4.3 (1.4-6.0) | 4.3 (2.1-6.0) | 4.3 (1.4-5.5) | 0.423 |
| Mortality till last follow up | 426 (49.5) | 283 (49.4) | 143 (49.8) | 0.904 |
| Median event free survival (months) | 24.4 (21.6-27.2) | 23.8 (20.8-26.7) | 28.1 (21.9-34.3) | 0.634 |
| Median overall survival (months) | 29.1 (25.4-32.8) | 27.8 (24.1-31.5) | 30.8 (23.5-38.2) | 0.867 |
Continuous variables were expressed as median with range and compared by Mann-Whitney test, while categorical variables were compared by chi-square test. Time to event outcomes were compared by log-rank test.
Survival outcome
The median follow-up duration of the cohort was 60.5 months (95% CI: 50.9 months-70.1 months). The median EFS and OS of patients with localized disease in the whole cohort was 37.4 months (range: 27.2 months-47.5 months) and 49.8 months (range: 27.2 months-72.3 months) respectively. In patients with metastatic disease, median EFS was 16.4 months (range: 14.2 months-18.6 months) and OS was 18.2 months (range: 15.3 months-21.1 months). In the localized cohort, the predicted 3-year OS was 58±2% while in the metastatic cohort it was 25±3%. The difference in median survival in the derivation and whole cohort was not statistically significant (Table 1).
Identification of prognostic factors in the derivation cohort
On univariable analysis of patients in the derivation cohort, presence of fever (HR 1.53; 1.18-1.97, P=0.001), tumor diameter above 5 cm (HR 2.38; 1.58-3.59, P<0.001), metastatic disease at baseline (HR 2.40; 1.93-3.09, P<0.001), site of disease at the abdomen/pelvis/spine (HR: 1.54; 1.17-2.03; P=0.002), haemoglobin lower than 10 g/dL (HR 1.43; 1.11-1.84, P=0.006), total leucocyte count above 11000/mm3 (1.40; 1.08-1.81, P=0.009) and serum albumin level below 3.5 g/dL (HR 1.77; 1.22-2.58, P=0.003) were found to be predictive of inferior OS. Among these, tumor diameter above 5 cm (HR 2.04; 1.34-3.12, P<0.001), metastases at baseline (HR 2.33; 1.74-3.09, P<0.001), total leucocyte count above 11000/mm3 (HR 1.44; 1.07-1.94, P=0.015) were independent predictors of OS in multivariable analysis (Table 2; Figure 2A-C). It was also seen that the above three factors were associated with inferior EFS (Figure 4A-C).
Table 2.
Univariable and multivariable analysis of factors predictive of overall survival in the derivation cohort (n=573)
| Predictive factor | Median survival (months) | Univariable analysis | Multivariable analysis | ||||||
|---|---|---|---|---|---|---|---|---|---|
|
|
|
||||||||
| HR | 95% CI | P value | P value (overall)* | HR | 95% CI | P value | |||
| Age (years) | ≥15 (n=298) | 32.4 | 0.91 | 0.72-1.15 | 0.439 | -- | -- | -- | -- |
| <15 (n=275) | 26.3 | 1 | -- | -- | -- | -- | -- | -- | |
| Sex | Male (n=397) | 29.3 | 0.84 | 0.65-1.07 | 0.162 | -- | -- | -- | -- |
| Female (n=176) | 25.8 | 1 | -- | -- | -- | -- | -- | -- | |
| Symptom duration (months) (n=571) | ≤4 (n=306) | 25.5 | 1.19 | 0.95-1.51 | 0.135 | -- | -- | -- | -- |
| >4 (n=265) | 30.5 | 1 | -- | -- | -- | -- | -- | -- | |
| Fever at onset | Yes (n=151) | 21.5 | 1.53 | 1.18-1.97 | 0.001 | -- | -- | -- | -- |
| No (n=422) | 31.2 | 1 | -- | -- | -- | -- | -- | -- | |
| Tumor diameter (cm) (n=464) | ≤5 (n=83) | Not reached | 1 | -- | -- | -- | 1 | -- | -- |
| >5 (n=381) | 26.1 | 2.38 | 1.58-3.59 | <0.001 | -- | 2.04 | 1.34-3.12 | <0.001 | |
| Site of disease | Extremity (n=238) | 29.6 | 1 | -- | -- | 0.003 | -- | -- | -- |
| Head and Neck (n=67) | 98.6 | 0.80 | 0.53-1.21 | 0.295 | -- | -- | -- | -- | |
| Thorax (n=107) | 25.1 | 1.19 | 0.85-1.66 | 0.317 | -- | -- | -- | -- | |
| Abdomen/Pelvic/Spine (n=161) | 25.5 | 1.54 | 1.17-2.03 | 0.002 | -- | -- | -- | -- | |
| Metastases at baseline | Yes (n=228) | 17.8 | 2.40 | 1.93-3.09 | <0.001 | -- | 2.33 | 1.74-3.09 | <0.001 |
| No (n=345) | 51.5 | 1 | -- | -- | -- | 1 | -- | -- | |
| Hemoglobin (g/dl) (n=540) | <10 (n=152) | 22.3 | 1.43 | 1.11-1.84 | 0.006 | -- | -- | -- | -- |
| ≥10 (n=388) | 31.2 | 1 | -- | -- | -- | -- | -- | -- | |
| Total leucocyte count (×103/µl) (n=539) | >11.0 (n=152) | 24.7 | 1.40 | 1.08-1.81 | 0.009 | -- | 1.44 | 1.07-1.94 | 0.015 |
| ≤11.0 (n=387) | 29.6 | 1 | -- | -- | -- | 1 | -- | -- | |
| Platelet count (×103/µl) (n=301) | <150 (n=36) | 25.8 | 1.01 | 0.63-1.62 | 0.458 | -- | -- | -- | -- |
| ≥150 (n=267) | 27.3 | 1 | -- | -- | -- | -- | -- | -- | |
| Serum albumin (g/dl) (n=497) | <3.5 (n=53) | 18.3 | 1.77 | 1.22-2.58 | 0.003 | -- | -- | -- | -- |
| ≥3.5 (n=444) | 27.8 | 1 | -- | -- | -- | -- | -- | -- | |
HR: Hazard ratio; CI: Confidence interval. Factors with P≤0.1 in univariable analysis was included for multivariable cox regression analysis in a stepwise manner based on log likelihood change and only significant predictor variables (P<0.05) were reported.
P value for overall model for multi-category variables.
Figure 2.

Kaplan Meier curves showing the impact of total leucocyte count (>11000/mm3 vs. ≤11000/mm3), metastases at presentation (yes vs. no) and tumor diameter (>5 cm vs. ≤5 cm) on OS in the derivation cohort. A: Median OS was significantly higher in the group with total leucocyte count >11000/mm3 as compared to those with total leucocyte count <11000/mm3 [HR 1.44 (1.07-1.94); P=0.015)]. B: Median OS was significantly higher in the group with tumor diameter >5 cm as compared to those with diameter <5 cm [HR 2.04 (1.34-3.12); P<0.001)]. C: Median OS was significantly higher in the group with metastases as compared to those with no metastases [HR 2.33 (1.74-3.09); P<0.001)].
Figure 4.

Kaplan Meier curves showing the impact of total leucocyte count (>11000/mm3 vs. ≤11000/mm3), metastases at presentation (yes vs. no) and tumor diameter (>5 cm vs. ≤5 cm) on EFS in the derivation cohort. A: Median EFS was significantly higher in the group with total leucocyte count >11000/mm3 as compared to those with total leucocyte count <11000/mm3 [HR 1.33 (1.08-1.63); P=0.006)]. B: Median EFS was significantly higher in the group with tumor diameter >5 cm as compared to those with diameter <5 cm [HR 2.05 (1.51-2.78); P<0.001)]. C: Median EFS was significantly higher in the group with metastases as compared to those with no metastases [HR 2.22 (1.84-2.68); P<0.001)].
Formulation of prognostic score
The prognostic factors identified in multivariable analysis which included tumor diameter (≤5 cm vs. >5 cm), the presence of metastases (yes or no) and total leucocyte count (>11000/mm3 vs. ≤11000/mm3) were used for formulation of the prognostic score. Based on the Cox regression coefficient (β) values of the final multivariable model (Table 3), a score value of 2 was assigned each to the two factors of presence of metastases at baseline and tumor diameter >5 cm while a score of 1 was assigned for presence of baseline total leucocyte count >11000/mm3. Following this, patients were categorized into three prognostic risk groups: low risk (score value of 0); intermediate risk (score value: 1-3); high risk (score value: 4-5) (Table 3). The median survival was significantly different among the three groups in the derivation cohort [Estimate not reached in the low-risk group vs. 41.5 months (15.7-67.2 months) in the intermediate risk group vs. 17.2 months (14.7-19.7 months) in the high-risk group] (Table 4; Figure 3A).
Table 3.
Categorization of Ewing’s sarcoma prognostic score
| Score value | Score category |
|---|---|
| 0 | Low Risk |
| 1, 2, 3 | Intermediate risk |
| 4, 5 | High Risk |
Score values were assigned to individual risk factors based on ratio of cox regression coefficients (β) of individual predictors of the final multivariate regression model and rounding off to the nearest integer value: A. Presence of metastases at baseline (β1=0.890): 2; B. Primary site tumour diameter (longest dimension) >5 cm (β2=0.710): 2; C. Baseline total leucocyte count >1.10×10³/µl (β3=0.353): 1.
Table 4.
Predictive value of Ewing sarcoma prognostic score on survival outcomes of the derivation, validation and the whole cohorts
| Ewing sarcoma prognostic score* | Overall survival | |||||||||||||||
|
| ||||||||||||||||
| Derivation cohort (n=437) | Validation cohort (n=224) | Whole cohort (n=661) | ||||||||||||||
|
|
|
|
||||||||||||||
| Score value | Category | Number | Median (months) | HR (95% CI) | P value | P value (overall) | Number | Median (months) | HR (95% CI) | P value | P value (overall) | Number | Median (months) | HR (95% CI) | P value | P value (overall) |
|
| ||||||||||||||||
| 0 | Low Risk | 49 | NR | 0.17 (0.09-0.32) | <0.001 | <0.001 | 26 | NR | 0.15 (0.06-0.36) | <0.001 | <0.001 | 75 | NR | 0.16 (0.10-0.28) | <0.001 | <0.001 |
| 1-3 | Intermediate Risk | 237 | 41.5 (15.7-67.2) | 0.43 (0.32-0.57) | <0.001 | 110 | 35.2 (23.8-46.7) | 0.61 (0.42-0.89) | 0.011 | 347 | 37.6 (26.5-48.6) | 0.48 (0.39-0.61) | 0.001 | |||
| 4,5 | High Risk | 151 | 17.2 (14.7-19.7) | 1 | -- | 88 | 18.2 (12.8-23.6) | 1 | -- | 239 | 17.7 (14.9-20.4) | 1 | -- | |||
| Comparison: Low risk vs Intermediate risk | 0.40 (0.21-0.75) | 0.004 | 0.24 (0.10-0.56) | 0.001 | 0.34 (0.21-0.56) | <0.001 | ||||||||||
|
| ||||||||||||||||
| Ewing sarcoma prognostic score* | Event free survival | |||||||||||||||
|
| ||||||||||||||||
| Derivation cohort (n=437) | Validation cohort (n=224) | Whole cohort (n=661) | ||||||||||||||
|
|
|
|
||||||||||||||
| Prognostic Score value | Category | Number | Median (months) | HR (95% CI) | P value | P value (overall) | Number | Median (months) | HR (95% CI) | P value | P value (overall) | Number | Median (months) | HR (95% CI) | P value | P value (overall) |
|
| ||||||||||||||||
| 0 | Low Risk | 49 | NR | 0.21 (0.12-0.37) | <0.001 | <0.001 | 26 | NR | 0.19 (0.09-0.41) | <0.001 | <0.001 | 75 | NR | 0.20 (0.13-0.32) | <0.001 | <0.001 |
| 1-3 | Intermediate Risk | 237 | 27.7 (18.6-41.7) | 0.48 (0.37-0.64) | <0.001 | 110 | 28.1 (14.1-42.0) | 0.58 (0.38-0.81) | 0.002 | 347 | 27.7 (18.2-37.1) | 0.51 (0.41-0.63) | <0.001 | |||
| 4, 5 | High Risk | 151 | 15.4 (12.8-18.0) | 1 | -- | 88 | 18.1 (13.5-22.7) | 1 | -- | 239 | 16.3 (14.3-18.3) | 1 | -- | |||
| Comparison: Low risk vs Intermediate risk | 0.43 (0.24-0.76) | 0.004 | 0.34 (0.16-0.72) | 0.005 | 0.41 (0.26-0.64) | <0.001 | ||||||||||
Prognostic score was calculated only for those patients where all three prognostic factors (tumor diameter, total leucocyte count, presence of metastases at baseline) were available.
NR: Not reached, HR: Hazard Ratio, CI: Confidence interval.
Figure 3.

Predictive capability of the prognostic model on OS in the derivation, validation and whole cohorts. A: Kaplan Meier curve showing statistically significant differences in median OS between the low, intermediate and high-risk groups in the derivation cohort. Low risk vs. high risk: HR 0.17 (0.09-0.32; P<0.001); Intermediate risk vs. high risk: HR 0.43 (0.32-0.57; P<0.001); Low risk vs. intermediate risk: HR 0.40 (0.21-0.75; P<0.004); Overall P value: <0.001. B: ROC of the prognostic score for 3-year OS in the derivation cohort [AUC=0.69 (0.64-0.76)]. C: ROC of the prognostic score for 5-year OS in the derivation cohort [AUC=0.72 (0.66-0.77)]. D: Kaplan Meier curve showing statistically significant differences in median OS between the low, intermediate and high-risk groups in the validation cohort. Low risk vs. high risk: HR 0.15 (0.06-0.36; P<0.001); Intermediate risk vs. high risk: HR 0.61 (0.42-0.89; P=0.011); Low risk vs. intermediate risk: HR 0.24 (0.10-0.56; P=0.001); Overall P value: <0.001. E: ROC of the prognostic score for 3-year OS in the validation cohort [AUC=0.71 (0.63-0.79)]. F: ROC of the prognostic score for 5-year OS in the validation cohort [AUC=0.76 (0.67-0.86)]. G: Kaplan Meier curve showing statistically significant differences in median OS between the low, intermediate and high-risk groups in the whole cohort. Low risk vs. high risk: HR 0.16 (0.10-0.28; P<0.001); Intermediate risk vs. high risk: HR 0.48 (0.39-0.61; P=0.001); Low risk vs. intermediate risk: HR 0.34 (0.21-0.56; P<0.001); Overall P value: <0.001. H: ROC of the prognostic score for 3-year OS in the whole cohort [AUC=0.70 (0.65-0.75)]. I: ROC of the prognostic score for 5-year OS in the whole cohort [AUC=0.72 (0.66-0.77)].
Predictive ability of the prognostic score for OS in the validation cohort and the whole cohort
On applying the developed prognostic score in the validation cohort, the three risk groups were also found to have significantly different median OS [Estimate not reached in the low-risk group vs. 35.2 months (23.8-46.7 months) in the intermediate risk group vs. 18.2 months (12.8-23.6 months) in the high-risk group] (Table 4; Figure 3D). Similarly, when the score was used for the whole cohort, the median OS in the three groups was found to be significantly different from one another [Estimate not reached in the low-risk group vs. 37.6 months (26.5-48.6 months) in the intermediate risk group vs. 17.7 months (14.9-20.4 months) in the high-risk group] (Table 4; Figure 3G). The 3-year and 5-year OS and EFS in each prognostic sub-group in the derivation, validation and whole cohorts are stated in Table 5.
Table 5.
Three- and 5-year survival outcome in derivation, validation and whole cohorts
| Ewing sarcoma risk score category | Derivation cohort (n=573) | Validation cohort (n=287) | Whole cohort (n=860) | |||
|---|---|---|---|---|---|---|
|
|
|
|
||||
| 3-year survival | 5-year survival | 3-year survival | 5-year survival | 3-year survival | 5-year survival | |
| Overall | 44±2% | 38±2% | 48±3% | 34±4% | 45±2% | 37±2% |
| Low risk (0) | 73±7% | 73±7% | 81±8% | 81±8% | 76±5% | 76±5% |
| Intermediate risk (1-3) | 53±4% | 47±4% | 50±5% | 29±5% | 52±3% | 39±3% |
| High risk (4, 5) | 21±4% | 14±4% | 27±6% | 18±6% | 23±3% | 15±3% |
Predictive ability of prognostic score for EFS in the derivation, validation and whole cohorts
The EFS was estimated for each prognostic sub-group in the derivation, validation and whole cohorts, and it was also observed that the EFS was significantly different among the three prognostic sub-groups (Figure 5A-C).
Figure 5.
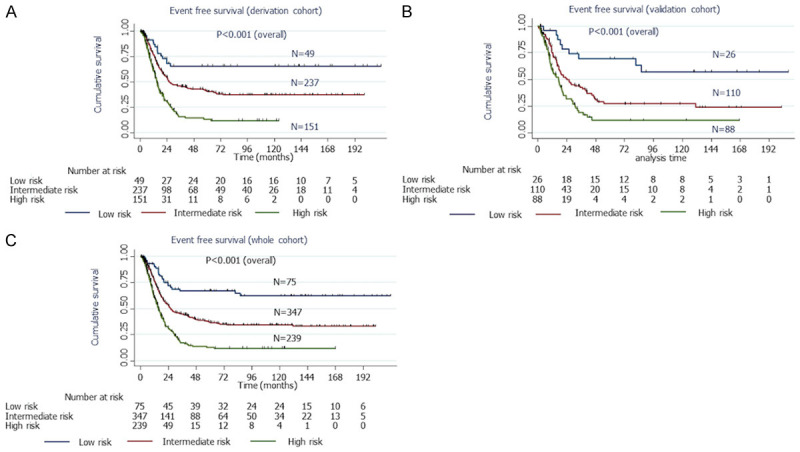
Predictive capability of the prognostic model on EFS in the derivation, validation and whole cohorts. A: Kaplan Meier curve showing statistically significant differences in median EFS between the low, intermediate and high-risk groups in the derivation cohort. Low risk vs. high risk: HR 0.21 (0.12-0.37; P<0.001); Intermediate risk vs. high risk: HR 0.48 (0.37-0.64; P<0.001); Low risk vs. intermediate risk: HR 0.43 (0.24-0.76; P=0.004); Overall P value: <0.001. B: Kaplan Meier curve showing statistically significant differences in median EFS between the low, intermediate and high-risk groups in the validation cohort. Low risk vs. high risk: HR 0.19 (0.09-0.41; P<0.001); Intermediate risk vs. high risk: HR 0.58 (0.38-0.81; P=0.002); Low risk vs. intermediate risk: HR 0.34 (0.16-0.72; P=0.005); Overall P value: <0.001. C: Kaplan Meier curve showing statistically significant differences in median EFS between the low, intermediate and high-risk groups in the whole cohort. Low risk vs. high risk: HR 0.20 (0.13-0.32; P<0.001); Intermediate risk vs. high risk: HR 0.51 (0.41-0.63; P<0.001); Low risk vs. intermediate risk: HR 0.41 (0.26-0.64; P<0.001); Overall P value: <0.001. HR, Hazard ratio; CI, Confidence interval; AUC, Area under the curve; ROC, Receiver operating characteristic curve; OS, overall survival; EFS, event free survival.
Predictive ability of the prognostic model
The Harrell’s c-index of the prognostic model in the derivation cohort was 0.625. The timed AUC of ROC for 3-year and 5-year survival was 0.69 (0.64-0.76) and 0.72 (0.66-0.77) respectively in the derivation cohort (Figure 3B and 3C). The Harrell’s c-index of the model in predicting EFS in the derivation cohort was 0.605.
In the validation cohort, the Harrel’s c-index of the prognostic model was estimated to be 0.622. The timed AUC of ROC for 3-year and 5-year survival was 0.71 (0.63-0.79) and 0.76 (0.67-0.86) respectively in the validation cohort. The Harrell’s c-index of the model in predicting EFS in the validation cohort was 0.610 (Figure 3E and 3F).
In the whole cohort, the Harrel’s c-index of the prognostic model for OS and EFS was 0.624 and 0.607 respectively. The corresponding timed AUC of ROC for 3-year and 5-year survival was 0.70 (0.65-0.75) and 0.73 (0.68-0.78) respectively (Figure 3H and 3I).
Discussion
In this study, we analyzed a retrospective cohort of patients with ESFT treated at our cancer center with a uniform protocol over a period of more than 15 years. We identified independent prognostic factors predictive of survival and further developed a prognostic score for ESFT patients to identify clinically important risk groups at baseline.
Our cohort had a 3-year overall survival of 58±2% in the localized group and 25±3% in the metastatic group of patients. In our cohort, the observed survival was comparable to that described in other studies from similar clinical settings; prior studies from the subcontinent have also shown similar outcomes with 3-year disease free survival (DFS) of 55% in localized disease and 5-year DFS of 38% in a cohort including patients with localized and metastatic disease [23]. The survival outcome is slightly lower than that described in Western cohorts [24-27]. The disparity is possibly due to delayed presentation and differences in social support systems. In our cohort, we observe a higher proportion of patients presenting with metastatic disease (40.3%) as compared to large Western cohorts which describe 20-30% of patients harbouring metastatic disease at initial presentation [24,28,29].
We identified tumor size and metastases at presentation to be independent predictors of OS. Metastases at baseline is widely accepted as a powerful prognostic factor in ESFT with 5-year EFS of 15 to 20% in patients with metastases as compared to 55 to 70% for patients with localized disease [21,24,27,30,31]. A similar finding was observed in our study as well. Tumor diameter is a known marker of disease burden and also has implications on selection of mode of local therapy and on the effective penetration of systemic therapy. It has also been identified as a risk factor for metastatic disease and survival in several retrospective cohorts and is an integral component of prior prognostic models of ESFT [5,6,7-10,26,28,32-34]. This was replicated in our cohort with median OS of 26.1 months in those with tumor diameter of above 5 cm while the survival estimate was not reached in those with tumor diameter less than 5 cm.
We also identified that an elevated total leucocyte count is an independent predictor of survival in our cohort. Total leucocyte count higher than 11000/mm3 was shown to be an independent predictor of inferior EFS in head and neck, extra-osseus as well as extremity ESFT previously from our center [20,31,35,36]. Leucocytes in cancer patients have been found to be enriched in tissue factor and vascular endothelial growth factor, which may facilitate tumor growth and disease progression upon release. Leucocytosis has been seen to be predictive of inferior survival outcomes in many solid tumors such as esophageal, anal and lung cancer [37-39]. It is an integral component of the International Metastatic Renal Cell Carcinoma Database Consortium (IMDC) prognostic model for renal cell carcinoma [40]. Thus, leucocytosis may represent a pro-tumor systemic inflammatory state reflective of higher tumor burden [41]. A recent meta-analysis identified an elevated neutrophil-lymphocyte ratio as a promising biomarker for poor survival in patients with ESFT [42]. Hypoalbuminemia has been previously seen to be associated with poor outcomes in metastatic ESFT and in other metastatic sarcomas [13,43]. Although, hypoalbuminemia was significantly predictive of poor outcome in univariable analysis, it did not emerge as an independent predictor of survival in the final multivariable model.
Our prognostic model identified three risk groups among patients with ESFT and showed good discriminative ability. There are only six prior validated prognostic models of ESFT of which five are derived from the Surveillance, Epidemiology and End Results Program database, a population-based data model [5-10]. Tumor size and the presence of metastases have consistently been incorporated in all of the above models. A majority of the above models incorporated treatment-related risk factors into their model including the use of surgery as part of local treatment (yes/no) and the addition of chemotherapy (yes/no) [7-10]. In real world practice, there is significant heterogeneity across institutes in surgical expertise, preferred modes of local therapy and type of chemotherapy regimen used. Furthermore, there is an inherent bias of patient selection for specific treatment modalities based on disease characteristics which makes treatment-related factors not a truly independent prognostic variable. In our study, we wished to primarily construct a prognostic tool to allow for baseline risk estimation by clinicians. None of the prior prognostic models have explored the impact of systemic symptoms or blood inflammatory markers on prognosis in ESFT. The evidence for their potential prognostic value has been garnered from smaller studies that have not attempted to formulate a validated model [12,13,21,31,35,36,44,45]. The above parameters are easily available to the clinicians at the time of diagnosis and may facilitate simpler triaging and risk stratification.
At present, patients with metastatic ESFT are managed with VAC (vincristine/doxorubicin/cyclophosphamide)-only regimens without ifosfamide/etoposide and administered in a non-dose dense manner. Dose dense chemotherapy and the addition of ifosfamide/etoposide have been found to improve survival outcomes in localized ESFT [16,46]. We anticipate that the prognostic score formulated in this study could be used to identify a subset of low-risk patients with metastatic disease who may benefit from dose-dense regimens that incorporate ifosfamide/etoposide with curative intent. Similarly, high risk patients identified using the score with poor performance status could potentially be managed upfront with palliative intent treatment such as oral metronomic therapy rather than intensive chemotherapy as the expected chemotoxicity may be more than the expected survival benefit [47-49].
Our study represents the largest retrospective institutional analysis of ESFT from Asia till date with median follow-up of more than 5 years. It provides the only validated prognostic model that has been formulated from a single institutional cohort and treated with a uniform chemotherapy protocol. The cohort was randomized, thus allowing for a homogenous distribution of baseline characteristics. Our study has a few limitations. While our model was validated in a separate validation cohort, external validation of the prognostic model in an independent cohort of patients would have been optimal. Future studies that prospectively validate the model in independent cohorts from diverse clinical settings are warranted. Additionally, the role of a wider panel of candidate blood investigations including lactate dehydrogenase, ferritin and the neutrophil-lymphocyte ratio should be explored for their prognostic impact. Novel tools such as genetic sequencing and detection of minimal residual disease in blood and bone marrow after treatment potentially hold prognostic value and should be looked into in future studies [3].
In conclusion, our study is a large cohort study that attempts to identify and incorporate routine baseline clinical data and laboratory investigations into a user-friendly model for risk stratification in ESFT. The identification of clinically relevant prognostic markers will facilitate risk adapted therapy and allow for a more personalized approach to treatment in this curable condition.
Acknowledgements
The authors would like to acknowledge every member of the paediatric oncology team of our centre including research staff, nurses and dietician for their exemplary clinical services. In particular, the contributions of Ms. Mamta Kumari who maintains and updates the patient database and Ms. Deepa Dhawan who has played a major role in the coordination of data collection are well appreciated.
Disclosure of conflict of interest
None.
References
- 1.Paulussen M, Ahrens S, Dunst J, Winkelmann W, Exner GU, Kotz R, Amann G, Dockhorn-Dworniczak B, Harms D, Müller-Weihrich S, Welte K, Kornhuber B, Janka-Schaub G, Göbel U, Treuner J, Voûte PA, Zoubek A, Gadner H, Jürgens H. Localized Ewing tumor of bone: final results of the cooperative Ewing’s sarcoma study CESS 86. J. Clin. Oncol. 2001;19:1818–1829. doi: 10.1200/JCO.2001.19.6.1818. [DOI] [PubMed] [Google Scholar]
- 2.Gaspar N, Rey A, Bérard PM, Michon J, Gentet JC, Tabone MD, Roché H, Defachelles AS, Lejars O, Plouvier E, Schmitt C, Bui B, Boutard P, Taque S, Munzer M, Vannier JP, Plantaz D, Enz-Werlé N, Oberlin O. Risk adapted chemotherapy for localised Ewing’s sarcoma of bone: the French EW93 study. Eur J Cancer. 2012;48:1376–1385. doi: 10.1016/j.ejca.2012.03.017. [DOI] [PubMed] [Google Scholar]
- 3.Biswas B, Bakhshi S. Management of Ewing sarcoma family of tumors: current scenario and unmet need. World J Orthop. 2016;7:527–538. doi: 10.5312/wjo.v7.i9.527. [DOI] [PMC free article] [PubMed] [Google Scholar]
- 4.Marina NM, Liu Q, Donaldson SS, Sklar CA, Armstrong GT, Oeffinger KC, Leisenring WM, Ginsberg JP, Henderson TO, Neglia JP, Stovall MA, Yasui Y, Randall RL, Geller DS, Robison LL, Ness KK. Longitudinal follow-up of adult survivors of Ewing sarcoma: a report from the childhood cancer survivor study (CCSS) Cancer. 2017;123:2551. doi: 10.1002/cncr.30627. [DOI] [PMC free article] [PubMed] [Google Scholar]
- 5.Zhou Z, Wang J, Fang L, Ma J, Guo M. A nomogram for predicting overall survival in patients with Ewing sarcoma: a SEER-based study. BMC Musculoskelet Disord. 2020;21:737. doi: 10.1186/s12891-020-03706-3. [DOI] [PMC free article] [PubMed] [Google Scholar]
- 6.Bosma C, Lancia C, Rueten-Budde A, Ranft A, Gelderblom H, Fiocco M, van de Sande M, Dijkstra P, Dirksen U. Easy-to-use clinical tool for survival estimation in Ewing sarcoma at diagnosis and after surgery. Sci Rep. 2019;9:11000. doi: 10.1038/s41598-019-46721-8. [DOI] [PMC free article] [PubMed] [Google Scholar]
- 7.Zhang J, Pan Z, Yang J, Yan X, Li Y, Lyu J. A nomogram for determining the disease-specific survival in Ewing sarcoma: a population study. BMC Cancer. 2019;19:667. doi: 10.1186/s12885-019-5893-9. [DOI] [PMC free article] [PubMed] [Google Scholar]
- 8.Gao F, Zhou Y, Zhao R, Ren Y. Establishing a novel prognostic tool for Ewing sarcoma patients: surveillance, epidemiology, and end results database analysis. Medicine (Baltimore) 2020;99:e23050. doi: 10.1097/MD.0000000000023050. [DOI] [PMC free article] [PubMed] [Google Scholar]
- 9.Shi J, Yang J, Ma X, Wang X. Risk factors for metastasis and poor prognosis of Ewing sarcoma: a population based study. J Orthop Surg Res. 2020;15:88. doi: 10.1186/s13018-020-01607-8. [DOI] [PMC free article] [PubMed] [Google Scholar]
- 10.Zhou Q, Wu Z, Lin Z. A nomogram to predict prognosis in Ewing sarcoma of bone. J Bone Oncol. 2019;15:100223. doi: 10.1016/j.jbo.2019.100223. [DOI] [PMC free article] [PubMed] [Google Scholar]
- 11.Gaspar N, Le Teuff G, Defachelles AS, Schmitt C, Levy D, Castex MP, Lejars O, Verite C, Plouvier E, Claude L, Oberlin O. Ewing sarcoma prognostic score (ESPS) at diagnosis, based on fever and metastatic status. J. Clin. Oncol. 2011;29:9539. [Google Scholar]
- 12.Li YJ, Yang X, Zhang WB, Yi C, Wang F, Li P. Clinical implications of six inflammatory biomarkers as prognostic indicators in Ewing sarcoma. Cancer Manag Res. 2017;9:443. doi: 10.2147/CMAR.S146827. [DOI] [PMC free article] [PubMed] [Google Scholar]
- 13.Biswas B, Rastogi S, Khan S, Shukla N, Deo S, Agarwala S, Sharma D, Thulkar S, Vishnubhatla S, Pathania S, Bakhshi S. Hypoalbuminaemia is an independent predictor of poor outcome in metastatic Ewing’s sarcoma family of tumours: a single institutional experience of 150 cases treated with uniform chemotherapy protocol. Clin Oncol (R Coll Radiol) 2014;26:722–729. doi: 10.1016/j.clon.2014.05.006. [DOI] [PubMed] [Google Scholar]
- 14.Aparicio J, Munárriz B, Pastor M, Vera F, Castel V, Aparisi F, Montalar J, Badal M, Gómez-Codina J, Herranz C. Long-term follow-up and prognostic factors in Ewing’s sarcoma. A multivariate analysis of 116 patients from a single institution. Oncology. 1998;55:20–26. doi: 10.1159/000011841. [DOI] [PubMed] [Google Scholar]
- 15.Bakhshi S, Gupta S, Ravindranath Y. Compliance in retinoblastoma. Indian J Pediatr. 2010;77:535–540. doi: 10.1007/s12098-010-0047-8. [DOI] [PubMed] [Google Scholar]
- 16.Grier HE, Krailo MD, Tarbell NJ, Link MP, Fryer CJH, Pritchard DJ, Gebhardt MC, Dickman PS, Perlman EJ, Meyers PA, Donaldson SS, Moore S, Rausen AR, Vietti TJ, Miser JS. Addition of ifosfamide and etoposide to standard chemotherapy for Ewing’s sarcoma and primitive neuroectodermal tumor of bone. N Engl J Med. 2009;348:694–701. doi: 10.1056/NEJMoa020890. [DOI] [PubMed] [Google Scholar]
- 17.Lin T, Liao K, McAleer M, Grosshans D, McGovern S, Bishop A, Woodhouse K, Paulino A, Yeboa D. Timing of local therapy affects survival in Ewing sarcoma. Int J Radiat Oncol Biol Phys. 2019;104:127–136. doi: 10.1016/j.ijrobp.2018.12.032. [DOI] [PubMed] [Google Scholar]
- 18.Zöllner SK, Amatruda JF, Bauer S, Collaud S, de Álava E, DuBois SG, Hardes J, Hartmann W, Kovar H, Metzler M, Shulman DS, Streitbürger A, Timmermann B, Toretsky JA, Uhlenbruch Y, Vieth V, Grünewald TGP, Dirksen U. Ewing sarcoma-diagnosis, treatment, clinical challenges and future perspectives. J Clin Med. 2021;10:1685. doi: 10.3390/jcm10081685. [DOI] [PMC free article] [PubMed] [Google Scholar]
- 19.Dunst J, Schuck A. Role of radiotherapy in Ewing tumors. Pediatr Blood Cancer. 2004;42:465–470. doi: 10.1002/pbc.10446. [DOI] [PubMed] [Google Scholar]
- 20.Biswas B, Thakar A, Mohanti B, Vishnubhatla S, Bakhshi S. Prognostic factors in head and neck Ewing sarcoma family of tumors. Laryngoscope. 2015;125:E112–E117. doi: 10.1002/lary.24985. [DOI] [PubMed] [Google Scholar]
- 21.Biswas B, Agarwala S, Rastogi S, Khan SA, Mohanti BK, Sharma DN, Pathy S, Bakhshi S. High burden of metastases and poor outcome in pelvic PNET. Pediatr Blood Cancer. 2013;60:E97–E99. doi: 10.1002/pbc.24552. [DOI] [PubMed] [Google Scholar]
- 22.Xue X, Agalliu I, Kim MY, Wang T, Lin J, Ghavamian R, Strickler HD. New methods for estimating follow-up rates in cohort studies. BMC Med Res Methodol. 2017;17:155. doi: 10.1186/s12874-017-0436-z. [DOI] [PMC free article] [PubMed] [Google Scholar]
- 23.Ganguly S, Kinsey S, Bakhshi S. Childhood cancer in India. Cancer Epidemiol. 2021;71:101679. doi: 10.1016/j.canep.2020.101679. [DOI] [PubMed] [Google Scholar]
- 24.Cotterill SJ, Ahrens S, Paulussen M, Jürgens HF, Voûte PA, Gadner H, Craft AW. Prognostic factors in Ewing’s tumor of bone: analysis of 975 patients from the European Intergroup Cooperative Ewing’s Sarcoma Study Group. J. Clin. Oncol. 2000;18:3108–3114. doi: 10.1200/JCO.2000.18.17.3108. [DOI] [PubMed] [Google Scholar]
- 25.Marina N, Granowetter L, Grier H, Womer R, Randall R, Marcus K, McIlvaine E, Krailo M. Age, tumor characteristics, and treatment regimen as event predictors in ewing: a children’s oncology group report. Sarcoma. 2015;2015:927123. doi: 10.1155/2015/927123. [DOI] [PMC free article] [PubMed] [Google Scholar]
- 26.Rodríguez-Galindo C, Navid F, Liu T, Billups C, Rao B, Krasin M. Prognostic factors for local and distant control in Ewing sarcoma family of tumors. Ann Oncol. 2008;19:814–820. doi: 10.1093/annonc/mdm521. [DOI] [PubMed] [Google Scholar]
- 27.Jagodzińska-Mucha P, Ługowska I, Świtaj T, Koseła-Paterczyk H, Wągrodzki M, Kozak K, Falkowski S, Morysiński T, Goryń T, Dawidowska A, Rutkowski P. The clinical prognostic factors and treatment outcomes of adult patients with Ewing sarcoma. Int J Clin Oncol. 2020;25:2006–2014. doi: 10.1007/s10147-020-01741-7. [DOI] [PubMed] [Google Scholar]
- 28.Ye C, Dai M, Zhang B. Risk factors for metastasis at initial diagnosis with Ewing sarcoma. Front Oncol. 2019;9:1043. doi: 10.3389/fonc.2019.01043. [DOI] [PMC free article] [PubMed] [Google Scholar]
- 29.Worch J, Ranft A, DuBois S, Paulussen M, Juergens H, Dirksen U. Age dependency of primary tumor sites and metastases in patients with Ewing sarcoma. Pediatr Blood Cancer. 2018;65:e27251. doi: 10.1002/pbc.27251. [DOI] [PubMed] [Google Scholar]
- 30.Ladenstein R, Pötschger U, Le Deley M, Whelan J, Paulussen M, Oberlin O, van den Berg H, Dirksen U, Hjorth L, Michon J, Lewis I, Craft A, Jürgens H. Primary disseminated multifocal Ewing sarcoma: results of the Euro-EWING 99 trial. J. Clin. Oncol. 2010;28:3284–3291. doi: 10.1200/JCO.2009.22.9864. [DOI] [PubMed] [Google Scholar]
- 31.Biswas B, Rastogi S, Khan S, Mohanti B, Sharma D, Sharma M, Mridha A, Bakhshi S. Outcomes and prognostic factors for Ewing-family tumors of the extremities. J Bone Joint Surg Am. 2014;96:841–849. doi: 10.2106/JBJS.M.00411. [DOI] [PubMed] [Google Scholar]
- 32.Biswas B, Rastogi S, Khan SA, Shukla NK, Deo SVS, Agarwala S, Mohanti BK, Sharma MC, Vishnubhatla S, Bakhshi S. Developing a prognostic model for localized Ewing sarcoma family of tumors: a single institutional experience of 224 cases treated with uniform chemotherapy protocol. J Surg Oncol. 2015;111:683–689. doi: 10.1002/jso.23861. [DOI] [PubMed] [Google Scholar]
- 33.Arpaci E, Yetisyigit T, Seker M, Uncu D, Uyeturk U, Oksuzoglu B, Demirci U, Coskun U, Kucukoner M, Isikdogan A, Inanc M, Alkis N, Ozkan M. Prognostic factors and clinical outcome of patients with Ewing’s sarcoma family of tumors in adults: multicentric study of the Anatolian Society of Medical Oncology. Med Oncol. 2013;30:469. doi: 10.1007/s12032-013-0469-z. [DOI] [PubMed] [Google Scholar]
- 34.Bosma S, Ayu O, Fiocco M, Gelderblom H, Dijkstra P. Prognostic factors for survival in Ewing sarcoma: a systematic review. Surg Oncol. 2018;27:603–610. doi: 10.1016/j.suronc.2018.07.016. [DOI] [PubMed] [Google Scholar]
- 35.Biswas B, Thakar A, Mohanti BK, Vishnubhatla S, Bakhshi S. Prognostic factors in head and neck Ewing sarcoma family of tumors. Laryngoscope. 2015;125:E112–E117. doi: 10.1002/lary.24985. [DOI] [PubMed] [Google Scholar]
- 36.Biswas B, Shukla N, Deo S, Agarwala S, Sharma D, Vishnubhatla S, Bakhshi S. Evaluation of outcome and prognostic factors in extraosseous Ewing sarcoma. Pediatr Blood Cancer. 2014;61:1925–1931. doi: 10.1002/pbc.25095. [DOI] [PubMed] [Google Scholar]
- 37.Schernberg A, Escande A, Rivin Del Campo E, Ducreux M, Nguyen F, Goere D, Chargari C, Deutsch E. Leukocytosis and neutrophilia predicts outcome in anal cancer. Radiother Oncol. 2017;122:137–145. doi: 10.1016/j.radonc.2016.12.009. [DOI] [PubMed] [Google Scholar]
- 38.Schernberg A, Moureau-Zabotto L, Del Campo ER, Escande A, Ducreux M, Nguyen F, Goere D, Chargari C, Deutsch E. Leukocytosis and neutrophilia predict outcome in locally advanced esophageal cancer treated with definitive chemoradiation. Oncotarget. 2017;8:11579–11588. doi: 10.18632/oncotarget.14584. [DOI] [PMC free article] [PubMed] [Google Scholar]
- 39.Schernberg A, Mezquita L, Boros A, Botticella A, Caramella C, Besse B, Escande A, Planchard D, Le Pechoux C, Deutsch E. Neutrophilia as prognostic biomarker in locally advanced stage III lung cancer. PLoS One. 2018;13:e0204490. doi: 10.1371/journal.pone.0204490. [DOI] [PMC free article] [PubMed] [Google Scholar]
- 40.Heng DY, Xie W, Regan MM, Harshman LC, Bjarnason GA, Vaishampayan UN, Mackenzie M, Wood L, Donskov F, Tan MH, Rha SY, Agarwal N, Kollmannsberger C, Rini BI, Choueiri TK. External validation and comparison with other models of the International Metastatic Renal-Cell Carcinoma Database Consortium prognostic model: a population-based study. Lancet Oncol. 2013;14:141. doi: 10.1016/S1470-2045(12)70559-4. [DOI] [PMC free article] [PubMed] [Google Scholar]
- 41.Connolly GC, Khorana AA, Kuderer NM, Culakova E, Francis CW, Lyman GH. Leukocytosis, thrombosis and early mortality in cancer patients initiating chemotherapy. Thromb Res. 2010;126:113. doi: 10.1016/j.thromres.2010.05.012. [DOI] [PMC free article] [PubMed] [Google Scholar]
- 42.Jiang M, Ma S, Hua Z, Zhao Z, Gao S. Prognostic value of pretreated blood inflammatory markers in patients with bone sarcoma: a meta-analysis. Dis Markers. 2021;2021:8839512. doi: 10.1155/2021/8839512. [DOI] [PMC free article] [PubMed] [Google Scholar]
- 43.Iqbal N, Shukla N, Deo S, Agarwala S, Sharma D, Sharma M, Bakhshi S. Prognostic factors affecting survival in metastatic soft tissue sarcoma: an analysis of 110 patients. Clin Transl Oncol. 2016;18:310–316. doi: 10.1007/s12094-015-1369-9. [DOI] [PubMed] [Google Scholar]
- 44.Biswas B, Agarwala S, Shukla NK, Deo S, Sharma D, Thulkar S, Vishnubhatla S, Bakhshi S. Evaluation of outcome and prognostic factors in thoracic primitive neuroectodermal tumor: a study of 84 cases. Ann Thorac Surg. 2013;96:2006–2014. doi: 10.1016/j.athoracsur.2013.06.062. [DOI] [PubMed] [Google Scholar]
- 45.Aggerholm-Pedersen N, Maretty-Kongstad K, Keller J, Baerentzen S, Safwat A. The prognostic value of serum biomarkers in localized bone sarcoma. Transl Oncol. 2016;9:322–328. doi: 10.1016/j.tranon.2016.05.006. [DOI] [PMC free article] [PubMed] [Google Scholar]
- 46.Womer RB, West DC, Krailo MD, Dickman PS, Pawel BR, Grier HE, Marcus K, Sailer S, Healey JH, Dormans JP, Weiss AR. Randomized controlled trial of interval-compressed chemotherapy for the treatment of localized ewing sarcoma: a report from the children’s oncology group. J. Clin. Oncol. 2012;30:4148–4154. doi: 10.1200/JCO.2011.41.5703. [DOI] [PMC free article] [PubMed] [Google Scholar]
- 47.Bahl A, Bakhshi S. Metronomic chemotherapy in progressive pediatric malignancies: old drugs in new package. Indian J Pediatr. 2012;79:1617–1622. doi: 10.1007/s12098-012-0759-z. [DOI] [PubMed] [Google Scholar]
- 48.Sharma A, Kataria B, Biswas B, Bakhshi S, Pushpam D. Oral metronomic chemotherapy is a cost effective alternative to pazopanib in advanced soft tissue sarcoma. J Oncol Pharm Pract. 2021 doi: 10.1177/10781552211000113. [Epub ahead of print] [DOI] [PubMed] [Google Scholar]
- 49.Pramanik R, Bakhshi S. Metronomic therapy in pediatric oncology: a snapshot. Pediatr Blood Cancer. 2019;66:e27811. doi: 10.1002/pbc.27811. [DOI] [PubMed] [Google Scholar]