

Abstract
Background: Pleomorphic xanthoastrocytomas (PXAs) are rare, accounting for less than 1% of astrocytomas, and commonly occur in young patients. The majority are WHO grade II. A fraction of tumors that present or recur with malignant change are classified as anaplastic (APXA, grade III). Limited data are available on their molecular characteristics. Methodology: Genome-wide expression profiling of 14 PXA and 6 APXAs was performed by microarray. Among differentially expressed genes (DEGs), Cyclin-Dependent Kinase 14 (CDK14) and Mitochondrial Fission Process 1 (MTFP1) were validated by qRT PCR. Result: Unsupervised hierarchical clustering revealed two distinct molecular clusters (Cluster 1: 10 PXA, 3 APXA and Cluster 2: 4 PXA, 3 APXA) with grade II and III tumors distributed in both highlighting molecular heterogeneity within the same grade. There was an insignificant difference in age, sex, immunohistochemical profile, frequency of BRAF mutation, or CDKN2A deletion among the two clusters. Significantly, worse progression-free survival was observed in cluster 2 (P=0.003). mRNA profiling-based prediction of recurrence was superior to and independent of histological grade, BRAF mutation, or CDKN2A deletion status. A total of 10 upregulated and 418 downregulated genes were identified between the PXA clusters. qRT-PCR validation of CDK14 (upregulated in cluster 2) and MTFP1 (upregulated in cluster 1) showed strong concordance with expression array data. Conclusion: This is the first comprehensive study highlighting distinct molecular subgroups of PXA. The differentially expressed genes between two clusters may potentially be used for developing histology independent classification schemes, prognostication and may serve as prospective therapeutic targets for PXA patients.
Keywords: Expression profiling, PXA/APXA, unsupervised hierarchical clustering, molecular clusters, BRAF, CDKN2A, CDK14, MTFP1
Introduction
Pleomorphic xanthoastrocytomas (PXAs) constitute less than 1% of all astrocytic neoplasms. The entity was formally incorporated in the WHO classification system of CNS tumors as a grade II neoplasm in 1993 [1,2]. The overall survival rate is nearly 70% at 10 years [1]. The majority of cases occur in children and young adults and present with long-standing seizures [3]. PXAs are typically supratentorial with a predilection to the temporal lobe [4]. On histology, they are composed of highly pleomorphic giant bizarre mono and multinucleated cells with or without xanthomatous cells. Over the last decade, a small fraction of these tumors were reported to have a shorter progression-free survival (PFS) and overall survival (OS) with high incidences of recurrence and dissemination throughout the neuraxis via CSF [5-8]. Thus, in 2016, the term “anaplastic PXA (APXAs)” WHO grade III was introduced for tumors showing more than 5 mitosis/10 hpf with or without necrosis [8].
In the majority of cases, surgical resection is the treatment of choice [5,6]. However, owing to rarity, there is scant data on the utilization of radio or targeted therapies, and optimal management is guided by only case reports and a few case series [5,9,10]. Histology provides a diminutive understanding of the fundamental biology of PXAs and is unable to identify and steer novel molecularly targeted therapies. Various studies have demonstrated significant molecular heterogeneity in histologically similar tumors. Interestingly, an integrated analysis of 202 pediatric glioblastomas (GBs), 20% of histologically diagnosed GBs depicted methylation profiles akin to either low-grade gliomas or PXA and displayed favorable prognosis [11]. Despite a different prognosis, a substantial proportion of PXA and epithelioid GBs (eGB) exhibit similar histomorphological and molecular characteristics, like wild-type IDH1 and MGMT promoter hypermethylation [12]. Thus, histology alone is insufficient for accurate diagnosis and prognostication.
BRAF mutation is seen in 70% of PXAs and 17-65% of APXAs [13-16]. Although a superior survival and good response to BRAF targeted therapies is seen in mutant cases, no comparative prospective trials have yet been conducted in these patients [14,16]. Recently, studies have described the homozygous deletion of CDKN2A/B (8-83%) and its association with poor prognosis in PXAs/APXAs [17,19]. Further, BRAF mutation or CDKN2A deletion cannot be used as a diagnostic biomarker as these alterations are seen across several CNS tumors including eGBs [20-22]. Thus, these two markers alone or in combination with histologic features have limited success in diagnosis, prognostication, and overall biological understanding of these tumors [23].
Large-scale gene expression profiling can be used to identify tumor subtypes with distinct clinical phenotypes and offer an array of pathways that can be specifically targeted [23-25]. Our understanding of the pathogenesis of PXAs has been limited owing to rarity and as only a few studies have explored their molecular characteristics [11,19,26]. Hereby, our goal was to evaluate a gene expression-based histology independent classifier and check whether this tool is predictive of survival and develop a minimal robust gene signature panel for prognostication and designing effective therapeutic strategies.
Materials and methods
Case selection
PXA and APXA cases were histologically diagnosed over 13 years (2006-2019) and acquired from the files of four tertiary care hospitals. Approval to perform experiments with human patient samples was obtained from the institutional ethics committee (IEC-724/04.10.2018). Cases with sufficient tissue were identified in paraffin blocks. A total of fourteen PXA and six APXA were involved in the study. Histopathological characteristics were re-evaluated by three independent pathologists (CS, MCS, VS) following the WHO classification of CNS tumors from 2016. Patient information, signs and symptoms, tumor location and size, radiological imaging, and histopathological findings were recorded along with the clinical results.
RNA isolation
RNA was extracted from FFPE blocks using Recover All™ Total Nucleic Acid Isolation Kit as per manufacturer’s protocol (Thermo Scientific). RNA quality was checked via Agilent 2100 Bioanalyzer (M/s Agilent Technologies) using the RNA 6000 Nano Chip kit. Samples with RNA integrity number (RIN) above 5 were used for further analysis.
Microarray
The whole-transcriptome expression profiling was performed using SurePrint G3 Human CGH Microarray 8×60K kit (Agilent Technologies, Santa Clara, CA, USA), containing 60-mer high-quality probes. Each microarray contains over 55,077 distinct biological probes including mRNA, lncRNAs, and snoRNAs probes. Briefly, 100 ng quality-checked total RNA samples were selected for profiling through a Low Input Quick Amp labeling kit and then transcribed to Cy3-labeled cRNA according to the manufacturer’s protocol. Cy3-labeled cRNA samples (0.8 µg) were hybridized onto whole human SurePrint G3 8×60K arrays using Agilent’s Surehyb Chambers in an Agilent hybridization oven set at 65°C for 17 hours. Post hybridization slides were washed using wash buffers provided by manufacturers and subsequently scanned by an Agilent G4900DA SureScan Microarray Scanner. Images from the scanned array were extracted using Agilent’s Feature Extraction software (version 13.0) (Agilent Technologies, Santa Clara, CA, USA). The data have been submitted to www.ncbi.nlm.nih.gov/geo/ with the accession number GSE168904.
Data normalization and statistical analysis
The normalization of data and transformation steps were performed using GeneSpring GX (version-13.0) software for one-color oligonucleotide microarrays (Agilent Technologies, Santa Clara, CA, USA). Low-quality data were filtered out using principal component analysis. Differential genes were identified using moderated t-test between experimental samples. Benjamini and Hochberg false discovery rate (FDR) multiple testing corrections were applied to the differentially expressed genes (P<0.05) with cutoff logFC ≥2. Hierarchical clustering of significantly expressed genes was performed by average linkage and Euclidean distance as a measurement of similarity using GeneSpring GX (version-13.0).
cDNA conversion and qRT-PCR
Total RNA (1 µg) isolated from each sample was used to synthesize cDNA using SuperScript VILO cDNA Synthesis Kit as per manufacturer’s instructions (Thermo Fisher Scientific). Real-time PCR was carried out with CFX96 Touch Real-Time PCR Detection System (Bio-Rad, Hercules, CA, USA) using SYBR Green chemistry (iTaq SYBR master mix, BioRad). Briefly, the reactions were cycled at 95°C for 4 minutes, 40× (95°C for 8 s, 60°C for 20 s) with fluorescence measurements at the end of each cycle followed by melting curve analyses at the end of all amplification cycle to ensure PCR product specificity. All samples were analyzed in triplicates. Finally, fold change expression was calculated by using 2-ΔΔCt method.
Immunohistochemistry
Immunostaining was conducted on 5 micron-thick tumor sections of formalin-fixed paraffin-embedded (FFPEs) blocks using automatic immunostainer (Benchmark XT, Ventana, Tucson, AZ, USA). The standard operating protocol involves pretreatment by using cell conditioning buffer 1 (Ventana) for 52 min and the Ventana Signal Amplification standard. Immunohistochemistry (IHC) was carried out by using antibodies against glial fibrin acid proteins epithelial membrane antigen (EMA, Cell Marque, mouse monoclonal, 1:100), GFAP (DAKO, Polyclonal Rabbit, 1:1000), CD34 (DAKO, Polyclonal Rabbit, 1:100), synaptophysin (Spring monoclonal, Rabbit, 1:100), vimentin (Santacruz, mouse monoclonal, 1:100), Isocitrate dehydrogenase 1 (IDH1R32H, Dianova, mouse monoclonal, 1:50), P53 (Santa Cruz Biotechnology, Inc., CA, USA; dilution, 1:200), alpha-thalassemia/psychiatric retardation syndrome X linked (ATRX, Sigma Aldrich, St. Louis, MO, USA dilution 1:400), KI67 (DAKO, Glostrup, Denmark, Dilution 1:200), INI1 (Cell Marquee, monoclonal mouse, 1:100) and mutation in the 27th amino acid of histone H3 (H3K27M, Millipore, Billercia, MA, USA, Dilution 1:1000). The chromogen used in the experiment was diaminobenzidine. The presence and lack of markers, characteristics like intensity, staining pattern, and distribution, were also observed diligently. P53 staining was given a score of 0 if no cells were stained; 1+ if 0-10% stained; 2+ if 10-50% stained and 3+ if >50% stained. Grade 2+ and above was considered positive [27]. For the expression of H3K27M, intense nucleus staining in greater than 80% of cells was regarded as positive [27]. For IDH, both cytoplasmic and nuclear staining was construed as immune-positive. Only nuclear staining was taken into account for evaluation of ATRX expression. Cases with more than 10% positive tumor cells were scored positive. Internal positive controls taken were endothelial cells, cortical neurons, and infiltrating inflammatory cells which are generally positive for ATRX.
Fluorescence in situ hybridization
Fluorescence in situ hybridization (FISH) assay was conducted to test CDKN2A deletion on FFPEs. The controls used in this study involved sections from non-neoplastic cortical tissue obtained from epilepsy surgery specimens for each probe pair. The signals were scored in a minimum of 200 non-overlapping intact nuclei. For CDKN2A assay, locus-specific probes were used and paired with centromere probes for chromosomes 9 (Vysis LSI CDKN2A Spectrum orange/CEP9 Spectrum green probes, Downers Grove, IL). The loss of both green signals in each nucleus seen in a minimum of 20% nuclei indicated homozygous deletion of the CDKN2A. For EGFR assay, locus-specific probes paired with centromere probes for chromosomes 7 (CEP7, Vysis, Downers Grove, IL) were used. EGFR amplification was taken into account when more than 10% of tumor cells had either an EGFR: CEP7 ratio of >2 or countless tight clusters of signals of the probe. The threshold value was obtained by calculating the mean +3 SD of deletion observed in non-neoplastic brain tissue [28].
Mutation analysis of BRAF-V600E
The DNA was extracted from FFPE tissue sections by using the Recover All nucleic acid extraction kit (Invitrogen, Carlsbad, CA) and was quantitatively as well as qualitatively tested using Qubit (Invitrogen, Carlsbad, CA) and on the agarose gel. A total of 50 ng DNA was amplified by PCR for detection of BRAF V600E. The PCR reactions were conducted using the Taq DNA polymerase (Invitrogen, Carlsbad, CA) in an overall 20 microliter reaction mixture with the following conditions: [95°C for 10 min followed by 42 cycles (95°C for 30 s, 60°C for 35 s, 72°C for 90 s), and 72°C for 10 min]. The primer sequences for BRAF (codon 600) are provided in the Supplementary Table 1. The bi-directional sequencing was conducted using the Big Dye Terminator v3.1 Cycle Sequencing Kit (Applied Biosystems, Courtaboeuf, France) and the ABI 3500xL sequencer (Applied Biosystems, Foster City, CA) [28,29].
Statistical analysis
The distribution of overall survival (OS) and Progression-free survival (PFS) were calculated according to the Kaplan-Meier method, and a log-rank test was used to assess the significance of differences in survival. A P-value of less than 0.05 was considered statistically significant. OS was calculated to the date of death from any cause, or to the last follow-up date if the patient was alive and PFS included the time of first documentation of recurrence from the date of surgery or last follow-up date of the patient.
Results
Patient characteristics and histopathological findings
Fourteen PXAs and six APXAs were obtained for this study, including 16 male and 4 female patients. Three (15%) were pediatric and the remaining seventeen (85%) were adult. The mean age of PXAs and APXAs was 26 (range 10-52) and 28 (range 21-42) years, respectively. All PXAs/APXAs occurred in the cerebral hemispheres.
The radiological images depicted similar nonspecific characteristics that were well delineated, contrast-enhancing, and localized superficial cerebral masses with single and/or multiple cysts.
On histological examination, PXA cases showed large pleomorphic and frequently multinucleated cells, spindle and lipidized cells, a dense pericellular reticulin network, lymphocytic infiltrate, and numerous eosinophilic granular bodies. However, two of the PXA cases showed a sheet of rhabdoid-looking cells comprising more than 50% of the tumor area resembling eGB, and no mitosis or necrosis was noted. APXAs in addition showed more than five mitosis/10 HPF, and microvascular proliferation with necrosis. The cases, which were histologically representing classical PXA, were extensively positive for synaptophysin, GFAP, and EMA while these markers displayed patchy and variable positivity in APXA. CD34 positivity was seen in 25% of cases (5/20, all grade II). Vimentin immunostaining was diffusely positive in all the cases. MIB-1 labeling index was high in APXA (mean =17%) as compared to classical PXA (mean =3.83%). All tumors had wildtype IDH1 (R132H), and retained ATRX and INI1 expression. None of the tumors expressed H3K27M mutant protein. P53 expression was observed in 14.28% PXA (2/14) and 16.66% APXA (1/6) cases. The histopathological and immunohistochemical findings of all cases are summarized in Figure 1.
Figure 1.

Clinical and histological (A), and immunohistochemical and molecular features (B) of cases in two clusters.
Molecular analysis
There was no association of BRAF V600E mutation with tumor grade as it was detected in 57.14% (8/14) PXA’s and 33.33% (2/6) APXAs (P=0.3847). There were complete (100%) concorded results observed in the detection of BRAF V600E mutation by both IHC and Sanger sequencing. CDKN2A deletion was observed in 64.28% (9/14) PXA and 50% (3/6) APXA cases (P=0.5924). Though only a small subset of cases (15%, 3/20 all grade II) harbored both the alterations, none of the cases showed EGFR amplification.
Gene expression profiling
Initial exploratory analyses of the protein-coding gene expression profiles were carried out. Principal Component Analyses (PCA) and unsupervised hierarchal clustering analysis showed a clear separation of PXA and APXA samples from the controls (Figure 2).
Figure 2.

PCA plot (A) and unsupervised hierarchal clustering (B) of expression array depicting two distinct PXA clusters.
Unsupervised hierarchal clustering depicted two distinct molecular clusters. PXA and APXA were seen in both clusters, suggesting the presence of molecular heterogeneity within the same grade. Cluster 1 comprised 77% PXA (10/13) and 23% APXAs (3/13) cases, while cluster 2 was composed of 57% PXAs (4/7) and 43% APXAs (3/7).
DEGs in two clusters
A total of 10 differentially upregulated and 418 downregulated genes were identified between the PXA clusters (Supplementary Table 1). The 10 most significantly up- or down-regulated DEGs are shown in Figure 3A. The majority of these genes are known to play important role in neurological disorders, cell growth, division, immune response, and cell cycle. The box plots of some of the top candidate DEGs are shown in Figure 3B.
Figure 3.
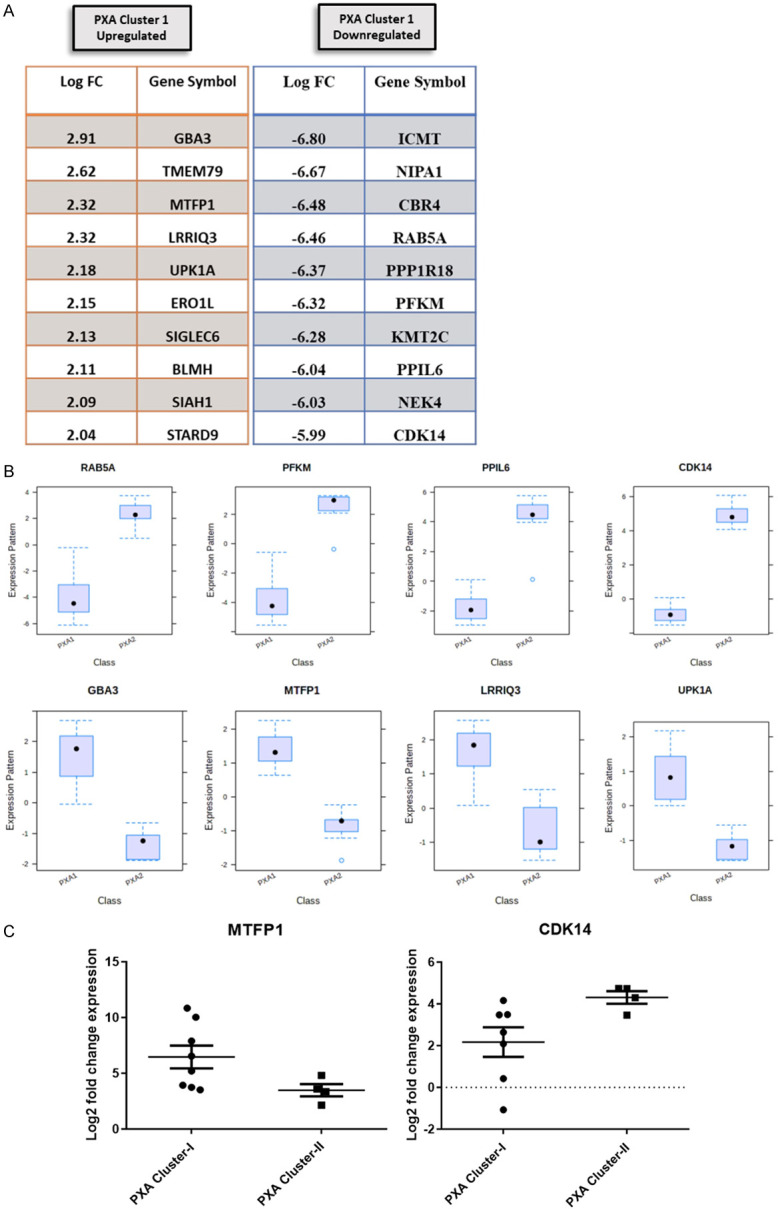
Top 10 differentially expressed genes among two cluster (A), box plots representation of some top deregulated genes (B), and scatter plot of MTFP1 and CDK14 expression by qRT PCR (C).
qRT-PCR validation of Mitochondrial Fission Process 1 genes (MTFP1, upregulated in cluster 1) and Cyclin-Dependent Kinase 14 (CDK14, upregulated in cluster 2) expression was performed. On qRT PCR analysis, MTFP1 (P=0.0485) was significantly up-regulated in PXA cluster 1 and CDK14 (P=0.0424) in cluster 2, highlighting a strong concordance with expression array (Figure 3C).
Correlation of gene expression profiling based clusters with age, sex, immunohistochemical and molecular markers
Patients in cluster 2 were slightly younger as compared to those in cluster 1 (mean age 22.14 years versus 29 years). There was a male preponderance with an M:F ratio of 6:1 in cluster 2 and 3.3:1 in cluster 1. There was no difference in immunohistochemical profile or frequency of BRAF mutation (53.84%, 7/13 vs. 42.85%, 3/7) (P=0.6749) and CDKN2A deletion (61.5%, 8/13 vs. 57.14%, 4/7) (P=0.8591) in two clusters.
Survival analysis
In the current study, the patient follow-up period varied from 17 to 176 months with a mean follow-up of 55.33 months. Based on histological grading, tumor recurrence was observed in 14.28% (2/14) of grade II versus 66.66% (4/6) of grade III tumors. Based on the expression array, only 7.69% (1/13) cases in cluster 1 while 71.42% (5/7) cases in cluster 2 recurred. Among grade II tumors, none in cluster 1 (0/10) while 50% (2/4) in cluster 2 recurred. Similarly, among APXAs, only 33.33% (1/3) in cluster 1 while all the cases (3/3) in cluster 2 recurred. Further, there was no difference in frequency of BRAF mutation (33.33%, 2/6 vs. 57.14%, 8/14) (P=0.3847) or CDKN2A deletion (50%, 3/6 vs. 64.27%, 9/14) (P=0.5924) in recurrent versus non recurrent tumors. Among 3 PXAs with concomitant BRAF and CDKN2A deletion, only one case (33%) recurred. Thus, mRNA profiling-based prediction of recurrence is superior to and independent of histological grade, BRAF mutation, or CDKN2A deletion status.
There was no significant difference in OS between grade II and grade III (mean OS 62.45 vs. 44.14 months, P=0.08) tumors, however, a statistically significant difference in PFS (mean PFS 60.90 vs. 40.14 months, P=0.019) was noted. A relatively better OS was observed in PXA cluster 1 (mean OS 70.5 months in cluster 1 vs. 25.5 months in cluster 2), however, it did not reach statistical significance (P=0.09). The difference in PFS between the two clusters was definitively more significant (mean PFS 69.33 months in cluster 1 vs. 19.8 months in cluster 2, P=0.003) as compared to histology. There was no significant difference in OS or PFS between BRAF mutant and wild type cases (P=0.8995, P=0.3022) or CDKN2A deleted versus non deleted (P=0.0977, P=0.4999) (Figure 4).
Figure 4.

Kaplan Meier survival estimates showing that patients with histological diagnosis of APXA had a relatively poorer OS (A) and significantly poorer PFS (B) as compared to PXA (P=0.0804, P=0.0194). The cases in cluster 2 had a poor OS (C) and significantly worse PFS (D) as compared to cluster 1 (P=0.0973, P=0.003). The difference in OS (E) and PFS (F) among BRAF mutant and wild type cases was not significant (P=0.8995, P=0.3022). There was no significant difference in OS (G) and PFS (H) in cases with CDKN2A deletion versus no deletion (P=0.0977, P=0.4999).
Discussion
PXA is a rare astrocytic tumor, described for the first time by Kepes et al. in 1979 [9,30]. The current histopathological approach for the classification of PXA/APXAs is subjective with interobserver variability. It offers a minimal understanding of the underlying biology and plays no role in determining potential treatment strategies, or likely responses to treatment.
As discussed previously, several high throughput studies have highlighted the morphologic and molecular similarities within the PXA, APXAs, and eGBs [19,26]. Further, PXAs can even be misdiagnosed as eGBs [11]. Thus, there is a need to gain a better insight into molecular markers for prognostication of these entities irrespective of histological subtype or grade. In the present study, unsupervised hierarchal clustering of mRNA expression profiles uncovered two distinct molecular clusters (cluster 1 and cluster 2) with both grades of PXA in each cluster implicating heterogeneity within the same grade. Discrete gene expression signatures and survival (poor PFS in cluster 2) were observed between the two clusters. Expression profiling provided a more powerful prediction of recurrence, independent of histological grade, BRAF mutation, or CDKN2A deletion status.
There were 428 dysregulated genes (10 up and 418 down-regulated) between the two clusters. Kyoto Encyclopedia of Genes and Genomes (KEGG) analyses demonstrated that these genes are mainly associated with the following pathways: ABC transporters, mTOR signaling pathway, P13K-Akt signaling pathway, and Ras signaling pathway. Further, among the most significantly dysregulated genes across two clusters, MTFP1 and CDK14 were validated by qRT PCR. A high level of concordance between expression profiling and qRT PCR was observed. MTFP1 was up-regulated in PXA cluster 1 (P=0.0485). MTFP1, a nuclear-encoded protein promotes mitochondrial fission, induces the progression of the cell cycle, and suppresses cell apoptosis [31,32]. Its overexpression mediates mitochondrial fragmentation and subsequent reactive oxygen species (ROS) production. Increased expression of mitochondrial fission proteins and their association with tumor progression has been documented in several cancers [33-36]. MTFP1 has been known to play a critical oncogenic role in oral squamous cell carcinoma (OSCC) carcinogenesis and may be a potential candidate for therapeutic target [36].
CDK14 expression was raised in PXA cluster 2. CDK14 is a known cell cycle regulator and it has been shown to be linked with poor prognosis in gliomas and is also being explored as a potential therapeutic target [37,38]. CDK14 upregulation is associated with poor prognosis in GB patients [39]. CDK14 acts as an oncogene by deregulating several molecular signaling pathways, including the phosphoinositide 3 kinase (PI3K)/Akt and Wnt/β-catenin signaling pathway and cellular mechanisms [40,41]. Thus, CDK14 expression could be explored across various platforms for its efficacy as a prognostic and therapeutic biomarker.
GBA3, TMEM79, and UPK1A were found to be downregulated in PXA cluster 2 akin to some studies that have reported reduced expression of these genes in cancer patients. The low levels of expression of GBA3 were shown to be associated with a worse prognosis in hepatocellular carcinomas [42]. TMEM79 showed decreased expression and loss of immunoreactivity in prostate cancer as compared to normal prostate and was thus considered as a diagnostic marker [43]. UPK1A downregulation has been known to inhibit proliferation and promote apoptosis of bladder transitional cell carcinoma cells, signifying its potency as a therapeutic target [44].
ICMT, RAB5A, and KMT2C were upregulated in PXA cluster 2 and these genes have been previously documented to have elevated levels of expression in various cancers. ICMT is associated with tumor aggressiveness, chemoresistance via multiple oncogenic pathways and possibly has a therapeutic role in Ras-Driven Acute Myeloid Leukemia [45,46]. RAB5A is overexpressed in breast cancer patients and promotes aggressiveness through regulation of the Wnt/β-catenin pathway. It also promotes migration and invasion in hepatocellular carcinoma [47]. Further, KMT2C promoter methylation has been stated as a prognostic biomarker in plasma-circulating tumor DNA in non-small cell lung cancer [48].
Next-generation sequencing-based studies have documented BRAF V600E and loss of CDKN2A as the most common genetic alterations in PXA and APXAs [19,26]. BRAF, a part of the RAS-RAF-MEK-ERK-MAP kinase pathway, is frequently activated in many human tumors [49]. BRAF V600E mutation has been observed in approximately 17-70% of PXA/APXAs. BRAF mutant cases have a better prognosis and good response to targeted therapies [14,15,50]. In our study, 50% (10/20) of PXA/APXAs cases harbored BRAF V600E mutation. There was no significant difference in frequency of mutation between two WHO grades or mRNA profiling-based clusters. We also could not elucidate any association of BRAF status with OS or PFS.
Homozygous deletion in CDKN2A/2B, a tumor suppressor gene, results in cellular proliferation and the deregulation of the cell cycle. CDKN2A/2B is as common as BRAF V600E and has been reported in 8-83% of PXA and APXAs [17]. Vaubel et al. observed CDKN2A/B deletions in a similar proportion of PXA (83%) and APXA (93%) cases [18]. In the present study overall, 60% (12/20) cases showed CDKN2A deletion. However, there was no significant difference in its frequency between two histological grades, expression profiling-based clusters, or association with OS/PFS.
Thus, summarizing expression profiling provides definitive insights into PXAs biology as we could identify unrecognized heterogeneity within the same grade. It is possibly a better platform for risk stratification as we observed distinct survival in two molecular clusters and slightly better prediction of recurrence as compared to histology. The study is however limited by the number of cases available for evaluation. Gene signatures like CDK14 and other top dysregulated DEGs identified in the present study can be explored for their use as prognostic and therapeutic biomarkers. Further studies analyzing their expression on other platforms like qRT-PCR, Nanostring, and IHC with long-term clinical follow-up and functional characterization are warranted to explicate their robustness and applicability in the routine clinical workup of PXAs.
Conclusion
This is the first comprehensive analysis highlighting the distinct molecular repertoire of PXAs which lays the foundation for future development of a robust and cost-effective panel of biomarkers to facilitate risk stratification and suggest novel drug targets.
Acknowledgements
We are thankful for financial support for funds and support received from J C Bose Fellowship of Prof. Chitra Sarkar.
Disclosure of conflict of interest
None.
Supporting Information
References
- 1.Crespo-Rodríguez AM, Smirniotopoulos JG, Rushing EJ. MR and CT imaging of 24 pleomorphic xanthoastrocytomas (PXA) and a review of the literature. Neuroradiology. 2007;49:307–315. doi: 10.1007/s00234-006-0191-z. [DOI] [PubMed] [Google Scholar]
- 2.Kleihues P, Burger PC, Scheithauer BW. World Health Organization. 2nd ed. New York: Springer-Verlag; 1993. Histological typing of tumours of the central nervous system; pp. 11–4. [Google Scholar]
- 3.Kepes JJ, Louis DN, Giannini C, Paulus W. Pathology and genetics of tumours of the nervous system. In: Kleihues P, Cavenee WK, editors. World Health Organization Classification of Tumours. Lyon: IARC Press; 2000. pp. 52–54. [Google Scholar]
- 4.Kahramancetin N, Tihan T. Aggressive behavior and anaplasia in pleomorphic xanthoastrocytoma: a plea for a revision of the current WHO classification. CNS Oncol. 2013;2:523–30. doi: 10.2217/cns.13.56. [DOI] [PMC free article] [PubMed] [Google Scholar]
- 5.Shaikh N, Brahmbhatt N, Kruser TJ, Kam KL, Appin CL, Wadhwani N, Chandler J, Kumthekar P, Lukas RV. Pleomorphic xanthoastrocytoma: a brief review. CNS Oncol. 2019;8:CNS39. doi: 10.2217/cns-2019-0009. [DOI] [PMC free article] [PubMed] [Google Scholar]
- 6.Giannini C, Scheithauer BW, Burger PC, Brat DJ, Wollan PC, Lach B, O’Neill BP. Pleomorphic xanthoastrocytoma: what do we really know about it? Cancer. 1999;85:2033–45. [PubMed] [Google Scholar]
- 7.Bayindir C, Balak N, Karasu A, Kasaroğlu D. Anaplastic pleomorphic xanthoastrocytoma. Childs Nerv Syst. 1997;13:50–6. doi: 10.1007/s003810050040. [DOI] [PubMed] [Google Scholar]
- 8.Louis DN, Ohgaki H, Wiestler OD, Cavenee WK, editors. WHO classification of tumours of the central nervous system. revised 4th ed. Lyon: IARC; 2016. pp. 94–99. [Google Scholar]
- 9.Kepes JJ, Rubinstein LJ, Ansbacher L, Schreiber DJ. Histopathological features of recurrent pleomorphic xanthoastrocytomas: further corroboration of the glial nature of this neoplasm. A study of 3 cases. Acta Neuropathol. 1989;78:585–593. doi: 10.1007/BF00691285. [DOI] [PubMed] [Google Scholar]
- 10.Perry A, Giannini C, Scheithauer BW, Rojiani AM, Yachnis AT, Seo IS, Johnson PC, Kho J, Shapiro S. Composite pleomorphic xanthoastrocytoma and ganglioglioma: report of four cases and review of the literature. Am J Surg Pathol. 1997;21:763–71. doi: 10.1097/00000478-199707000-00004. [DOI] [PubMed] [Google Scholar]
- 11.Korshunov A, Ryzhova M, Hovestadt V, Bender S, Sturm D, Capper D, Meyer J, Schrimpf D, Kool M, Northcott PA, Zheludkova O, Milde T, Witt O, Kulozik AE, Reifenberger G, Jabado N, Perry A, Lichter P, von Deimling A, Pfister SM, Jones DT. Integrated analysis of pediatric glioblastoma reveals a subset of biologically favorable tumors with associated molecular prognostic markers. Acta Neuropathol. 2015;129:669–78. doi: 10.1007/s00401-015-1405-4. [DOI] [PubMed] [Google Scholar]
- 12.Lehman NL, Hattab EM, Mobley BC, Usubalieva A, Schniederjan MJ, McLendon RE, Paulus W, Rushing EJ, Georgescu MM, Couce M, Dulai MS, Cohen ML, Pierson CR, Raisanen JM, Martin SE, Lehman TD, Lipp ES, Bonnin JM, Al-Abbadi MA, Kenworthy K, Zhao K, Mohamed N, Zhang G, Zhao W. Morphological and molecular features of astroblastoma, including BRAFV600E mutations, suggest an ontological relationship to other cortical-based gliomas of children and young adults. Neuro Oncol. 2017;19:31–42. doi: 10.1093/neuonc/now118. [DOI] [PMC free article] [PubMed] [Google Scholar]
- 13.Dias-Santagata D, Lam Q, Vernovsky K, Vena N, Lennerz JK, Borger DR, Batchelor TT, Ligon KL, Iafrate AJ, Ligon AH, Louis DN, Santagata S. BRAF V600E mutations are common in pleomorphic xanthoastrocytoma: diagnostic and therapeutic implications. PLoS One. 2011;6:e17948. doi: 10.1371/journal.pone.0017948. [DOI] [PMC free article] [PubMed] [Google Scholar]
- 14.Ida CM, Rodriguez FJ, Burger PC, Caron AA, Jenkins SM, Spears GM, Aranguren DL, Lachance DH, Giannini C. Pleomorphic xanthoastrocytoma: natural history and long-term follow-up. Brain Pathol. 2015;25:575–86. doi: 10.1111/bpa.12217. [DOI] [PMC free article] [PubMed] [Google Scholar]
- 15.Schindler G, Capper D, Meyer J, Janzarik W, Omran H, Herold-Mende C, Schmieder K, Wesseling P, Mawrin C, Hasselblatt M, Louis DN, Korshunov A, Pfister S, Hartmann C, Paulus W, Reifenberger G, von Deimling A. Analysis of BRAF V600E mutation in 1,320 nervous system tumors reveals high mutation frequencies in pleomorphic xanthoastrocytoma, ganglioglioma and extra-cerebellar pilocytic astrocytoma. Acta Neuropathol. 2011;121:397–405. doi: 10.1007/s00401-011-0802-6. [DOI] [PubMed] [Google Scholar]
- 16.Chamberlain MC. Salvage therapy with BRAF inhibitors for recurrent pleomorphic xanthoastrocytoma: a retrospective case series. J Neurooncol. 2013;114:237–40. doi: 10.1007/s11060-013-1176-5. [DOI] [PubMed] [Google Scholar]
- 17.Weber RG, Hoischen A, Ehrler M, Zipper P, Kaulich K, Blaschke B, Becker AJ, Weber-Mangal S, Jauch A, Radlwimmer B, Schramm J, Wiestler OD, Lichter P, Reifenberger G. Frequent loss of chromosome 9, homozygous CDKN2A/p14(ARF)/CDKN2B deletion and low TSC1 mRNA expression in pleomorphic xanthoastrocytomas. Oncogene. 2007;26:1088–97. doi: 10.1038/sj.onc.1209851. [DOI] [PubMed] [Google Scholar]
- 18.Vaubel RA, Caron AA, Yamada S, Decker PA, Eckel Passow JE, Rodriguez FJ, Nageswara Rao AA, Lachance D, Parney I, Jenkins R, Giannini C. Recurrent copy number alterations in low-grade and anaplastic pleomorphic xanthoastrocytoma with and without BRAF V600E mutation. Brain Pathol. 2018;28:172–182. doi: 10.1111/bpa.12495. [DOI] [PMC free article] [PubMed] [Google Scholar]
- 19.Zou H, Duan Y, Wei D, Zhang Y, Dai J, Li J, Li X, Zhou J, Liu Z, Jin Z, Zhang Z, Yu Y, Hu Z. Molecular features of pleomorphic xanthoastrocytoma. Hum Pathol. 2019;86:38–48. doi: 10.1016/j.humpath.2018.08.038. [DOI] [PubMed] [Google Scholar]
- 20.Wang J, Liu Z, Cui Y, Liu Y, Fang J, Xu L, He Y, Du J, Su Y, Zou W, Xu Z, Li G. Evaluation of EZH2 expression, BRAF V600E mutation, and CDKN2A/B deletions in epithelioid glioblastoma and anaplastic pleomorphic xanthoastrocytoma. J Neurooncol. 2019;144:137–146. doi: 10.1007/s11060-019-03212-0. [DOI] [PubMed] [Google Scholar]
- 21.Behling F, Schittenhelm J. Oncogenic BRAF alterations and their role in brain tumors. Cancers (Basel) 2019;11:794. doi: 10.3390/cancers11060794. [DOI] [PMC free article] [PubMed] [Google Scholar]
- 22.Reis GF, Pekmezci M, Hansen HM, Rice T, Marshall RE, Molinaro AM, Phillips JJ, Vogel H, Wiencke JK, Wrensch MR, Walsh KM, Perry A. CDKN2A loss is associated with shortened overall survival in lower-grade (World Health Organization grades II-III) astrocytomas. J Neuropathol Exp Neurol. 2015;74:442–52. doi: 10.1097/NEN.0000000000000188. [DOI] [PMC free article] [PubMed] [Google Scholar]
- 23.Freije WA, Castro-Vargas FE, Fang Z, Horvath S, Cloughesy T, Liau LM, Mischel PS, Nelson SF. Gene expression profiling of gliomas strongly predicts survival. Cancer Res. 2004;64:6503–10. doi: 10.1158/0008-5472.CAN-04-0452. [DOI] [PubMed] [Google Scholar]
- 24.Shai R, Shi T, Kremen TJ, Horvath S, Liau LM, Cloughesy TF, Mischel PS, Nelson SF. Gene expression profiling identifies molecular subtypes of gliomas. Oncogene. 2003;22:4918–23. doi: 10.1038/sj.onc.1206753. [DOI] [PubMed] [Google Scholar]
- 25.Yin W, Tang G, Zhou Q, Cao Y, Li H, Fu X, Wu Z, Jiang X. Expression profile analysis identifies a novel five-gene signature to improve prognosis prediction of glioblastoma. Front Genet. 2019;10:419. doi: 10.3389/fgene.2019.00419. [DOI] [PMC free article] [PubMed] [Google Scholar]
- 26.Phillips JJ, Gong H, Chen K, Joseph NM, van Ziffle J, Bastian BC, Grenert JP, Kline CN, Mueller S, Banerjee A, Nicolaides T, Gupta N, Berger MS, Lee HS, Pekmezci M, Tihan T, Bollen AW, Perry A, Shieh JTC, Solomon DA. The genetic landscape of anaplastic pleomorphic xanthoastrocytoma. Brain Pathol. 2019;29:85–96. doi: 10.1111/bpa.12639. [DOI] [PMC free article] [PubMed] [Google Scholar]
- 27.Jha P, Manjunath N, Singh J, Mani K, Garg A, Kaur K, Sharma MC, Raheja A, Suri A, Sarkar C, Suri V. Analysis of PD-L1 expression and T cell infiltration in different molecular subgroups of diffuse midline gliomas. Neuropathology. 2019;39:413–424. doi: 10.1111/neup.12594. [DOI] [PubMed] [Google Scholar]
- 28.Khanna G, Pathak P, Suri V, Sharma MC, Chaturvedi S, Ahuja A, Bhardwaj M, Garg A, Sarkar C, Sharma R. Immunohistochemical and molecular genetic study on epithelioid glioblastoma: series of seven cases with review of literature. Pathol Res Pract. 2018;214:679–685. doi: 10.1016/j.prp.2018.03.019. [DOI] [PubMed] [Google Scholar]
- 29.Zhang J, Wu G, Miller CP, Tatevossian RG, Dalton JD, Tang B, Orisme W, Punchihewa C, Parker M, Qaddoumi I, Boop FA, Lu C, Kandoth C, Ding L, Lee R, Huether R, Chen X, Hedlund E, Nagahawatte P, Rusch M, Boggs K, Cheng J, Becksfort J, Ma J, Song G, Li Y, Wei L, Wang J, Shurtleff S, Easton J, Zhao D, Fulton RS, Fulton LL, Dooling DJ, Vadodaria B, Mulder HL, Tang C, Ochoa K, Mullighan CG, Gajjar A, Kriwacki R, Sheer D, Gilbertson RJ, Mardis ER, Wilson RK, Downing JR, Baker SJ, Ellison DW St. Jude Children’s Research Hospital-Washington University Pediatric Cancer Genome Project. Whole-genome sequencing identifies genetic alterations in pediatric low-grade gliomas. Nat Genet. 2013;45:602–12. doi: 10.1038/ng.2611. [DOI] [PMC free article] [PubMed] [Google Scholar]
- 30.Kepes JJ, Rubinstein LJ, Eng LF. Pleomorphic xanthoastrocytoma: a distinctive meningocerebral glioma of young subjects with relatively favorable prognosis. A study of 12 cases. Cancer. 1979;44:1839–1852. doi: 10.1002/1097-0142(197911)44:5<1839::aid-cncr2820440543>3.0.co;2-0. [DOI] [PubMed] [Google Scholar]
- 31.Morita M, Prudent J, Basu K, Goyon V, Katsumura S, Hulea L, Pearl D, Siddiqui N, Strack S, McGuirk S, St-Pierre J, Larsson O, Topisirovic I, Vali H, McBride HM, Bergeron JJ, Sonenberg N. mTOR controls mitochondrial dynamics and cell survival via MTFP1. Mol Cell. 2017;67:922–935. e5. doi: 10.1016/j.molcel.2017.08.013. [DOI] [PubMed] [Google Scholar]
- 32.Tondera D, Czauderna F, Paulick K, Schwarzer R, Kaufmann J, Santel A. The mitochondrial protein MTP18 contributes to mitochondrial fission in mammalian cells. J Cell Sci. 2005;118:3049–3059. doi: 10.1242/jcs.02415. [DOI] [PubMed] [Google Scholar]
- 33.Huang Q, Zhan L, Cao H, Li J, Lyu Y, Guo X, Zhang J, Ji L, Ren T, An J, Liu B, Nie Y, Xing J. Increased mitochondrial fission promotes autophagy and hepatocellular carcinoma cell survival through the ROS-modulated coordinated regulation of the NFKB and TP53 pathways. Autophagy. 2016;12:999–1014. doi: 10.1080/15548627.2016.1166318. [DOI] [PMC free article] [PubMed] [Google Scholar]
- 34.Kim ES, Park SJ, Goh MJ, Na YJ, Jo DS, Jo YK, Shin JH, Choi ES, Lee HK, Kim JY, Jeon HB, Kim JC, Cho DH. Mitochondrial dynamics regulate melanogenesis through proteasomal degradation of MITF via ROS-ERK activation. Pigment Cell Melanoma Res. 2014;27:1051–62. doi: 10.1111/pcmr.12298. [DOI] [PubMed] [Google Scholar]
- 35.Rehman J, Zhang HJ, Toth PT, Zhang Y, Marsboom G, Hong Z, Salgia R, Husain AN, Wietholt C, Archer SL. Inhibition of mitochondrial fission prevents cell cycle progression in lung cancer. FASEB J. 2012;26:2175–86. doi: 10.1096/fj.11-196543. [DOI] [PMC free article] [PubMed] [Google Scholar]
- 36.Xiao T, Sun J, Xing Z, Xie F, Yang L, Ding W. MTFP1 overexpression promotes the growth of oral squamous cell carcinoma by inducing ROS production. Cell Biol Int. 2020;44:821–829. doi: 10.1002/cbin.11278. [DOI] [PubMed] [Google Scholar]
- 37.Li Q, Zhou L, Wang M, Wang N, Li C, Wang J, Qi L. MicroRNA-613 impedes the proliferation and invasion of glioma cells by targeting cyclin-dependent kinase 14. Biomed Pharmacother. 2018;98:636–642. doi: 10.1016/j.biopha.2017.12.044. [DOI] [PubMed] [Google Scholar]
- 38.Zhen Y, Nan Y, Guo S, Zhang L, Li G, Yue S, Liu X. Knockdown of NEAT1 repressed the malignant progression of glioma through sponging miR-107 and inhibiting CDK14. J Cell Physiol. 2019;234:10671–10679. doi: 10.1002/jcp.27727. [DOI] [PubMed] [Google Scholar]
- 39.Lu F, Li C, Sun Y, Jia T, Li N, Li H. Upregulation of miR-1825 inhibits the progression of glioblastoma by suppressing CDK14 though Wnt/β-catenin signaling pathway. World J Surg Oncol. 2020;18:147. doi: 10.1186/s12957-020-01927-3. [DOI] [PMC free article] [PubMed] [Google Scholar]
- 40.Yang L, Zhu J, Huang H, Yang Q, Cai J, Wang Q, Zhu J, Shao M, Xiao J, Cao J, Gu X, Zhang S, Wang Y. PFTK1 promotes gastric cancer progression by regulating proliferation, migration and invasion. PLoS One. 2015;10:e0140451. doi: 10.1371/journal.pone.0140451. [DOI] [PMC free article] [PubMed] [Google Scholar]
- 41.Wang B, Zou A, Ma L, Chen X, Wang L, Zeng X, Tan T. miR-455 inhibits breast cancer cell proliferation through targeting CDK14. Eur J Pharmacol. 2017;807:138–143. doi: 10.1016/j.ejphar.2017.03.016. [DOI] [PubMed] [Google Scholar]
- 42.Ying JF, Zhang YN, Song SS, Hu ZM, He XL, Pan HY, Zhang CW, Wang HJ, Li WF, Mou XZ. Decreased expression of GBA3 correlates with a poor prognosis in hepatocellular carcinoma patients. Neoplasma. 2020;67:1139–1145. doi: 10.4149/neo_2020_190928N980. [DOI] [PubMed] [Google Scholar]
- 43.O’Hurley G, Busch C, Fagerberg L, Hallström BM, Stadler C, Tolf A, Lundberg E, Schwenk JM, Jirström K, Bjartell A, Gallagher WM, Uhlén M, Pontén F. Analysis of the human prostate-specific proteome defined by transcriptomics and antibody-based profiling identifies TMEM79 and ACOXL as two putative, diagnostic markers in prostate cancer. PLoS One. 2015;10:e0133449. doi: 10.1371/journal.pone.0133449. [DOI] [PMC free article] [PubMed] [Google Scholar]
- 44.Zhu H, Tang Y, Zhang X, Jiang X, Wang Y, Gan Y, Yang J. Downregulation of UPK1A suppresses proliferation and enhances apoptosis of bladder transitional cell carcinoma cells. Med Oncol. 2015;32:84. doi: 10.1007/s12032-015-0541-y. [DOI] [PubMed] [Google Scholar]
- 45.Marín-Ramos NI, Balabasquer M, Ortega-Nogales FJ, Torrecillas IR, Gil-Ordóñez A, Marcos-Ramiro B, Aguilar-Garrido P, Cushman I, Romero A, Medrano FJ, Gajate C, Mollinedo F, Philips MR, Campillo M, Gallardo M, Martín-Fontecha M, López-Rodríguez ML, Ortega-Gutiérrez S. A potent isoprenylcysteine carboxylmethyltransferase (ICMT) inhibitor improves survival in ras-driven acute myeloid leukemia. J Med Chem. 2019;62:6035–6046. doi: 10.1021/acs.jmedchem.9b00145. [DOI] [PubMed] [Google Scholar]
- 46.Borini Etichetti C, Di Benedetto C, Rossi C, Baglioni MV, Bicciato S, Del Sal G, Menacho-Marquez M, Girardini J. Isoprenylcysteine carboxy methyltransferase (ICMT) is associated with tumor aggressiveness and its expression is controlled by the p53 tumor suppressor. J Biol Chem. 2019;294:5060–5073. doi: 10.1074/jbc.RA118.006037. [DOI] [PMC free article] [PubMed] [Google Scholar]
- 47.Yang PS, Yin PH, Tseng LM, Yang CH, Hsu CY, Lee MY, Horng CF, Chi CW. Rab5A is associated with axillary lymph node metastasis in breast cancer patients. Cancer Sci. 2011;102:2172–8. doi: 10.1111/j.1349-7006.2011.02089.x. [DOI] [PubMed] [Google Scholar]
- 48.Mastoraki S, Balgkouranidou I, Tsaroucha E, Klinakis A, Georgoulias V, Lianidou E. KMT2C promoter methylation in plasma-circulating tumor DNA is a prognostic biomarker in non-small cell lung cancer. Mol Oncol. 2021;15:2412–2422. doi: 10.1002/1878-0261.12848. [DOI] [PMC free article] [PubMed] [Google Scholar]
- 49.Davies H, Bignell GR, Cox C, Stephens P, Edkins S, Clegg S, Teague J, Woffendin H, Garnett MJ, Bottomley W, Davis N, Dicks E, Ewing R, Floyd Y, Gray K, Hall S, Hawes R, Hughes J, Kosmidou V, Menzies A, Mould C, Parker A, Stevens C, Watt S, Hooper S, Wilson R, Jayatilake H, Gusterson BA, Cooper C, Shipley J, Hargrave D, Pritchard-Jones K, Maitland N, Chenevix-Trench G, Riggins GJ, Bigner DD, Palmieri G, Cossu A, Flanagan A, Nicholson A, Ho JW, Leung SY, Yuen ST, Weber BL, Seigler HF, Darrow TL, Paterson H, Marais R, Marshall CJ, Wooster R, Stratton MR, Futreal PA. Mutations of the BRAF gene in human cancer. Nature. 2002;417:949–54. doi: 10.1038/nature00766. [DOI] [PubMed] [Google Scholar]
- 50.Li T, Forbes ME, Fuller GN, Li J, Yang X, Zhang W. IGFBP2: integrative hub of developmental and oncogenic signaling network. Oncogene. 2020;39:2243–2257. doi: 10.1038/s41388-020-1154-2. [DOI] [PMC free article] [PubMed] [Google Scholar]
Associated Data
This section collects any data citations, data availability statements, or supplementary materials included in this article.